Meta-Analysis
. 2022 Feb 5;14(1):23.
doi: 10.1186/s13195-022-00961-5.

Altered central and blood glutathione in Alzheimer's disease and mild cognitive impairment: a meta-analysis

Affiliations
Meta-Analysis

Altered central and blood glutathione in Alzheimer's disease and mild cognitive impairment: a meta-analysis

Jinghan Jenny Chen et al. Alzheimers Res Ther. .

Abstract

Background: Increasing evidence implicates oxidative stress (OS) in Alzheimer disease (AD) and mild cognitive impairment (MCI). Depletion of the brain antioxidant glutathione (GSH) may be important in OS-mediated neurodegeneration, though studies of post-mortem brain GSH changes in AD have been inconclusive. Recent in vivo measurements of the brain and blood GSH may shed light on GSH changes earlier in the disease.

Aim: To quantitatively review in vivo GSH in AD and MCI compared to healthy controls (HC) using meta-analyses.

Method: Studies with in vivo brain or blood GSH levels in MCI or AD with a HC group were identified using MEDLINE, PsychInfo, and Embase (1947-June 2020). Standardized mean differences (SMD) and 95% confidence intervals (CI) were calculated for outcomes using random effects models. Outcome measures included brain GSH (Meshcher-Garwood Point Resolved Spectroscopy (MEGA-PRESS) versus non-MEGA-PRESS) and blood GSH (intracellular versus extracellular) in AD and MCI. The Q statistic and Egger's test were used to assess heterogeneity and risk of publication bias, respectively.

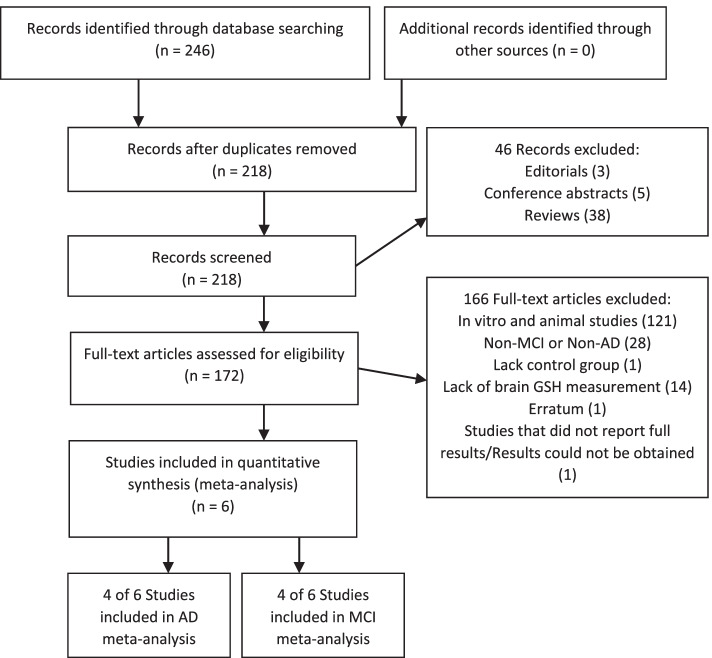
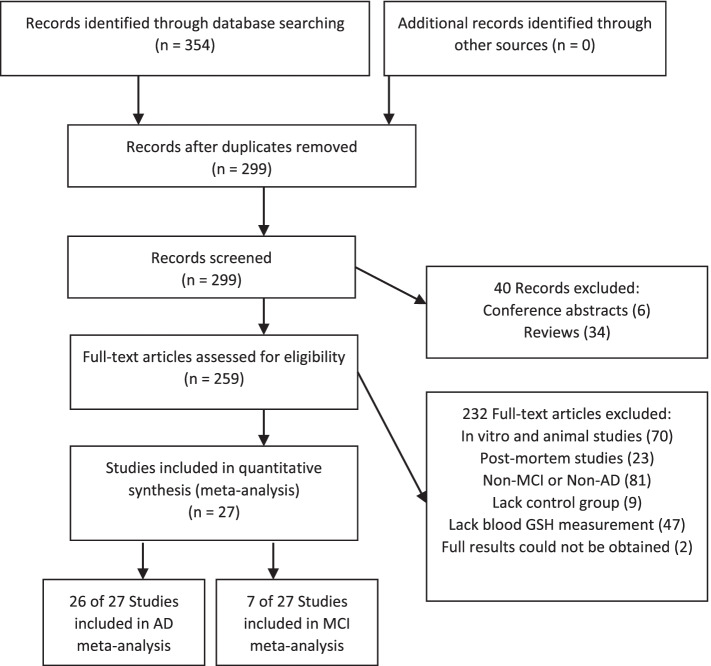
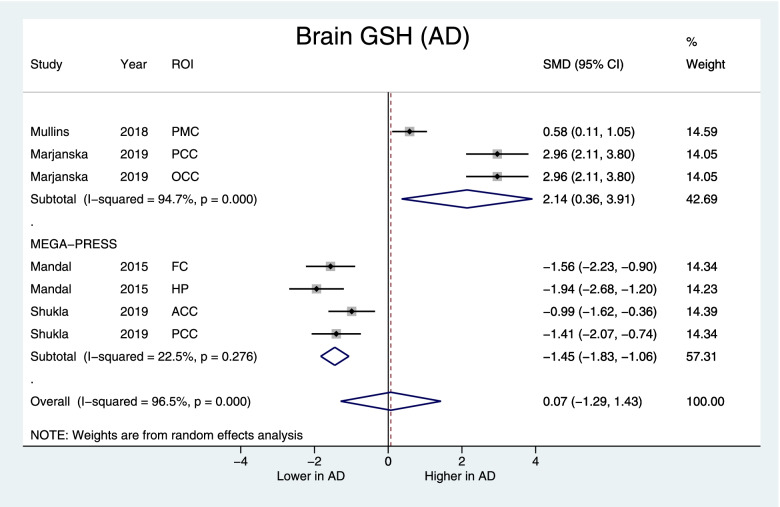
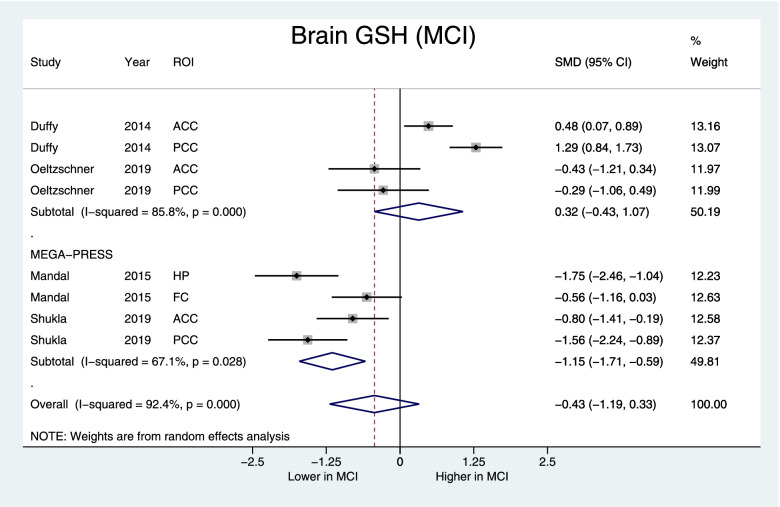
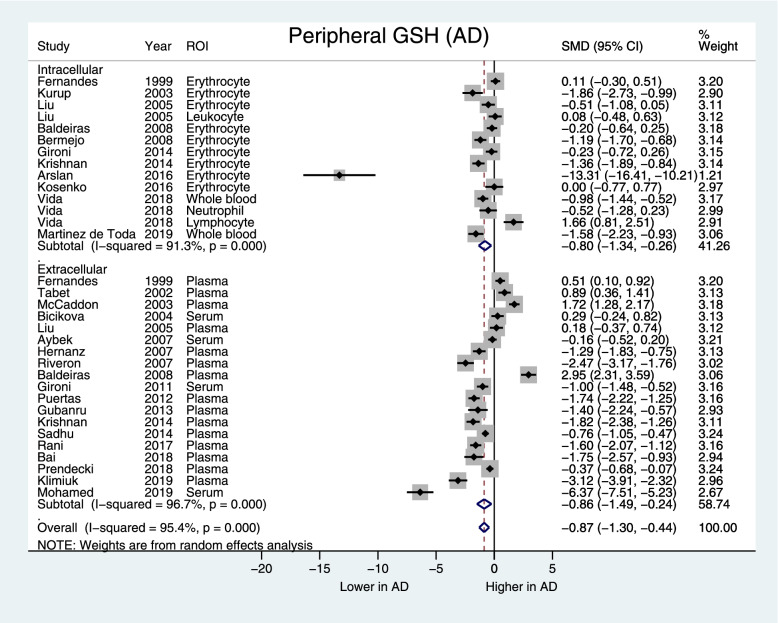
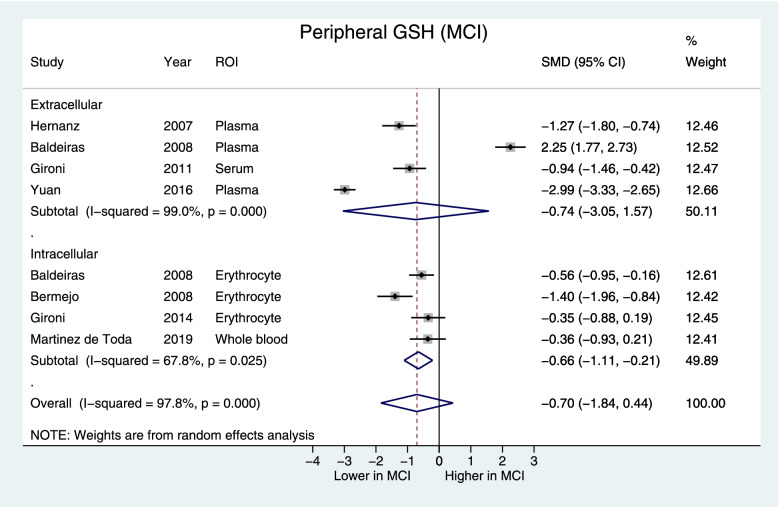
Results: For brain GSH, 4 AD (AD=135, HC=223) and 4 MCI (MCI=213, HC=211) studies were included. For blood GSH, 26 AD (AD=1203, HC=1135) and 7 MCI (MCI=434, HC=408) studies were included. Brain GSH overall did not differ in AD or MCI compared to HC; however, the subgroup of studies using MEGA-PRESS reported lower brain GSH in AD (SMD [95%CI] -1.45 [-1.83, -1.06], p<0.001) and MCI (-1.15 [-1.71, -0.59], z=4.0, p<0.001). AD had lower intracellular and extracellular blood GSH overall (-0.87 [-1. 30, -0.44], z=3.96, p<0.001). In a subgroup analysis, intracellular GSH was lower in MCI (-0.66 [-1.11, -0.21], p=0.025). Heterogeneity was observed throughout (I2 >85%) and not fully accounted by subgroup analysis. Egger's test indicated risk of publication bias.

Conclusion: Blood intracellular GSH decrease is seen in MCI, while both intra- and extracellular decreases were seen in AD. Brain GSH is decreased in AD and MCI in subgroup analysis. Potential bias and heterogeneity suggest the need for measurement standardization and additional studies to explore sources of heterogeneity.

Keywords: Alzheimer disease; Antioxidant; Biomarkers; Cognitive impairment; Glutathione; Meta-analysis; Oxidative stress.


Conflict of interest statement

The authors declare that they have no competing interests.

Figures

Fig. 1
Fig. 1
Search and selection of articles relevant to brain GSH in AD and MCI
Fig. 2
Fig. 2
Search and selection of articles relevant to blood GSH in AD and MCI
Fig. 3
Fig. 3
Forest plot displaying brain GSH concentrations in AD and control subjects, with the subgroup of studies using the MEGA-PRESS protocol at the bottom. Shown are the standardized mean differences (SMD) and 95% confidence intervals (95% CI). Negative values denote lower GSH in AD subjects while positive values denote higher in GSH in AD compared to controls. Pooled SMD [95% CI] = −0.07 [−1.29, 1.43], z=0.1, p=0.92, MEGA-PRESS subgroup: SMD [95% CI] = −1.45 [−1.83, −1.06], z=7.41, p<0.001. ROI indicates the region of interest: PMC posteromedial cortex, PCC posterior cingulate cortex, OCC occipital cortex, HP hippocampus, FC frontal cortex, ACC anterior cingulate cortex
Fig. 4
Fig. 4
Forest plot displaying brain GSH concentrations in MCI and control subjects, with the subgroup of studies using the MEGA-PRESS protocol at the bottom. Shown are the standardized mean differences (SMD) and 95% confidence intervals (95% CI). Negative values denote lower GSH in MCI subjects while positive values denote higher in GSH in MCI compared to controls. Pooled SMD [95% CI] = −0.43 [−1.19, 0.33], z=1.12, p=0.26, MEGA-PRESS subgroup: SMD [95% CI] = −1.15 [−1.71, −0.59], z=4.0, p<0.001. ROI indicates the region of interest: ACC anterior cingulate cortex, PCC posterior cingulate cortex, FC frontal cortex, HP hippocampus
Fig. 5
Fig. 5
Forest plot displaying blood GSH concentrations in AD and control subjects, by the intracellular and extracellular GSH subgroups. Shown are the standardized mean differences (SMD) and 95% confidence intervals (95% CI). Pooled SMD [95% CI] = −0.87 [−1.30, −0.44], z=3.96, p<0.001. Positive values denote higher in GSH in AD while negative values denote higher GSH in control subjects. ROI region of interest
Fig. 6
Fig. 6
Forest plot displaying blood GSH concentrations in MCI and control subjects by the intracellular and extracellular GSH subgroups. Shown are the standardized mean differences (SMD) and 95% confidence intervals (95% CI). Pooled SMD [95% CI] = −0.70 [−1.84, 0.44], z=1.12, p=0.23, the intracellular subgroup SMD [95% CI] = −0.66 [−1.11, −0.21], z=4.0, p=0.004. Positive values denote higher in GSH in MCI while negative values denote higher GSH in control subjects. ROI region of interest
Fig. 7
Fig. 7
Meta-regression demonstrating inverse correlation between the proportion of male study participants and the standardized mean difference (SMD) of blood GSH level between AD participants and healthy controls. The size of the circles is proportional to study weights

References

    1. Koyama A, O'Brien J, Weuve J, Blacker D, Metti AL, Yaffe K. The role of peripheral inflammatory markers in dementia and Alzheimer's disease: a meta-analysis. J Gerontol A Biol Sci Med Sci. 2013;68(4):433–440. - PMC - PubMed
    1. Kumar A, Singh A. Ekavali. A review on Alzheimer's disease pathophysiology and its management: an update. Pharmacol Rep. 2015;67(2):195–203. - PubMed
    1. Harrington KD, Lim YY, Ames D, Hassenstab J, Laws SM, Martins RN, et al. Amyloid beta-associated cognitive decline in the absence of clinical disease progression and systemic illness. Alzheimers Dement (Amst). 2017;8:156-64. - PMC - PubMed
    1. Schneider JA, Arvanitakis Z, Leurgans SE, Bennett DA. The neuropathology of probable Alzheimer disease and mild cognitive impairment. Ann Neurol. 2009;66(2):200–208. - PMC - PubMed
    1. Ward A, Tardiff S, Dye C, Arrighi HM. Rate of conversion from prodromal Alzheimer's disease to Alzheimer's dementia: a systematic review of the literature. Dement Geriatr Cogn Dis Extra. 2013;3(1):320–332. - PMC - PubMed

Publication types