

Estimating the effect of non-pharmaceutical interventions to mitigate COVID-19 spread in Saudi Arabia
- PMID: 35125108
- PMCID: PMC8818364
- DOI: 10.1186/s12916-022-02232-4
Estimating the effect of non-pharmaceutical interventions to mitigate COVID-19 spread in Saudi Arabia
Abstract
Background: The Kingdom of Saudi Arabia (KSA) quickly controlled the spread of SARS-CoV-2 by implementing several non-pharmaceutical interventions (NPIs), including suspension of international and national travel, local curfews, closing public spaces (i.e., schools and universities, malls and shops), and limiting religious gatherings. The KSA also mandated all citizens to respect physical distancing and to wear face masks. However, after relaxing some restrictions during June 2020, the KSA is now planning a strategy that could allow resuming in-person education and international travel. The aim of our study was to evaluate the effect of NPIs on the spread of the COVID-19 and test strategies to open schools and resume international travel.
Methods: We built a spatial-explicit individual-based model to represent the whole KSA population (IBM-KSA). The IBM-KSA was parameterized using country demographic, remote sensing, and epidemiological data. A social network was created to represent contact heterogeneity and interaction among age groups of the population. The IBM-KSA also simulated the movement of people across the country based on a gravity model. We used the IBM-KSA to evaluate the effect of different NPIs adopted by the KSA (physical distancing, mask-wearing, and contact tracing) and to forecast the impact of strategies to open schools and resume international travels.
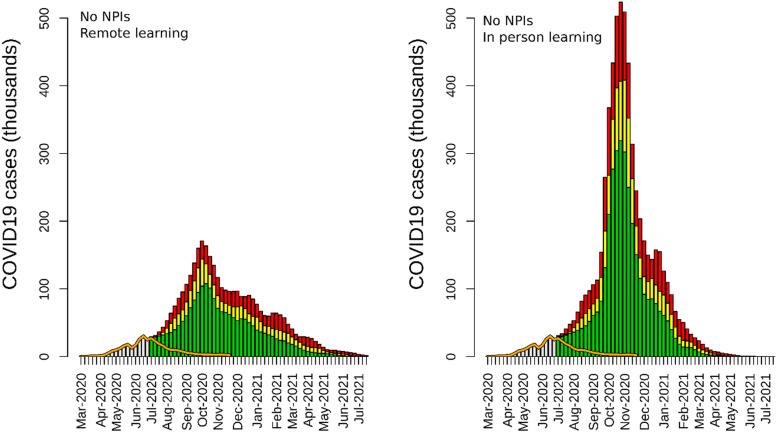
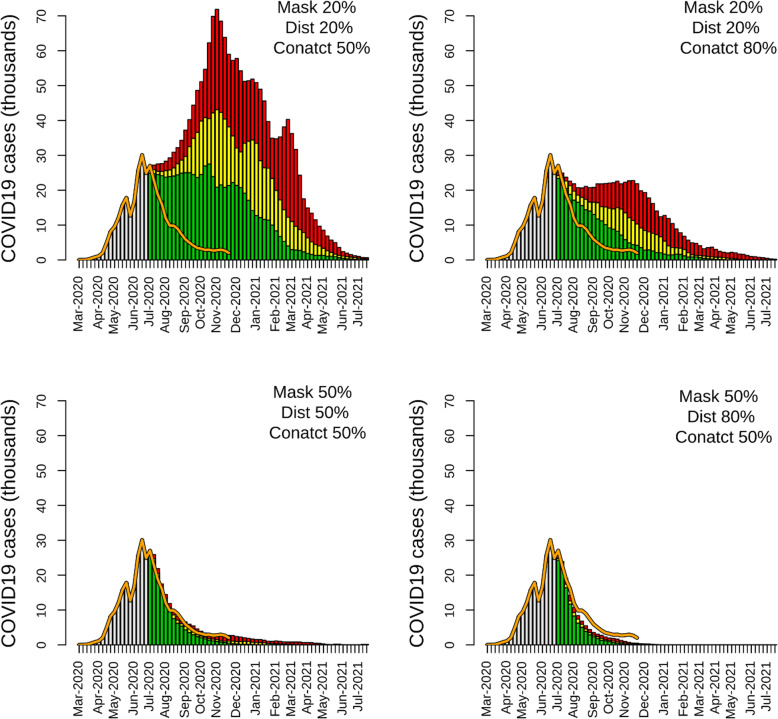
Results: The IBM-KSA results scenarios showed the high effectiveness of mask-wearing, physical distancing, and contact tracing in controlling the spread of the disease. Without NPIs, the KSA could have reported 4,824,065 (95% CI: 3,673,775-6,335,423) cases by June 2021. The IBM-KSA showed that mandatory mask-wearing and physical distancing saved 39,452 lives (95% CI: 26,641-44,494). In-person education without personal protection during teaching would have resulted in a high surge of COVID-19 cases. Compared to scenarios with no personal protection, enforcing mask-wearing and physical distancing in schools reduced cases, hospitalizations, and deaths by 25% and 50%, when adherence to these NPIs was set to 50% and 70%, respectively. The IBM-KSA also showed that a quarantine imposed on international travelers reduced the probability of outbreaks in the country.
Conclusions: This study showed that the interventions adopted by the KSA were able to control the spread of SARS-CoV-2 in the absence of a vaccine. In-person education should be resumed only if NPIs could be applied in schools and universities. International travel can be resumed but with strict quarantine rules. The KSA needs to keep strict NPIs in place until a high fraction of the population is vaccinated in order to reduce hospitalizations and deaths.
Keywords: COVID-19; Individual-based model; Non-pharmaceutical interventions; SARS-CoV-2; Saudi Arabia.
© 2022. The Author(s).
Conflict of interest statement
The authors declare that they have no competing interests.
Figures


References
-
- Johns Hopkins University Center for Systems Science and Engineering. COVID-19 Dashboard. 2021. https://coronavirus.jhu.edu/map.html. Accessed 21 Feb 2021.
Publication types
MeSH terms
Grants and funding
LinkOut - more resources
Full Text Sources
Medical
Miscellaneous
