. 2022 Jan 19:12:773925.
doi: 10.3389/fphar.2021.773925. eCollection 2021.

Multifactoriality of Parkinson's Disease as Explored Through Human Neural Stem Cells and Their Transplantation in Middle-Aged Parkinsonian Mice

Affiliations

Multifactoriality of Parkinson's Disease as Explored Through Human Neural Stem Cells and Their Transplantation in Middle-Aged Parkinsonian Mice

Anna Nelke et al. Front Pharmacol. .

Abstract

Parkinson's disease (PD) is an age-associated neurodegenerative disorder for which there is currently no cure. Cell replacement therapy is a potential treatment for PD; however, this therapy has more clinically beneficial outcomes in younger patients with less advanced PD. In this study, hVM1 clone 32 cells, a line of human neural stem cells, were characterized and subsequently transplanted in middle-aged Parkinsonian mice in order to examine cell replacement therapy as a treatment for PD. In vitro analyses revealed that these cells express standard dopamine-centered markers as well as others associated with mitochondrial and peroxisome function, as well as glucose and lipid metabolism. Four months after the transplantation of the hVM1 clone 32 cells, striatal expression of tyrosine hydroxylase was minimally reduced in all Parkinsonian mice but that of dopamine transporter was decreased to a greater extent in buffer compared to cell-treated mice. Behavioral tests showed marked differences between experimental groups, and cell transplant improved hyperactivity and gait alterations, while in the striatum, astroglial populations were increased in all groups due to age and a higher amount of microglia were found in Parkinsonian mice. In the motor cortex, nonphosphorylated neurofilament heavy was increased in all Parkinsonian mice. Overall, these findings demonstrate that hVM1 clone 32 cell transplant prevented motor and non-motor impairments and that PD is a complex disorder with many influencing factors, thus reinforcing the idea of novel targets for PD treatment that tend to be focused on dopamine and nigrostriatal damage.

Keywords: aging; behavior; cell replacement therapy; neural stem cell; neuroinflammation; next-generation sequencing; parkinson’s disease; proteomics.


Conflict of interest statement

The authors declare that the research was conducted in the absence of any commercial or financial relationships that could be construed as a potential conflict of interest.

Figures

FIGURE 1
FIGURE 1
Differential expression of genes by dividing and differentiated hVM1 clone 32 cells indicated upregulation of NSC-associated genes in proliferation and of DAn-associated genes when differentiated. (A) MA plot (left) and pie chart (right) showing genes differentially expressed by hVM1 clone 32 cells in proliferation (blue dots and slice) and differentiation (red dots and slice) conditions. Black dots and slice indicate genes that had a non-significant q value (0.05 < q < 1). (B) MA plots representing NSC- (left; green dots) and DAn-related (right; yellow dots) differential gene expression. Black dots indicate differentially expressed genes not associated with either NSCs or DAn. NSC-related genes were increased in proliferation, while those related with DAn were increased in differentiation. All MA plots show the mean of normalized counts on the x-axis and log2 fold changes on the y-axis. All significantly differentially expressed genes had q < 0.05. Proliferation n = 2, Differentiation n = 2. Data were obtained from two independent experiments.
FIGURE 2
FIGURE 2
Proteomic study revealed that proliferating and differentiated hVM1 clone 32 cells are influenced by a wide variety of proteins and pathways. (A) Volcano plot, with fold change on the x-axis and the q value on the y-axis, showing differentially expressed proteins in dividing (blue dots) and differentiated (red dots) hNSCs with q < 0.05. Black dots indicate proteins that had a non-significant q value. (B) Volcano plot, with fold change on the x-axis and the q value on the y-axis, demonstrating differentially expressed proteins in proliferating (blue dots) and differentiated (red dots) hNSCs with q < 0.01. Black dots indicate proteins that had q > 0.01. (C) Heat map illustrating the proteins with the biggest fold change increased in dividing (blue) and differentiated (red) hVM1 clone 32 cells. (D) Bar graph showing the top canonical pathways of proliferating and differentiated hNSCs, with bars indicating the z-score of each pathway. (E) One of the top networks relevant to hVM1 clone 32 cells. Image from QIAGEN Ingenuity Pathway Analysis. (F) List of top diseases and disorders (top), and list of top biological functions (bottom) of hVM1 clone 32 cells. (G) Bar graph illustrating the top upstream regulators of dividing (top) and differentiated (bottom) hNSCs, with bars indicating the q value. Blue and red bars indicate proteins that were activated in proliferating and differentiated cells, respectively. Black bars represent proteins that were top upstream regulators, but not activated. For panels (D–G), the q value was set to 0.01. Proliferation n = 5, Differentiation n = 5. All data were obtained from at least three independent experiments.
FIGURE 3
FIGURE 3
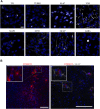
In vitro and in vivo images of hVM1 clone 32 cell markers. (A) After 7 days of differentiation in vitro, hVM1 clone 32 cells express a range of proteins including TH, TUBB3, Ki-67, VIM, MAP2, SYN1, GFAP, and GABA (all in white). Nuclei were stained with DAPI (blue). Scale bar = 20 μm. (B) Surviving transplanted hNSCs in the Str 4 months post-transplant as marked by STEM121 in red which stains human-specific cytoplasm (left), and astrocytes as marked by GFAP in grey near the transplanted cells (right). Nuclei were stained with DAPI (blue). Scale bars = 100 μm.
FIGURE 4
FIGURE 4
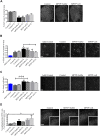
Diminution of striatal and nigral TH expression in Parkinsonian mice. (A) In the Str, all MPTP-lesioned mice tended to have around 25% less TH+ fiber density compared to controls. Control n = 5, MPTP + buffer n = 4, MPTP + cell n = 5. Kruskal-Wallis test followed by Dunn´s post-hoc test. (B) Nigral TH+ area decreased by 46% in buffer-treated mice (p < 0.05) and by 27% in hNSC-transplanted mice, compared to control animals. Control n = 5, MPTP + buffer n = 4, MPTP + cell n = 5. One-way ANOVA followed by Tukey´s post-hoc test. (A,B): * = p < 0.05, ** = p < 0.01. * = compared to same brain hemisphere of control. Data are expressed as mean ± standard error of the mean. Scale bars = 200 μm.
FIGURE 5
FIGURE 5
Behavioral improvement was observed in hNSC-transplanted mice. (A, left) Buffer-treated animals had a tendency to spend 71% more time in the center of the box compared to controls, while NSC-transplanted mice spent 85% less time in the center compared to those that received buffer (p < 0.05). Control n = 5, MPTP + buffer n = 4, MPTP + cell n = 5. One-way ANOVA followed by Tukey´s post-hoc test. (A, right) All experimental groups had the same distance traveled. Control n = 5, MPTP + buffer n = 4, MPTP + cell n = 5. Kruskal-Wallis test. (B) Forelimb and hindlimb stride lengths decreased by approximately 24% in buffer-treated animals compared to controls (p < 0.01), and hNSC transplant led to a 17% increase in all stride lengths measured compared to the vehicle group (p < 0.05). (C) Forelimb stride width was around 19% shorter in buffer-treated mice compared to control animals (p < 0.05) and NSC transplant tended to increase forelimb stride width by 13% compared to mice that received buffer, although only attaining significance (p < 0.05) on one side measured. CL-IL hindlimb stride width was unchanged among the three experimental groups and when compared to the control group, IL-CL hindlimb stride width was reduced in all MPTP-lesioned mice, although to a greater extent in buffer-treated (17%; p < 0.01) than cell-transplanted animals (10%; p < 0.05). (B,C): Control n = 7, MPTP + buffer n = 3, MPTP + cell n = 5. One-way ANOVA followed by Tukey’s post-hoc test. (A–C): *, # = p < 0.05, **, ## = p < 0.01, *** = p < 0.001, ns, not significant. * = compared to control, # = compared to MPTP + buffer. Data are expressed as mean ± standard error of the mean.
FIGURE 6
FIGURE 6
Evaluation of factors that potentially influenced hNSC transplant including DA transport, inflammation, and motor cortex alterations. (A) Compared to controls, DAT immunostaining decreased by approximately 57% in buffer-treated mice (p < 0.01) and non-significantly by around 32% in cell-transplanted animals, although DAT+ area tended to be increased by 36% in hNSC-treated mice compared to those that received buffer. Control n = 3, MPTP + buffer n = 4, MPTP + cell n = 4. (B) Striatal expression of GFAP tended to be higher in buffer-treated animals, reaching statistical significance on the IL side (p < 0.05), and was decreased on the CL side of hNSC-transplanted mice compared to the IL side of buffer-treated animals (p < 0.05). When compared to adult control mice, all middle-aged mice had increased GFAP expression in the Str (p < 0.05). Adult Control n = 3, Control n = 5, MPTP + buffer n = 4, MPTP + cell n = 3. One-way ANOVA followed by Tukey’s post-hoc test. *, # = p < 0.05, ** = p < 0.01, **** = p < 0.0001. * = compared to adult control, # = compared to same brain hemisphere of middle-aged control. Data are expressed as mean ± standard error of the mean. Scale bar = 50 μm. (C) Iba1+ microglial populations were increased in the Str of all Parkinsonian mice (p < 0.05), and age did not affect microglial density. Adult Control n = 5, Control n = 4, MPTP + buffer n = 5, MPTP + cell n = 5. One-way ANOVA followed by Tukey´s post-hoc test. * = p < 0.05, ** = p < 0.01. * = compared to same brain hemisphere of middle-aged control. Data are expressed as mean ± standard error of the mean. Scale bar = 50 μm. (D) In the motor cortex, nonphosphorylated NFH+ area tended to be increased in animals intoxicated with MPTP by 50–69% compared to control mice. Control n = 3, MPTP+buffer n = 3, MPTP + cell n = 3. (A,D): One-way ANOVA followed by Tukey’s post-hoc test. ** = p < 0.01, ns, not significant. * = compared to same brain hemisphere of control. Data are expressed as mean ± standard error of the mean. Scale bars = 200 μm.

Similar articles

Cited by

References

    1. Allen S. J., Watson J. J., Shoemark D. K., Barua N. U., Patel N. K. (2013). GDNF, NGF and BDNF as Therapeutic Options for Neurodegeneration. Pharmacol. Ther. 138, 155–175. 10.1016/j.pharmthera.2013.01.004 - DOI - PubMed
    1. Andersson E. R., Saltó C., Villaescusa J. C., Cajanek L., Yang S., Bryjova L., et al. (2013). Wnt5a Cooperates with Canonical Wnts to Generate Midbrain Dopaminergic Neurons In Vivo and in Stem Cells. Proc. Natl. Acad. Sci. U. S. A. 110, E602–E610. 10.1073/pnas.1208524110 - DOI - PMC - PubMed
    1. Ang S. L. (2006). Transcriptional Control of Midbrain Dopaminergic Neuron Development. Development 133, 3499–3506. 10.1242/dev.02501 - DOI - PubMed
    1. Apple D. M., Solano-Fonseca R., Kokovay E. (2017). Neurogenesis in the Aging Brain. Biochem. Pharmacol. 141, 77–85. 10.1016/j.bcp.2017.06.116 - DOI - PubMed
    1. Bezard E., Dovero S., Imbert C., Boraud T., Gross C. E. (2000). Spontaneous Long-Term Compensatory Dopaminergic Sprouting in MPTP-Treated Mice. Synapse 38, 363–368. 10.1002/1098-2396(20001201)38:3<363::AID-SYN16>3.0.CO;2-A - DOI - PubMed

LinkOut - more resources