. 2022 Jan 19:12:818227.
doi: 10.3389/fphar.2021.818227. eCollection 2021.

Deciphering the Effective Constituents and Mechanisms of Portulaca oleracea L. for Treating NASH via Integrating Bioinformatics Analysis and Experimental Pharmacology

Affiliations

Deciphering the Effective Constituents and Mechanisms of Portulaca oleracea L. for Treating NASH via Integrating Bioinformatics Analysis and Experimental Pharmacology

Xiaoli He et al. Front Pharmacol. .

Abstract

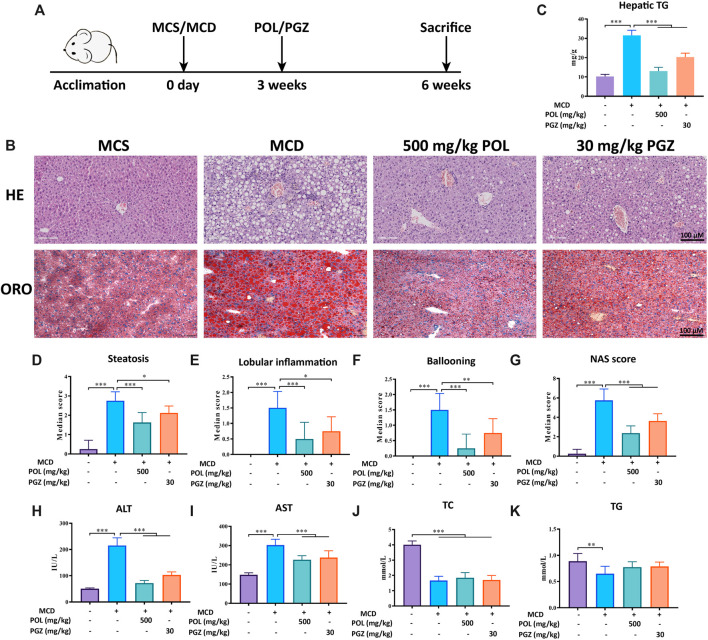
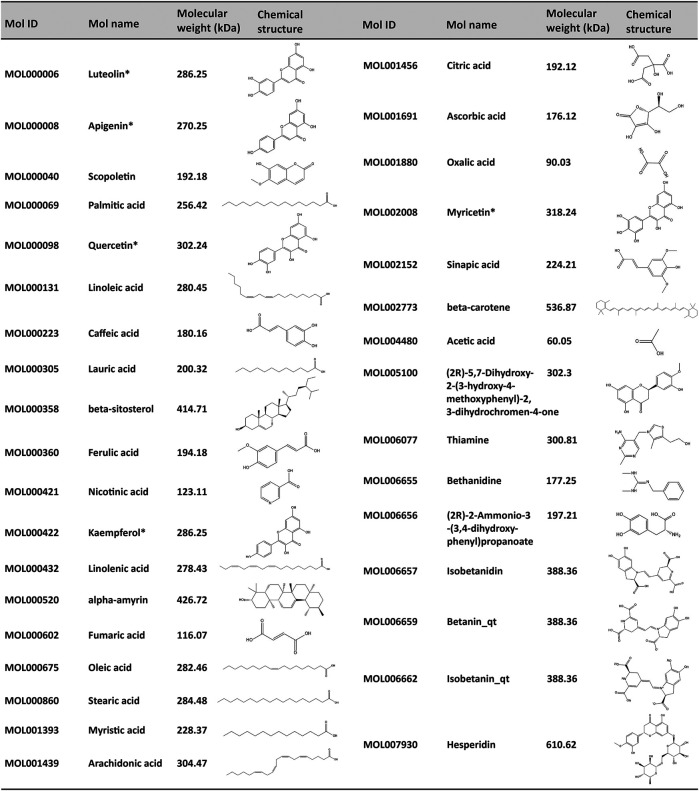
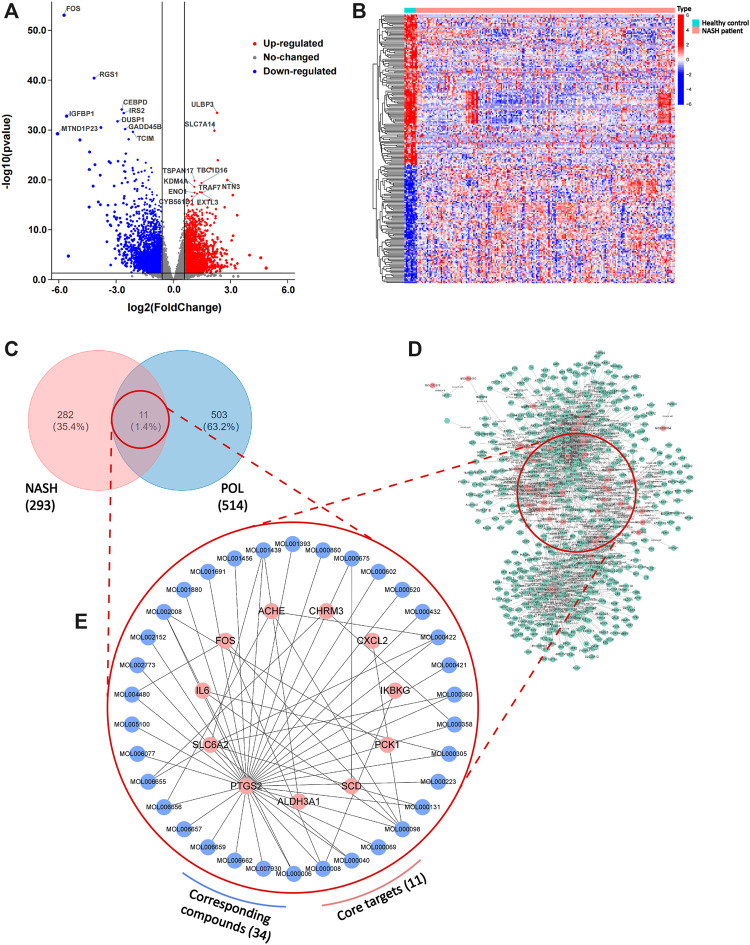
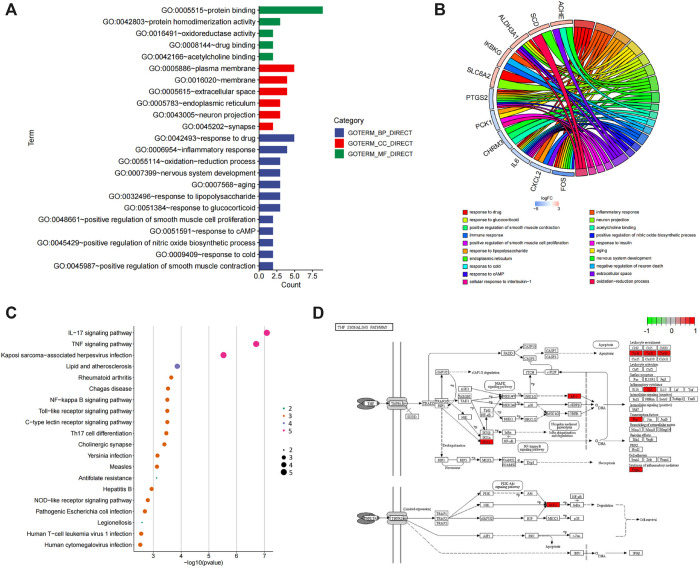
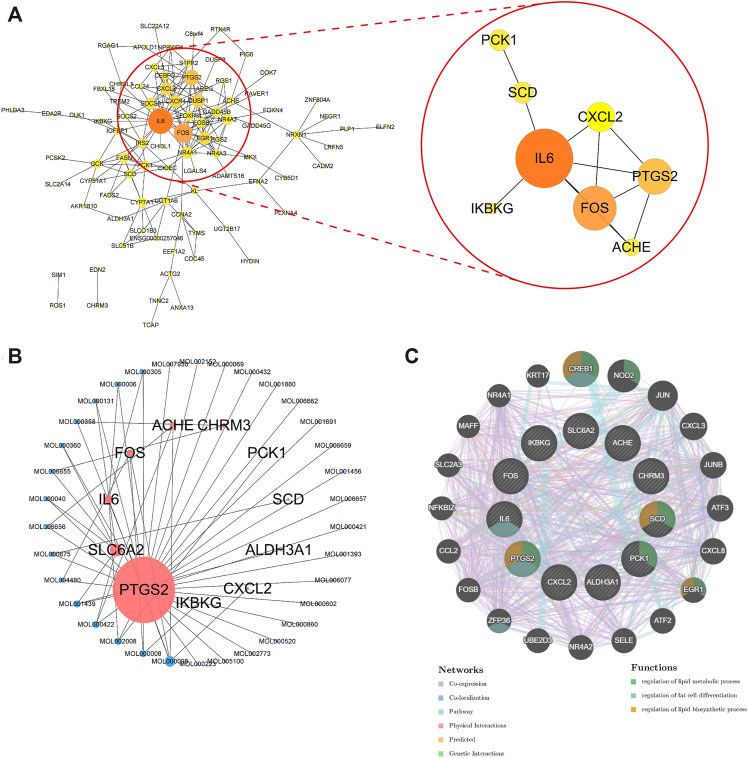
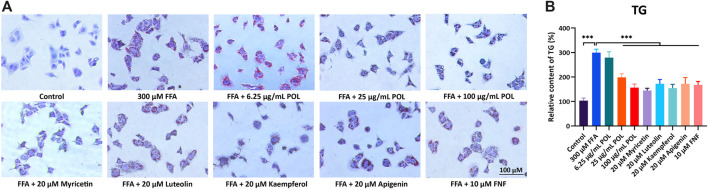
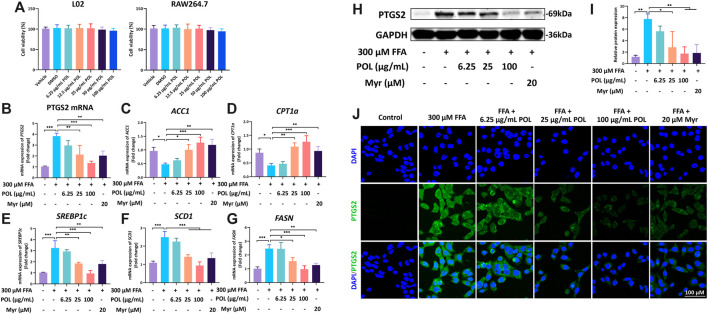
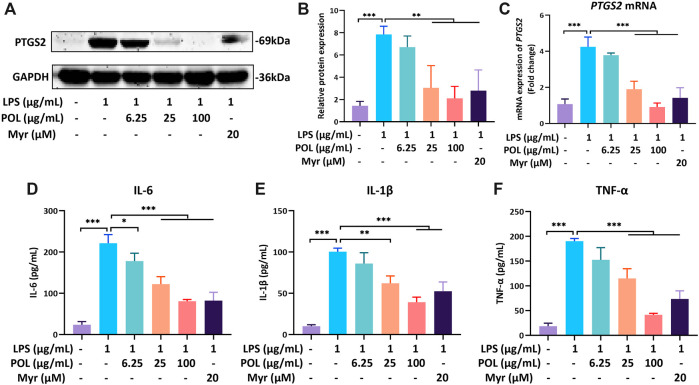
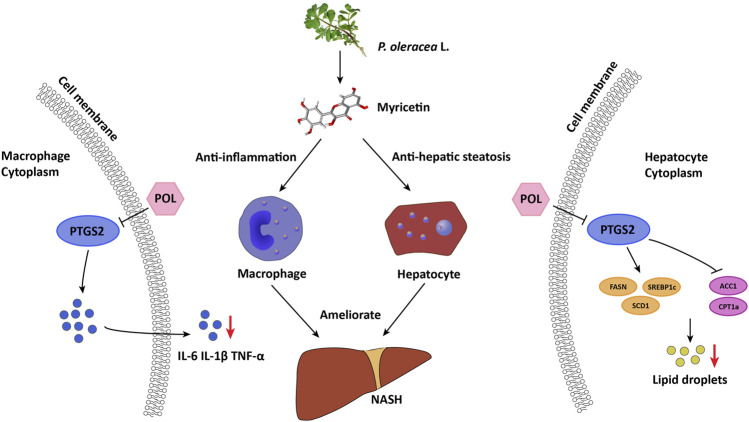
Nonalcoholic steatohepatitis (NASH) is a highly prevalent metabolic disorder. Currently, there are no effective pharmacotherapeutic options for preventing and treating NASH. Portulaca oleracea L. (POL) is an edible herb that has been used for preventing and treating some metabolic disorders in China, but the bioactive constituents in POL and the related mechanisms for treating NASH are still unclear. Here, a comprehensive research strategy was used to identify the core genes and the key constituents in POL for treating NASH, via integrating bioinformatics analysis and experimental pharmacology both in vitro and in vivo. The phenotypes and mechanisms of POL were carefully investigated by performing a set of in vivo and in vitro experiments. Bioinformatics analysis suggested that prostaglandin-endoperoxide synthase 2 (PTGS2) was the core target and myricetin (Myr) was the key constituent in POL for treating NASH. In NASH mice model induced by methionine choline deficiency diet, POL significantly alleviated hepatic steatosis and liver injury. In free fatty acids-induced hepatocytes, POL and Myr significantly down-regulated the expression of PTGS2, decreased the number of lipid droplets, and regulated the mRNA expression of lipid synthesis and homeostasis genes, including FASN, CPT1a, SERBP1c, ACC1, and SCD1. In lipopolysaccharide-induced macrophages, POL and Myr significantly reduced the expression of PTGS2 and blocked the secretion of inflammatory mediators TNF-α, IL-6, and IL-1β. Further investigations demonstrate that Myr acts as both suppressor and inhibitor of PTGS2. Collectively, POL and its major component Myr can ameliorate NASH via down-regulating and inhibiting PTGS2, suggesting that POL and Myr can be developed as novel medicines for treating NASH.

Keywords: Portulaca oleracea L.; hepatic steatosis; myricetin; non-alcoholic steatohepatitis; prostaglandin-endoperoxide synthase 2.


Conflict of interest statement

The authors declare that the research was conducted in the absence of any commercial or financial relationships that could be construed as a potential conflict of interest.

Figures

FIGURE 1
FIGURE 1
The effects of POL in the treatment of NASH in MCD diet-induced mouse model. Male C57BL/6 mice were fed with MCD diet for 6 weeks to establish a NASH model and treated with 500 mg/kg POL or 30 mg/kg PGZ for 3 weeks (A). HE and oil red O staining (ORO) were performed to observe the histopathological characteristics of liver tissue after the treatment of POL (B). Then, the NAS score (G), including hepatic steatosis (D), lobular inflammation (E), and ballooning degeneration (F), were calculated. The specific classification criteria were as follows: 1) hepatic steatosis (<5%, 0 points; 5–33%, 1 point; 33–66%, 2 points; >66%, 3 points); 2) lobular inflammation (none, 0 points; < 2 lesions/200× view, 1 point; 2–4 lesions/200× view, 2 points; > 4 lesions/200× view, 3 points); and 3) ballooning degeneration (none, 0 points; rare, 1 point; extensive, 2 points). The contents of hepatic TG (C), serum ALT (H), AST (I), TC (J), and TG (K) were detected. Comparing with model group, *p < 0.05, **p < 0.01, ***p < 0.001.
FIGURE 2
FIGURE 2
Corresponding compounds of N&P from POL in the treatment of NASH. Thirty four corresponding components of POL were closely related to the core genes (N&P) and obtained from TCMSP database. The Mol ID, Mol number, molecular weight, and structure of these compounds were listed. *Potential flavonoids from POL. “_qt” represented losing glucoside.
FIGURE 3
FIGURE 3
DEGs in patients with NASH and healthy people and the intersected genes of DEGs and predicted targets. The dataset (GSE135251) was downloaded from GEO Datasets. Then, DEGs were calculated by limma package and plotted by R. Volcano plot of DEGs (A) and heatmap plot of DEGs (B) were graphed and red dots represented up-regulated genes while blue represented down-regulated genes. Top ten up-regulated and down-regulated genes were labeled. Then, predicted targets of POL (D) were obtained from TCMSP database. The intersected genes (N&P) of DEGs and predicted targets (C) were graphed by Venn diagram. The network of corresponding compounds and core genes (N&P) (E) was graphed by Cytoscape. Blue circles represented constitutes of POL while red represented core genes (N&P).
FIGURE 4
FIGURE 4
GO and KEGG enrichment of N&P. The core intersected genes (N&P) were analyzed by GO enrichment (A,B). The green, red, and blue boxes represented biological process, cellular component, and molecular function, respectively. The top five results of GO enrichment were shown. Then, N&P were analyzed by KEGG enrichment (C). The top twenty signaling pathways were listed and the pink circles represented the top three signaling pathways. The TNF signaling pathway, one of the top two signaling pathways, was analyzed (D). The red boxes represented the core genes (N&P) in the TNF signaling pathway.
FIGURE 5
FIGURE 5
Protein-protein network analysis and topological analysis of N&P. Protein-protein network of core genes (A) was graphed by Cytoscape. The network of corresponding components from POL and core genes (N&P) (B) was graphed by Cytoscape. Pink node represented the core genes while blue represented the corresponding components. Node size is proportional to its degree. The larger the area is, the more important it is in the network. Topological network of N&P (C) was graphed by GeneMANIA. The different color lines represented the network relationships while the different color circles represented the gene functions.
FIGURE 6
FIGURE 6
Chemical analysis of POL by UHPLC-Q-Orbitrap HRMS. The typical fngerprint chromatograms of the extract of POL (A) and reference standards (B). (1) Myricetin. (2) Quercetin. (3) Luteolin. (4) Kaempferol. (5) Apigenin.
FIGURE 7
FIGURE 7
The comparison of anti-lipid accumulation in different concentration of POL and four flavonoids from POL. L02 cells were incubated with 300 μM FFA (oleic acid: palmitic acid = 2: 1) and treated with different concentrations of POL and 20 μM myricetin, luteolin, kaempferol, and apigenin for 24 h, respectively. Lipid accumulation and content of TG were evaluated by oil red O staining (A) and enzymatic colorimetric assay (B). Comparing with model group, ***p < 0.001.
FIGURE 8
FIGURE 8
The effects of POL and Myr on the protein and mRNA expression of PTGS2 and the mRNA expression of CPT1a, FASN, SCD1, ACC1, and SREBP1c in FFA-induced L02. L02 cells were incubated with 300 μM FFA (oleic acid: palmitic acid = 2: 1) and treated with 6.25, 25, and 100 μg/ml POL and 20 μM Myr for 24 h, respectively. (A) Cell viabilities of L02 and RAW264.7 treated with 6.25, 25, and 100 μg/ml POL. The mRNA expression of PTGS2 (B), ACC1 (C), CPT1a (D), SREBP1c (E), SCD1 (F), and FASN (G) were determined by qt-PCR. Then, the protein expression of PTGS2 was detected by western blot (H) and immunoflurescence staining (I) and. The relative protein expression of PTGS2 was calculated (J). Comparing with model group, *p < 0.05, **p < 0.01, ***p < 0.001.
FIGURE 9
FIGURE 9
The effects of POL and Myr on protein and mRNA expression of PTGS2 and the secretion of IL-6, IL-1β, and TNF-α in LPS-induced RAW264.7. RAW264.7 was incubated with 1 μg/ml LPS and treated with 6.25, 25, and 100 μg/ml POL and 20 μM Myr for 18 h. Then, the protein expression (A) and mRNA expression of PTGS2 (C) were detected and the relative protein expression was calculated (B). The cells were pretreated with 6.25, 25, and 100 μg/ml POL and 20 μM Myr for 1 h and exposed to 1 μg/ml LPS for 18 h. Then, the levels of IL-6 (D), IL-1β (E), and TNF-α (F) in culture supernatant were determined by ELISA. Comparing with model group, * P < 0.05, ** P < 0.01, ***p < 0.001.
FIGURE 10
FIGURE 10
Proposed mechanism of POL and its main active component myricetin in treating NASH through inhibiting PTGS2. In macrophages, POL and myricetin could decrease the secretion of inflammatory mediators such as IL-6, IL-1β, and TNF-α through down-regulating PTGS2. In hepatocytes, POL and myricetin could regulate lipid synthesis and homostasis by down-regulating FASN, SREBP1c, and SCD1 and up-regulating ACC1 and CPT1a through inhibiting PTGS2. Thus, POL could reduce lipid accumulation of hepatocyte and inhibit hepatic inflammation to treat NASH.

References

    1. Baradaran Rahimi V., Rakhshandeh H., Raucci F., Buono B., Shirazinia R., Samzadeh Kermani A., et al. (2019). Anti-inflammatory and Anti-oxidant Activity of Portulaca Oleracea Extract on LPS-Induced Rat Lung Injury. Molecules 24 (1), 139. 10.3390/molecules24010139 - DOI - PMC - PubMed
    1. Buzzetti E., Pinzani M., Tsochatzis E. A. (2016). The Multiple-Hit Pathogenesis of Non-alcoholic Fatty Liver Disease (NAFLD). Metabolism 65 (8), 1038–1048. 10.1016/j.metabol.2015.12.012 - DOI - PubMed
    1. Chang C. J., Tzeng T. F., Liou S. S., Chang Y. S., Liu I. M. (2012). Myricetin Increases Hepatic Peroxisome Proliferator-Activated Receptor α Protein Expression and Decreases Plasma Lipids and Adiposity in Rats. Evid. Based Complement. Alternat. Med. 2012, 787152. 10.1155/2012/787152 - DOI - PMC - PubMed
    1. Chen Y., Chen H. N., Wang K., Zhang L., Huang Z., Liu J., et al. (2019). Ketoconazole Exacerbates Mitophagy to Induce Apoptosis by Downregulating Cyclooxygenase-2 in Hepatocellular Carcinoma. J. Hepatol. 70 (1), 66–77. 10.1016/j.jhep.2018.09.022 - DOI - PubMed
    1. Clemente S. M., Martínez-Costa O. H., Monsalve M., Samhan-Arias A. K. (2020). Targeting Lipid Peroxidation for Cancer Treatment. Molecules 25 (21), 5144. 10.3390/molecules25215144 - DOI - PMC - PubMed