. 2022 Feb;16(1):91-100.
doi: 10.1007/s11571-021-09699-6. Epub 2021 Jul 19.

Functional neuronal networks reveal emotional processing differences in children with ADHD

Affiliations

Functional neuronal networks reveal emotional processing differences in children with ADHD

Sheida Ansari Nasab et al. Cogn Neurodyn. 2022 Feb.

Abstract

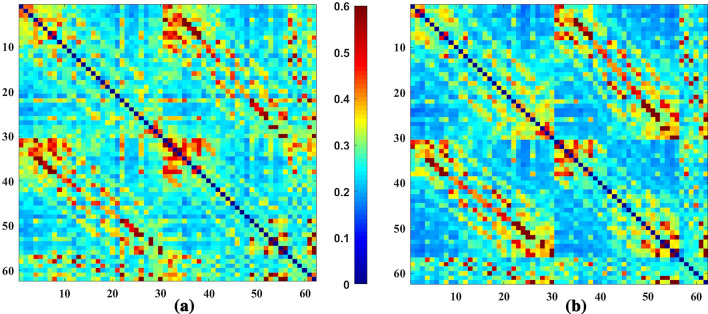
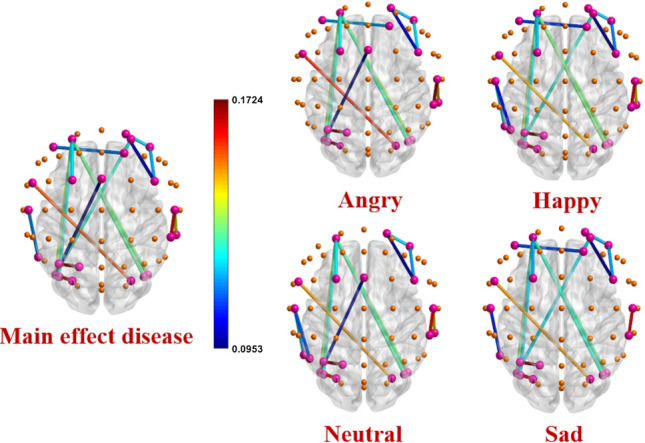
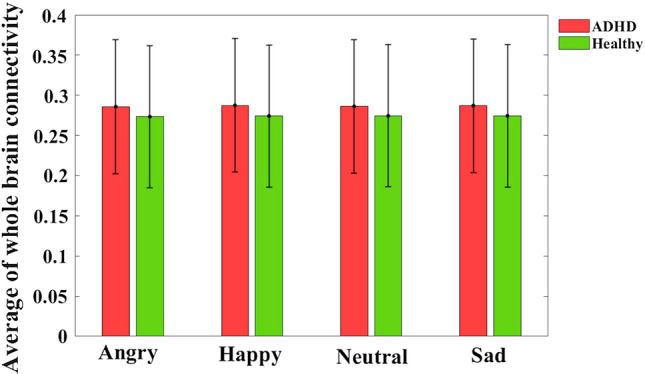
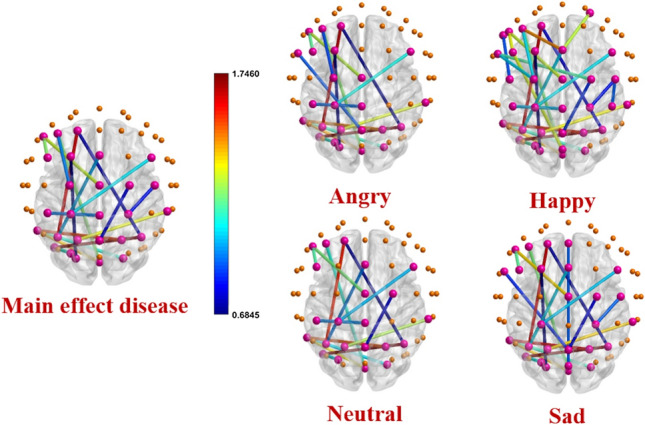
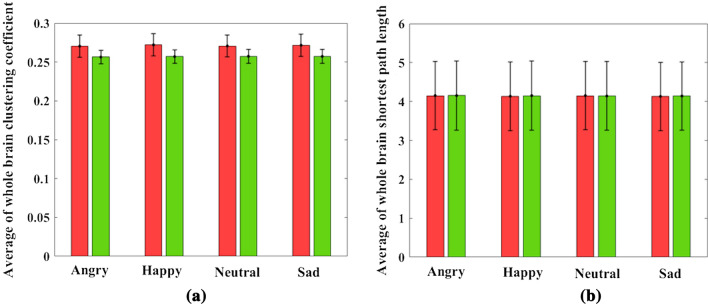
Attention Deficit Hyperactivity Disorder (ADHD) is a common neurodevelopmental disorder that, in addition to inattention, excessive activity, or impulsivity, makes it difficult for children to process facial emotions and thus to interact with their peers. Here we analyze neuronal networks of children with this disorder by means of the phase-locking value (PLV) method. In particular, we determine the level of phase synchronization between 62 EEG channels of 22 healthy boys and 22 boys with ADHD, recorder whilst observing facial emotions of anger, happiness, neutrality, and sadness. We construct neuronal networks based on the gamma sub-band, which according to previous studies, shows the highest response to emotional stimuli. We find that the functional connectivity of the frontal and occipital lobes in the ADHD group is significantly (P-value < 0.01) higher than in the healthy group. More functional connectivity in these lobes shows more phase synchronization between the neurons of these brain regions, representing some problems in the brain emotional processing center in the ADHD group. The shortest path lengths in these lobes are also significantly (P-value < 0.01) higher in the ADHD group than in the healthy group. This result indicates less efficiency of information transmission and segregation in occipital and frontal lobes of ADHD neuronal networks, responsible for visual and emotional processing in the brain, respectively. We hope that our approach will help obtain further insights into ADHD with methods of network science.

Keywords: ADHD; EEG; Facial emotions; Functional connectivity; Phase locking value.


Conflict of interest statement

Conflict of interestThe authors declare that they have no conflict of interest.

Figures

Fig. 1
Fig. 1
Average PLV matrices in the gamma band of Happy emotion in a ADHD and b Healthy groups. The figures are 62 ×62 matrices which dimensions show the number of electrode channels for recording EEG signals. According to the color bar, the color of each matrix element expresses the level of phase synchronization between the relevant pairs of electrodes. In these matrices, regions with warm colors show high values of PLV and, as a result, high phase synchronization between channel pairs. Cold color areas indicate low PLV values and low phase synchronization. Comparison of figures (a) and (b) shows more mean phase synchronization in the ADHD group than in the healthy one in some channel pairs
Fig. 2
Fig. 2
Channel pairs with significant connectivity differences in main effect disease and interaction effect ”disease×emotion” for all types of emotions. The spheres represent 62 electrode channels in different brain areas. The pink spheres show electrode channels with significant connections in functional connectivity between the two ADHD and healthy groups. The other spheres show the electrode channels that do not have significant connections. The colored lines represent the significant edges between the pairs of electrode channels. The corresponding colors express the level of PLV differences between two healthy and ADHD groups. Edges with warm colors show connections with high connectivity differences between two ADHD and healthy groups. Cold color edges indicate low connectivity differences between the two groups. Details of common edges in all four emotional types are presented in Table 1. All these connections (except CP6-C6 and P3-P1) are significantly (P-value) stronger in the ADHD group than in the healthy one representing more phase synchronization of the related channel pairs in ADHD neuronal networks < 0.01
Fig. 3
Fig. 3
Average of whole brain connectivity in all types of emotions. In each bar graph, the center of the drawn error bar is the average of the functional connectivity. The lines drawn with the same length above and below the center of the error bar show the standard deviation related to each group in different types of emotions. Details of the bar graphs are presented in Table 2. No significant differences are found in all emotional types between two ADHD and healthy groups (P-value > 0.01)
Fig. 4
Fig. 4
Channel pairs with significant differences in shortest path length in main effect disease and interaction effect ”disease×emotion” for all emotions. The spheres represent 62 electrode channels in different brain regions. The pink spheres show electrode channels with significant connections in the shortest path length between the two ADHD and healthy groups. The other spheres show the electrode channels that do not have significant connections. The colored lines represent the significant edges between the pairs of electrode channels. The corresponding colors express the level of shortest path length differences between two healthy and ADHD groups. Edges with warm colors show high shortest path length differences between two ADHD and healthy groups. Cold color edges represent connections with low differences. Details of the common significant connections are presented in Table 3. The shortest path length of all these connections (except CZ-F5, F5-FC3, and PO3-PO7) is higher in the ADHD group than the healthy one indicating less segregation of information in the related channel pairs in ADHD neuronal networks
Fig. 5
Fig. 5
Average of whole-brain a clustering coefficient and b shortest path length in all types of emotions. In each bar graph, the center of the drawn error bar is the average of the clustering coefficient/shortest path length. The lines drawn with the same length above and below the center of the error bar show the standard deviation related to each group in different types of emotions. Details of the bar graphs are presented in Table 2. No significant differences are found in all types of emotions between two ADHD and healthy groups (P-value >0.01)

References

    1. Ahmadlou M, Adeli H. Wavelet-synchronization methodology: A new approach for eeg-based diagnosis of adhd. ClinEEG Neurosci. 2010;41:1–10. - PubMed
    1. Ahmadlou M, Adeli H. Fuzzy synchronization likelihood with application to attention-deficit/hyperactivity disorder. Clin EEG Neurosci. 2011;42:6–13. doi: 10.1177/155005941104200105. - DOI - PubMed
    1. An L, Cao QJ, Sui MQ, Sun L, Zou QH, Zang YF, Wang YF. Local synchronization and amplitude of the fluctuation of spontaneous brain activity in attention-deficit/hyperactivity disorder: a resting-state fmri study. Neurosci Bull. 2013;29:603–613. doi: 10.1007/s12264-013-1353-8. - DOI - PMC - PubMed
    1. Balconi M, Pozzoli U. Arousal effect on emotional face comprehension: Frequency band changes in different time intervals. Physiol Behav. 2009;97:455–462. doi: 10.1016/j.physbeh.2009.03.023. - DOI - PubMed
    1. Barttfeld P, Petroni A, Báez S, Urquina H, Sigman M, Cetkovich M, Torralva T, Torrente F, Lischinsky A, Castellanos X, et al. Functional connectivity and temporal variability of brain connections in adults with attention deficit/hyperactivity disorder and bipolar disorder. Neuropsychobiol. 2014;69:65–75. doi: 10.1159/000356964. - DOI - PubMed

LinkOut - more resources