Dysfunctional Network and Mutation Genes of Hypertrophic Cardiomyopathy
- PMID: 35126952
- PMCID: PMC8816546
- DOI: 10.1155/2022/8680178
Dysfunctional Network and Mutation Genes of Hypertrophic Cardiomyopathy
Abstract
Background: Hypertrophic cardiomyopathy (HCM) is a group of heterogeneous diseases that affects the myocardium. It is also a common familial disease. The symptoms are not common and easy to find.
Objective: In this paper, we aim to explore and analyze the dysfunctional gene network related to hypertrophic cardiomyopathy, and the key target genes with diagnostic and therapeutic significance for HCM were screened.
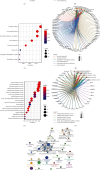
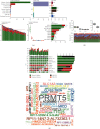
Methods: The gene expression profiles of 37 samples (GSE130036) were downloaded from the GEO database. Differential analysis was used to identify the related dysregulated genes in patients with HCM. Enrichment analysis identified the biological function and signaling pathway of these differentially expressed genes. Then, PPI network was built and verified in the GSE36961 dataset. Finally, the gene of single-nucleotide variants (SNVs) in HCM samples was screened by means of maftools.
Results: In this study, 920 differentially expressed genes were obtained, and these genes were mainly related to metabolism-related signaling pathways. 187 interacting genes were identified by PPI network analysis, and the expression trends of C1QB, F13A1, CD163, FCN3, PLA2G2A, and CHRDL2 were verified by another dataset and quantitative real-time polymerase chain reaction. ROC curve analysis showed that they had certain clinical diagnostic ability, and they were the potential key dysfunctional genes of HCM. In addition, we found that PRMT5 mutation was the most frequent in HCM samples, which may affect the pathogenesis of HCM.
Conclusion: Therefore, the key genes and enrichment results identified by our analysis may provide a reference for the occurrence and development mechanism of HCM. In addition, mutations in PRMT5 may be a useful therapeutic and diagnostic target for HCM. Our results also provide an independent quantitative assessment of functional limitations in patients with unknown history.
Copyright © 2022 Yunwen Cui et al.
Conflict of interest statement
The authors declare that there are no conflicts of interest.
Figures


Similar articles
-
Identification of Potential Diagnostic Biomarkers and Biological Pathways in Hypertrophic Cardiomyopathy Based on Bioinformatics Analysis.Genes (Basel). 2022 Mar 17;13(3):530. doi: 10.3390/genes13030530. Genes (Basel). 2022. PMID: 35328083 Free PMC article.
-
Identification and verification of promising diagnostic biomarkers in patients with hypertrophic cardiomyopathy associate with immune cell infiltration characteristics.Life Sci. 2021 Nov 15;285:119956. doi: 10.1016/j.lfs.2021.119956. Epub 2021 Sep 11. Life Sci. 2021. PMID: 34520765
-
Osteomodulin is a Potential Genetic Target for Hypertrophic Cardiomyopathy.Biochem Genet. 2021 Oct;59(5):1185-1202. doi: 10.1007/s10528-021-10050-1. Epub 2021 Mar 14. Biochem Genet. 2021. PMID: 33715137
-
MicroRNAs as Biomarkers in Hypertrophic Cardiomyopathy: Current State of the Art.Curr Med Chem. 2021;28(36):7400-7412. doi: 10.2174/0929867328666210405122703. Curr Med Chem. 2021. PMID: 33820510 Review.
-
Genetics of hypertrophic cardiomyopathy after 20 years: clinical perspectives.J Am Coll Cardiol. 2012 Aug 21;60(8):705-15. doi: 10.1016/j.jacc.2012.02.068. Epub 2012 Jul 11. J Am Coll Cardiol. 2012. PMID: 22796258 Review.
Cited by
-
Transcriptomics data integration and analysis to uncover hallmark genes in hypertrophic cardiomyopathy.Am J Transl Res. 2024 Feb 15;16(2):637-653. doi: 10.62347/AXOY3338. eCollection 2024. Am J Transl Res. 2024. PMID: 38463581 Free PMC article.
-
Integration analysis using bioinformatics and experimental validation on cellular signalling for sex differences of hypertrophic cardiomyopathy.J Cell Mol Med. 2024 Nov;28(21):e70147. doi: 10.1111/jcmm.70147. J Cell Mol Med. 2024. PMID: 39535387 Free PMC article.
-
A personalized mRNA signature for predicting hypertrophic cardiomyopathy applying machine learning methods.Sci Rep. 2024 Jul 24;14(1):17023. doi: 10.1038/s41598-024-67201-8. Sci Rep. 2024. PMID: 39043774 Free PMC article.
-
Identification of Potential Diagnostic Biomarkers and Biological Pathways in Hypertrophic Cardiomyopathy Based on Bioinformatics Analysis.Genes (Basel). 2022 Mar 17;13(3):530. doi: 10.3390/genes13030530. Genes (Basel). 2022. PMID: 35328083 Free PMC article.
-
Alternative Splicing Analysis Reveals Adrenergic Signaling as a Novel Target for Protein Arginine Methyltransferase 5 (PRMT5) in the Heart.Int J Mol Sci. 2025 Mar 5;26(5):2301. doi: 10.3390/ijms26052301. Int J Mol Sci. 2025. PMID: 40076920 Free PMC article.
References
Publication types
MeSH terms
Substances
LinkOut - more resources
Full Text Sources
Research Materials
Miscellaneous

