. 2021 Nov 25;13(2):386-395.
doi: 10.1039/d1sc04832e. eCollection 2022 Jan 5.

Fine-tuning the spike: role of the nature and topology of the glycan shield in the structure and dynamics of the SARS-CoV-2 S

Affiliations

Fine-tuning the spike: role of the nature and topology of the glycan shield in the structure and dynamics of the SARS-CoV-2 S

Aoife M Harbison et al. Chem Sci. .

Abstract

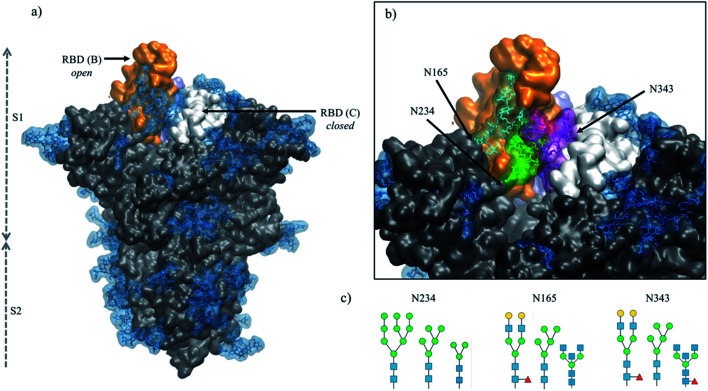
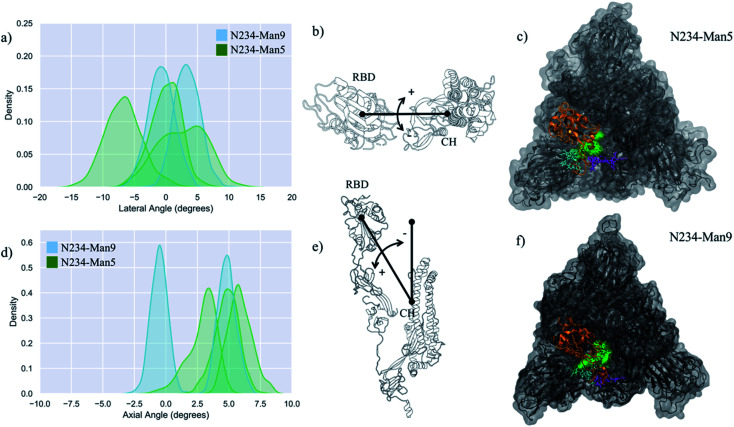
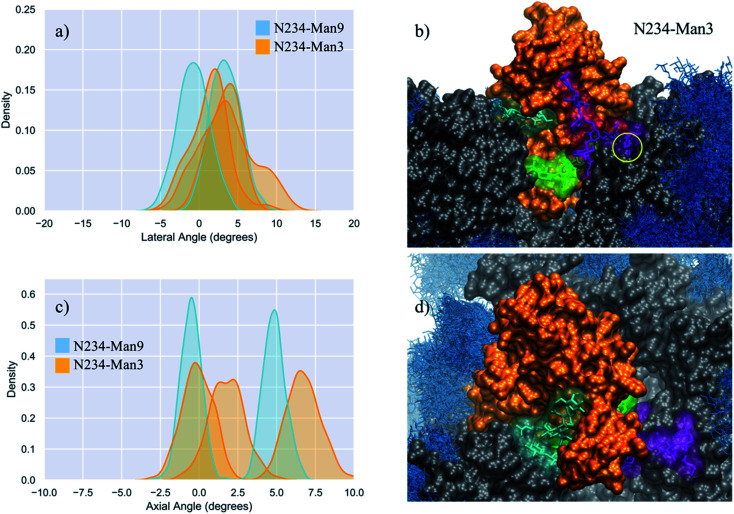
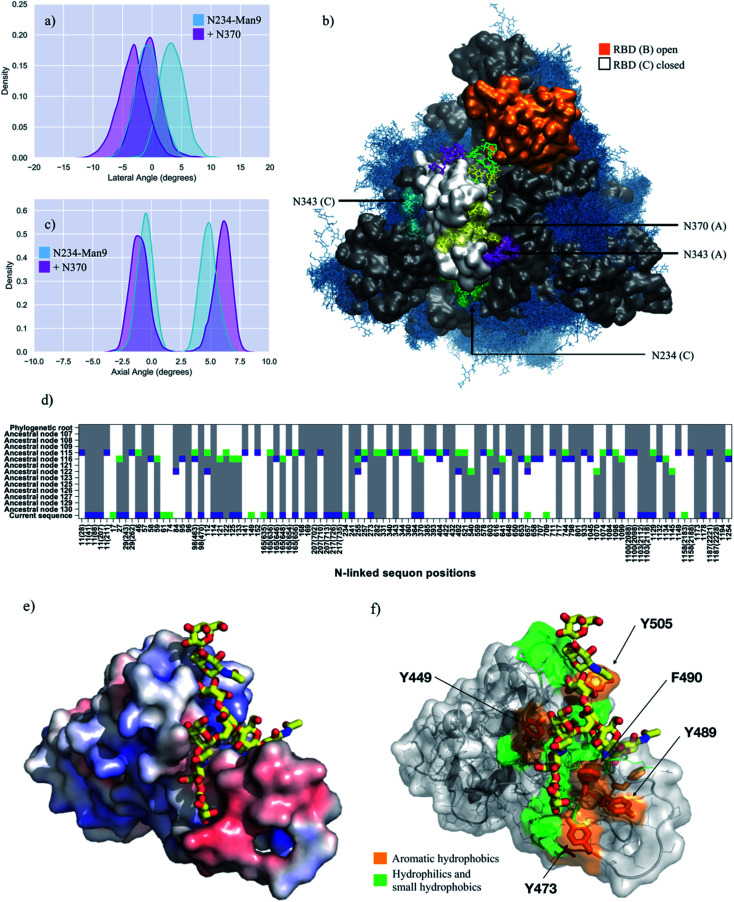
The dense glycan shield is an essential feature of the SARS-CoV-2 spike (S) architecture, key to immune evasion and to the activation of the prefusion conformation. Recent studies indicate that the occupancy and structures of the SARS-CoV-2 S glycans depend not only on the nature of the host cell, but also on the structural stability of the trimer; a point that raises important questions about the relative competence of different glycoforms. Moreover, the functional role of the glycan shield in the SARS-CoV-2 pathogenesis suggests that the evolution of the sites of glycosylation is potentially intertwined with the evolution of the protein sequence to affect optimal activity. Our results from multi-microsecond molecular dynamics simulations indicate that the type of glycosylation at N234, N165 and N343 greatly affects the stability of the receptor binding domain (RBD) open conformation, and thus its exposure and accessibility. Furthermore, our results suggest that the loss of glycosylation at N370, a newly acquired modification in the SARS-CoV-2 S glycan shield's topology, may have contributed to increase the SARS-CoV-2 infectivity as we find that N-glycosylation at N370 stabilizes the closed RBD conformation by binding a specific cleft on the RBD surface. We discuss how the absence of the N370 glycan in the SARS-CoV-2 S frees the RBD glycan binding cleft, which becomes available to bind cell-surface glycans, and potentially increases host cell surface localization.


Conflict of interest statement

There are no conflicts to declare.

Figures

Fig. 1
Fig. 1. (panel a) Structure of the fully glycosylated SARS-CoV-2 S (PDBid 6VYB) ectodomain. The protein is shown in grey with the RBDs of chain B and C highlighted in orange and white, respectively; the glycan shield is highlighted in blue. (panel b) Close up on the open pockets with the N-glycans at the strategic positions N234, N165, and N343 highlighted in green, cyan and purple, respectively. (panel c) N-glycans considered in the different models studied in this work, represented through the SNFG and drawn with DrawGlycan (http://www.virtualglycome.org/DrawGlycan/). Molecular rendering done with VMD.
Fig. 2
Fig. 2. (panels a and d) Kernel density estimation (KDE) analysis of the lateral and axial angles distributions calculated through the uncorrelated MD trajectories obtained for N234-Man5 (green), replicas R1–3, and for N234-Man9 (cyan), replicas R1, 2 for comparison. (panels b and e) Graphical representation of the lateral (b) and axial (e) angles. Displacements relative to the initial trajectory frame are measured in terms of positive and negative values. The centre of mass of the RBD and of the central helices (CH) are used as reference points. (panels e and f) Top view on an equilibrated snapshot of the N234-Man5 (R3) S and N234-Man9 (R2) S, respectively. Man5/9 at N234 are shown in green, while the N-glycans at N165 and N343 are shown in cyan and purple, respectively. All other glycans are not represented for clarity. The RBD of chain B is shown in orange, while the rest of the protein is in grey. Data analysis and graphs were done with seaborn (www.seaborn.pydata.org) and molecular rendering with PyMol (www.pymol.org) and VMD.
Fig. 3
Fig. 3. (panels a and c) Kernel density estimation (KDE) analysis of the lateral and axial angle distributions calculated through the uncorrelated MD trajectories obtained for N234-Man3 (orange), replicas R1–3, and for N234-Man9 (cyan), replicas R1, 2 for comparison. (panels b and d) Close-ups on a representative snapshot of the N234-Man3 (R3) simulation from the side and top, respectively. Man3 at N234 is shown in green, while the N-glycans at N165 and N343 are shown in cyan and purple, respectively. The solvent accessible surface of the open RBD is shown in orange, while the rest of the protein is shown in grey. All other glycans are shown in blue, as an overlay of snapshots collected every 10 frames. The position of the core fucose in the FA2G2 N-glycans at N343 is highlighted within a yellow circle. Data analysis and graphs were done with seaborn (www.seaborn.pydata.org) and molecular rendering with VMD.
Fig. 4
Fig. 4. (panels a and c) Kernel density estimation (KDE) analysis of the lateral and axial angle distributions calculated through the uncorrelated MD trajectories obtained for N370-glycosylated N234-Man9 (purple), replicas R1, 2, and for N234-Man9 (cyan), replicas R1, 2 for comparison. (panel b) Close-ups on a representative snapshot of the N370-glycosylated N234-Man3 (R2) simulation from top. Man9 at N234 (B, C) is shown in green, while the complex N-glycans at N165 (B, C), N343 (C, A) and N370 (C, A) are shown in cyan, purple and yellow, respectively. The surface of the open RBD (B) is shown in orange and of the closed RBD (C) is shown in white; the rest of the protein is shown in grey. All other glycans are shown in blue, as an overlay of snapshots collected every 10 frames. Data analysis and graphs were done with seaborn (www.seaborn.pydata.org) and molecular rendering with VMD28. (panel d) Gain, loss, and retention of N-glycosylation sequons through the evolution of SARS-CoV-2 S as inferred from ancestral sequence reconstruction based on selected coronavirus spike proteins. The predicted ancestral sequence is at the top and the current SARS-CoV-2 S sequence at the base. Colours show gain (green), retention (grey), or loss (blue) of a sequon at a specific amino acid position at each phylogenetic node. N-glycosylation sequon positions are numbered as in the current SARS-CoV-2 sequence. Positions in the current SARS-CoV-2 sequence that are aligned with multiple sequons in reconstructed ancestral sequences due to insertion/deletion events also include their position in the multiple sequence alignment in parentheses. (panel e) Close-up of the RBD C bound to the N370 FA2G2 N-glycan represented with sticks and yellow C atoms. The RBD C is represented through a solvent accessible surface colorised based on the electrostatic potential calculated with the APBS plugin in PyMol (www.pymol.org). Darker shades of blue indicate increasingly positive charge, white indicate neutral charge and increasingly red shades indicate negatively charged regions. (panel f) Representation of the RBD C bound to the N370 FA2G2 N-glycan in the same orientation as in (panel e) highlighting potentially critical residues for binding. Molecular rendering done with PyMol.

References

    1. Watanabe Y. Bowden T. A. Wilson I. A. Crispin M. Biochim. Biophys. Acta, Gen. Subj. 2019;1863:1480–1497. doi: 10.1016/j.bbagen.2019.05.012. - DOI - PMC - PubMed
    1. Li F. Annu. Rev. Virol. 2016;3:237–261. doi: 10.1146/annurev-virology-110615-042301. - DOI - PMC - PubMed
    1. Plemper R. K. Curr. Opin. Virol. 2011;1:92–100. doi: 10.1016/j.coviro.2011.06.002. - DOI - PMC - PubMed
    1. Tortorici M. A. Veesler D. Adv. Virus Res. 2019;105:93–116. - PMC - PubMed
    1. Walls A. C. Tortorici M. A. Snijder J. Xiong X. Bosch B. J. Rey F. A. Veesler D. Proc. Natl. Acad. Sci. U. S. A. 2017;114:11157–11162. doi: 10.1073/pnas.1708727114. - DOI - PMC - PubMed