. 2022 Jan 27:2022:4071472.
doi: 10.1155/2022/4071472. eCollection 2022.

Causal Biological Network Model for Inflammasome Signaling Applied for Interpreting Transcriptomic Changes in Various Inflammatory States

Affiliations

Causal Biological Network Model for Inflammasome Signaling Applied for Interpreting Transcriptomic Changes in Various Inflammatory States

Hasmik Yepiskoposyan et al. Int J Inflam. .

Abstract

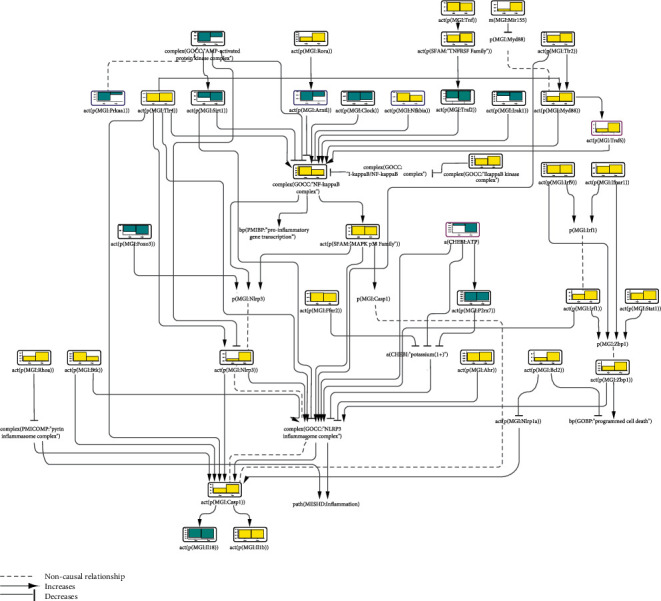
Virtually any stressor that alters the cellular homeostatic state may result in an inflammatory response. As a critical component of innate immunity, inflammasomes play a prominent role in the inflammatory response. The information on inflammasome biology is rapidly growing, thus creating the need for structuring it into a model that can help visualize and enhance the understanding of underlying biological processes. Causal biological network (CBN) models provide predictive power for novel disease mechanisms and treatment outcomes. We assembled the available literature information on inflammasome activation into the CBN model and scored it with publicly available transcriptomic datasets that address viral infection of the lungs, osteo- and rheumatoid arthritis, psoriasis, and aging. The scoring inferred pathway activation leading to NLRP3 inflammasome activation in these diverse conditions, demonstrating that the CBN model provides a platform for interpreting transcriptomic data in the context of inflammasome activation.


Conflict of interest statement

The authors declare that they have no conflicts of interest. All authors are employees of Philip Morris International.

Figures

Figure 1
Figure 1
Part of the inflammasome network model scored with transcriptomic data from GSE51386. The bar graph above each node, which was scored, shows the inferred fold change in mouse lung samples at (1) 4 and (2) 7 days post infection (dpi) relative to uninfected lung samples at the same time point. The directionalities are shown as yellow or blue bars for inferred upregulation or downregulation, respectively. The black outline refers to nodes that were significantly impacted in both samples at both 4 and 7 dpi, the blue outline refers to nodes that were significantly impacted only at 4 dpi, and the purple outline refers to nodes that were significantly impacted only at 7 dpi.
Figure 2
Figure 2
Part of the inflammasome network model scored with transcriptomic data from GSE55235. The bar graph above each node, which was scored, shows the inferred fold change in the synovial tissues of (1) osteoarthritis (OA) and (2) rheumatoid arthritis (RA) patients relative to healthy subjects. The directionalities are shown as yellow or blue bars for inferred upregulation or downregulation, respectively. The black outline refers to nodes that were significantly impacted in both diseases, the blue outline refers to nodes that were significantly impacted only in OA, and the purple outline refers to nodes that were significantly impacted only in RA.
Figure 3
Figure 3
Part of the inflammasome network model scored with transcriptomic data from GSE2737. The bar graph above each node, which was scored, shows the inferred fold change in the (1) unaffected and (2) affected skin areas of psoriatic patients relative to the skin of healthy controls. The directionalities are shown as yellow or blue bars for inferred upregulation or downregulation, respectively. The black outline refers to nodes that were significantly impacted in both samples, the blue outline refers to nodes that were significantly impacted only in unaffected skin samples, and the purple outline refers to nodes that were significantly impacted only in affected skin samples.
Figure 4
Figure 4
Part of the inflammasome network model scored with transcriptomic data from E-MEXP-839. The bar graph above each node, which was scored, shows the inferred fold change in the liver tissue of (1) 16-, (2) 96-, and (3) 130-week-old wild-type (WT) mice relative to 8-week-old WT mice. The directionalities are shown as yellow or blue bars for inferred upregulation or downregulation, respectively. The black outline refers to nodes that were significantly impacted in all ages, the purple outline refers to nodes that were significantly impacted at two time points, and the blue outline refers to nodes that were significantly impacted at only one time point.
Figure 5
Figure 5
Part of the inflammasome network model scored with transcriptomic data from GSE11258. The bar graph above each node, which was scored, shows the inferred fold change in mouse hippocampus after (1) 1 hour, (2) 3 hours, and (3) 6 hours of 50 mM KCl treatment. The directionalities are shown as yellow or blue bars for inferred upregulation or downregulation, respectively. The black outline refers to nodes that were significantly impacted at all time points, and the purple outline refers to nodes that were significantly impacted at two time points.

References

    1. Chovatiya R., Medzhitov R. Stress, inflammation, and defense of homeostasis. Molecular Cell . 2014;54(2):281–288. doi: 10.1016/j.molcel.2014.03.030. - DOI - PMC - PubMed
    1. Zheng D., Liwinski T., Elinav E. Inflammasome activation and regulation: toward a better understanding of complex mechanisms. Cell Discovery . 2020;6(1):p. 36. doi: 10.1038/s41421-020-0167-x. - DOI - PMC - PubMed
    1. Malik A., Kanneganti T.-D. Inflammasome activation and assembly at a glance. Journal of Cell Science . 2017;130(23):3955–3963. doi: 10.1242/jcs.207365. - DOI - PMC - PubMed
    1. Briard B., Fontaine T., Samir P., et al. Galactosaminogalactan activates the inflammasome to provide host protection. Nature . 2020;588(7839):688–692. doi: 10.1038/s41586-020-2996-z. - DOI - PMC - PubMed
    1. Lupfer C., Malik A., Kanneganti T.-D. Inflammasome control of viral infection. Current Opinion in Virology . 2015;12:38–46. doi: 10.1016/j.coviro.2015.02.007. - DOI - PMC - PubMed