Assessment of drivers of spatial genetic variation of a ground-dwelling bird species and its implications for conservation
- PMID: 35127012
- PMCID: PMC8796917
- DOI: 10.1002/ece3.8460
Assessment of drivers of spatial genetic variation of a ground-dwelling bird species and its implications for conservation
Abstract
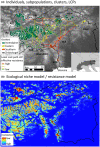
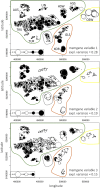
In modern wildlife ecology, spatial population genetic methods are becoming increasingly applied. Especially for animal species in fragmented landscapes, preservation of gene flow becomes a high priority target in order to restore genetic diversity and prevent local extinction. Within Central Europe, the Alps represent the core distribution area of the black grouse, Lyrurus tetrix. At its easternmost Alpine range, events of subpopulation extinction have already been documented in the past decades. Molecular data combined with spatial analyses can help to assess landscape effects on genetic variation and therefore can be informative for conservation management. Here, we addressed whether the genetic pattern of the easternmost Alpine black grouse metapopulation system is driven by isolation by distance or isolation by resistance. Correlative ecological niche modeling was used to assess geographic distances and landscape resistances. We then applied regression-based approaches combined with population genetic analyses based on microsatellite data to disentangle effects of isolation by distance and isolation by resistance among individuals and subpopulations. Although population genetic analyses revealed overall low levels of genetic differentiation, the ecological niche modeling showed subpopulations to be clearly delimited by habitat structures. Spatial genetic variation could be attributed to effects of isolation by distance among individuals and isolation by resistance among subpopulations, yet unknown effects might factor in. The easternmost subpopulation was the most differentiated, and at the same time, immigration was not detected; hence, its long-term survival might be threatened. Our study provides valuable insights into the spatial genetic variation of this small-scale metapopulation system of Alpine black grouse.
Keywords: Lyrurus tetrix; conservation genetics; ecological niche modeling; isolation by distance; isolation by resistance; maximum likelihood population effects (MLPE) models.
© 2021 The Authors. Ecology and Evolution published by John Wiley & Sons Ltd.
Conflict of interest statement
The authors declare no conflicts of interest.
Figures


References
-
- Adriaensen, F. , Chardon, J. P. , De Blust, G. , Swinnen, E. , Villalba, S. , Gulinck, H. , & Matthysen, E. (2003). The application of ‘least‐cost’ modelling as a functional landscape model. Landscape and Urban Planning, 64, 233–247. 10.1016/S0169-2046(02)00242-6 - DOI
-
- Anderson, D. R. , & Burnham, K. P. (2002). Avoiding pitfalls when using information‐theoretic methods. Journal of Wildlife Management, 66, 912–918. 10.2307/3803155 - DOI
-
- Arlettaz, R. , Patthey, P. , Baltic, M. , Leu, T. , Schaub, M. , Palme, R. , & Jenni‐Eiermann, S. (2007). Spreading free‐riding snow sports represent a novel serious threat for wildlife. Proceedings of the Royal Society B‐Biological Sciences, 274, 1219–1224. 10.1098/rspb.2006.0434 - DOI - PMC - PubMed
-
- Baguette, M. , & Van Dyck, H. (2007). Landscape connectivity and animal behavior: Functional grain as a key determinant for dispersal. Landscape Ecology, 22, 1117–1129. 10.1007/s10980-007-9108-4 - DOI
-
- Baines, D. , & Andrew, M. (2003). Marking of deer fences to reduce frequency of collisions by woodland grouse. Biological Conservation, 110, 169–176. 10.1016/S0006-3207(02)00185-4 - DOI
Associated data
LinkOut - more resources
Full Text Sources
Other Literature Sources
Miscellaneous

