. 2022 Feb 2;9(2):211883.
doi: 10.1098/rsos.211883. eCollection 2022 Feb.

School and community reopening during the COVID-19 pandemic: a mathematical modelling study

Affiliations

School and community reopening during the COVID-19 pandemic: a mathematical modelling study

Pei Yuan et al. R Soc Open Sci. .

Abstract

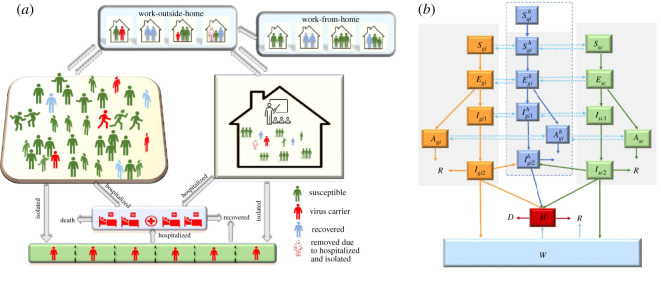
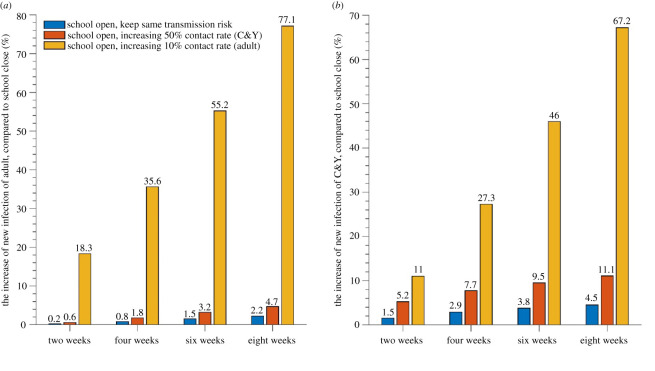
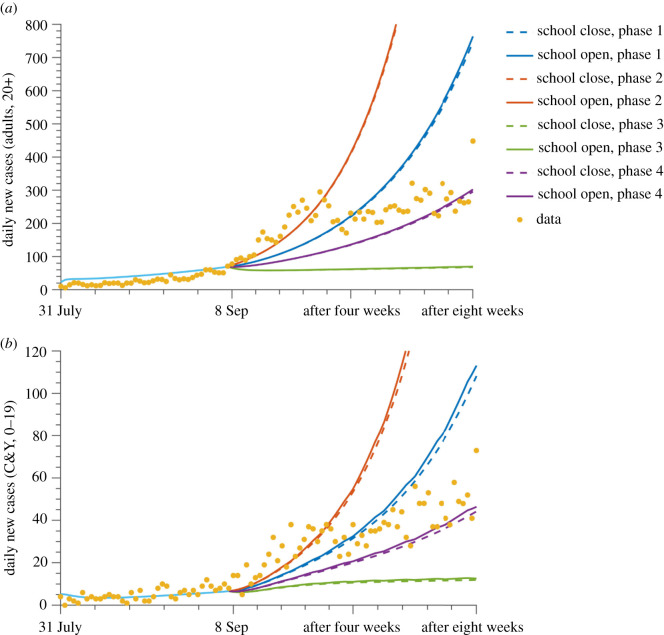
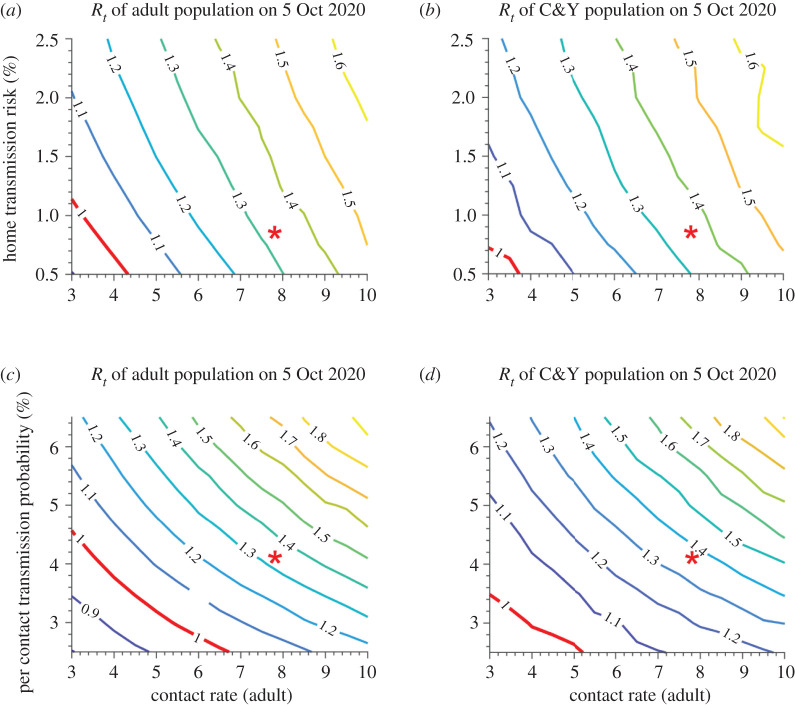
Operating schools safely during the COVID-19 pandemic requires a balance between health risks and the need for in-person learning. Using demographic and epidemiological data between 31 July and 23 November 2020 from Toronto, Canada, we developed a compartmental transmission model with age, household and setting structure to study the impact of schools reopening in September 2020. The model simulates transmission in the home, community and schools, accounting for differences in infectiousness between adults and children, and accounting for work-from-home and virtual learning. While we found a slight increase in infections among adults (2.2%) and children (4.5%) within the first eight weeks of school reopening, transmission in schools was not the key driver of the virus resurgence in autumn 2020. Rather, it was community spread that determined the outbreak trajectory, primarily due to increases in contact rates among adults in the community after school reopening. Analyses of cross-infection among households, communities and schools revealed that home transmission is crucial for epidemic progression and safely operating schools, while the degree of in-person attendance has a larger impact than other control measures in schools. This study suggests that safe school reopening requires the strict maintenance of public health measures in the community.

Keywords: COVID-19; age structure; community opening; household structure; school reopening; transmission model.


Conflict of interest statement

The authors declare to have no competing interests.

Figures

Figure 1.
Figure 1.
Transmission model with age and household structure. Panel (a) shows the activity and response of different structured population groups: household, schools and other community. Panel (b) shows a schematic diagram of the dynamics of COVID-19 in Toronto. Solid lines indicate movement between classes. Dashed lines represent the virus transmission routes. All individuals from work-outside-home (in subscript g), work-from-home (in subscript q), C&Y attending school in-person (sc) groups are in different disease states, Susceptible (Si), Exposed (Ei), Infected (subclinical (Ai), prodromal (Ii1) or with symptoms (Ii2)), Hospitalized (H), Isolated (W), Recovered (R) or Deceased (D). i indicates adults and C&Y population (i = a,c). The individuals in the home are labelled with superscript h, which is the sum of corresponding disease states in all the households. C&Y is children and youth.
Figure 2.
Figure 2.
Percent increase in new cases among adults and C&Y under different scenarios, compared with when schools are closed. Per cent increase in new cases two, four, six and eight weeks after schools opened among adults (a) and C&Y (b) compared with a scenario with schools closed with no increases in contacts (blue bars), contacts among children increased by 50% (orange bars) and contacts among adults increased by 10% (yellow bars).
Figure 3.
Figure 3.
Scenarios where schools are open or closed after 8 September under different control measures. Daily new cases are reported within the adult (a) and C&Y (b) populations under different transmission levels, scenario 1 (blue), scenario 2 (orange), scenario 3 (green) and scenario 4 (purple) as described in the section on Scenario analysis. The solid and dashed line represents the scenarios of schools open or closed, respectively. Data are reported with yellow dots.
Figure 4.
Figure 4.
Rt on 5 October 2020, with schools open, under varying household and community transmission risk. (a,c) Adult population; (b,d) children and youth (C&Y) population. Red star represents the level of phase 2; 5 October 2020 is the date of four weeks after school opening.
Figure 5.
Figure 5.
PRCC plots of transmission-related parameters on new cases among (a) adults, (b) C&Y and (c) C&Y in school. caa, cac and ccc denotes the contact rate of adults–adults, adults–C&Y and C&Y–C&Y in the community. βg represents probability of transmission per contact among adults in the community. qg2 is the quarantine rate of symptomatic infected adults. θi is the isolation rate of symptomatic adults' infection. a, proportion of infected with prodromal infection (1−a, the proportion of asymptomatic (subclinical) infection). qsc is the quarantine rate of symptomatic infected C&Y in the school. η is efficiency of self-screening procedures for detecting infected C&Y without symptoms. ar is the proportion of C&Y attending in-person education. nh is the cohort size in the school.

References

    1. United Nations Sustainable Development Group. 2020. Policy Brief: Education during COVID-19 and beyond. August 2020. https://www.un.org/development/desa/dspd/wp-content/uploads/sites/22/202... (accessed 15 September 2020).
    1. Viner RM, et al. . 2020. School closure and management practices during coronavirus outbreaks including COVID-19: a rapid systematic review. Lancet Child Adolesc. Health 4, 397-404. (10.1016/S2352-4642(20)30095-X) - DOI - PMC - PubMed
    1. Panovska-Griffiths J, Kerr CC, Stuart RM, Mistry D, Klein DJ, Viner RM, Bonell C. 2020. Determining the optimal strategy for reopening schools, the impact of test and trace interventions, and the risk of occurrence of a second COVID-19 epidemic wave in the UK: a modelling study. Lancet Child Adolesc. Health 4, 817-827. (10.1016/S2352-4642(20)30250-9) - DOI - PMC - PubMed
    1. Center for Disease Control and Prevention. 2020. Indicators for Dynamic School Decision-Making. See https://www.cdc.gov/coronavirus/2019-ncov/community/schools-childcare/in... (accessed 22 September 2020).
    1. Ludwig A, Berthiaume P, Orpana H, Nadeau C, Diasparra M, Barnes J, Hennessy D, Otten A, Ogden NH. 2020. Assessing the impact of varying levels of case detection and contact tracing on COVID-19 transmission in Canada during lifting of restrictive closures using a dynamic compartmental model. Can. Commun. Dis. Rep. 46, 409-421. (10.14745/ccdr.v46i1112a08) - DOI - PMC - PubMed

LinkOut - more resources