. 2022 Jan 5;6(1):4-20.
doi: 10.1002/evl3.269. eCollection 2022 Feb.

Genome-wide evolutionary response of European oaks during the Anthropocene

Affiliations

Genome-wide evolutionary response of European oaks during the Anthropocene

Dounia Saleh et al. Evol Lett. .

Abstract

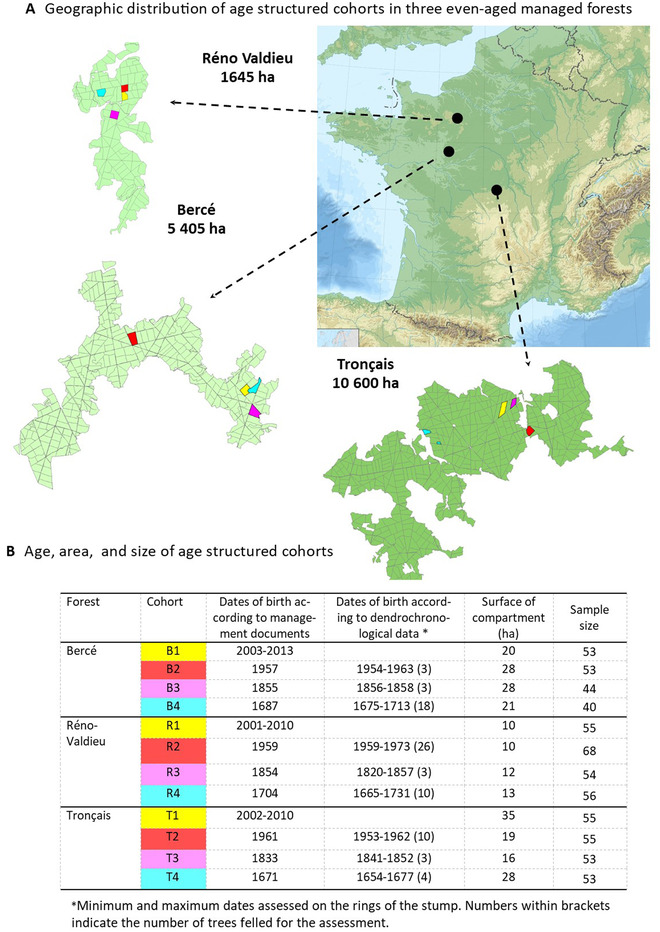
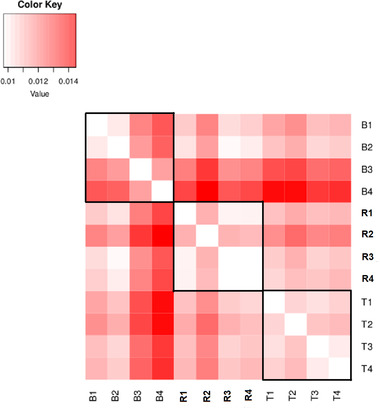
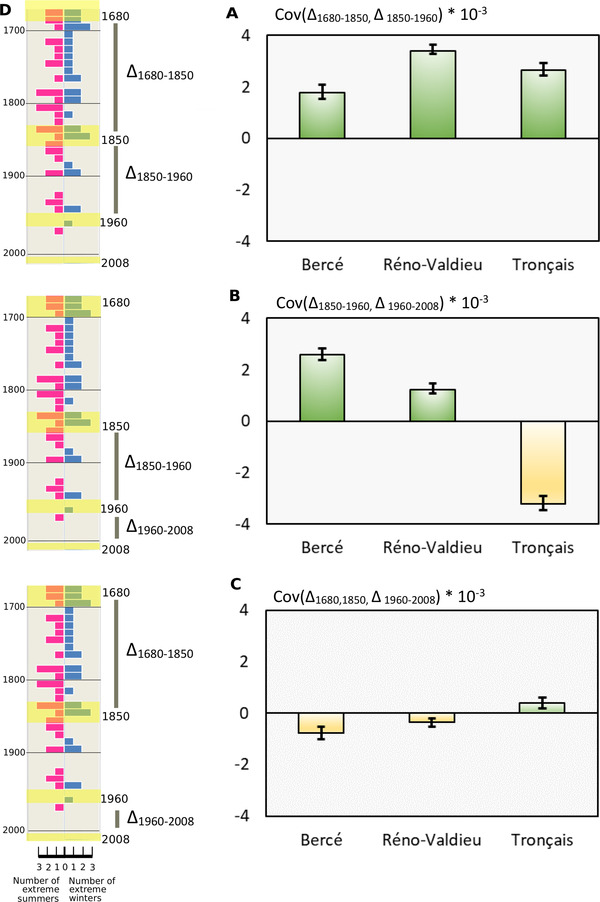
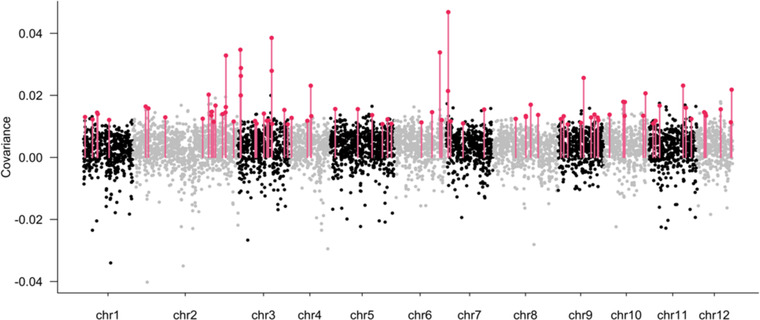
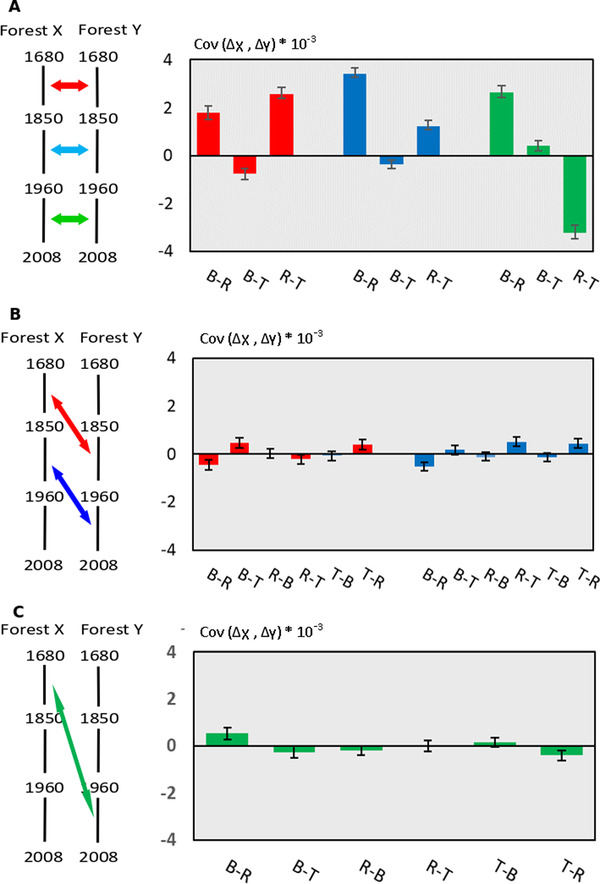
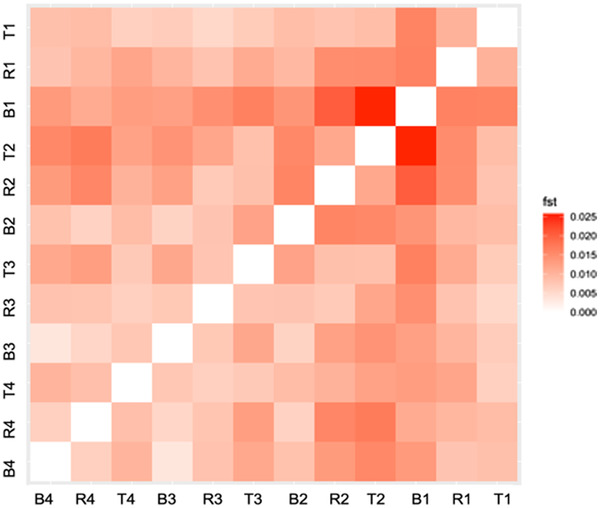
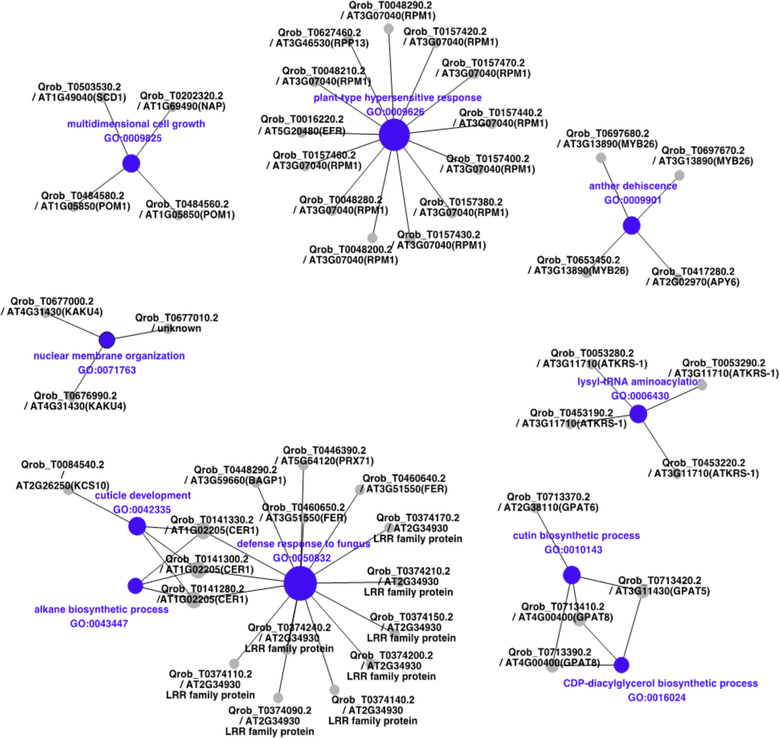
The pace of tree microevolution during Anthropocene warming is largely unknown. We used a retrospective approach to monitor genomic changes in oak trees since the Little Ice Age (LIA). Allelic frequency changes were assessed from whole-genome pooled sequences for four age-structured cohorts of sessile oak (Quercus petraea) dating back to 1680, in each of three different oak forests in France. The genetic covariances of allelic frequency changes increased between successive time periods, highlighting genome-wide effects of linked selection. We found imprints of parallel linked selection in the three forests during the late LIA, and a shift of selection during more recent time periods of the Anthropocene. The changes in allelic covariances within and between forests mirrored the documented changes in the occurrence of extreme events (droughts and frosts) over the last 300 years. The genomic regions with the highest covariances were enriched in genes involved in plant responses to pathogens and abiotic stresses (temperature and drought). These responses are consistent with the reported sequence of frost (or drought) and disease damage ultimately leading to the oak dieback after extreme events. They provide support for adaptive evolution of long-lived species during recent climatic changes. Although we acknowledge that other sources (e.g., gene flow, generation overlap) may have contributed to temporal covariances of allelic frequency changes, the consistent and correlated response across the three forests lends support to the existence of a systematic driving force such as natural selection.

Keywords: Anthropocene; Little Ice Age; Quercus petraea; evolution; linked selection.


Figures

Figure 1
Figure 1
Sampling of forests and age structured cohorts of sessile oak. (A) Distribution of age‐structured cohorts of sessile oak in three even‐aged managed national forests in France. Each forest is subdivided in compartments (about 20 ha in size) limited by the black lines on the forest maps. Age class compartments are evenly distributed in the forests. Densities are extremely high at the seedling stage (>100,0000/ha) and decrease very rapidly due to natural selection during the early stage (≈4000 at age 10). (B) Age, area, and size of age‐structured cohorts. Dendrochronological data of tree rings on felled trees in each cohort allowed to confirm documentary records of tree ages. About 50 trees were randomly sampled in each cohort for whole genome sequencing.
Figure 2
Figure 2
F ST values between age‐structured cohorts in the three forests (B: Bercé; R: Réno‐Valdieu; T: Tronçais). Subscripts to forest acronyms indicate the ages of the cohorts: 4, age ∼340 or year of birth ∼1680; 3, age ∼170 or year of birth ∼1850; 2, age ∼60 year of birth ∼1960; 1, age ∼12 or year of birth ∼2008.
Figure 3
Figure 3
Temporal covariances of allelic frequency changes between different time periods and occurrences of extreme climatic events since the Little Ice Age. Mean and 95% confidence intervals of the covariances were obtained by bootstrapping with 5000 iterations. (A) Temporal covariances of allelic frequency changes between 1680–1850 and 1850–1960 in the three forests. (B) Temporal covariances of allelic frequency changes between 1850–1960 and 1960–2008 in the three forests. (C) Temporal covariances of allelic frequency changes between 1680–1850 and 1960–2008 in the three forests. (D) Timeline subdivided in decades. On the right side of the timeline in blue bars, number of extreme winters per decade according to instrumental temperatures recorded at the Observatory of Paris between 1676 and 2010 (Rousseau 2012) (more details in Fig. S2). On the left side of the timeline in red bars, number of extreme summer droughts per decade according to Cook's data base of Old World megadroughts (Palmer ; van der Schrier et al. ; Cook et al. 2015) (for more details, see Fig. S3). Highlighted decades in yellow correspond to periods when the cohorts became installed after natural regeneration.
Figure 4
Figure 4
Manhattan plots of the temporal covariances of allelic frequency changes between the two oldest time periods (Cov1680‐1850, Δ1850‐1960)) calculated at the tile level, over the whole genome. Black dots correspond to the mean covariance over the three forests. Outliers tiles (red bars) are tiles for which covariances are larger than 0.01 in each of the three forests.
Figure 5
Figure 5
Temporal covariances of allelic frequency changes between the different forests for different time periods. Mean and 95% confidence intervals of the covariances were obtained by bootstrapping with 5000 iterations. Colors of the arrows on the left diagram indicate the time periods considered in the graphs. B: Bercé, R: Réno‐Valdieu, T: Tronçais. (A) Temporal covariances of allelic frequency changes between forests for contemporary time periods. (B) Temporal covariances of allelic frequency changes between forests for adjacent time periods. (C) Temporal covariances of allelic frequency changes between forests for distant time periods.
Figure 6
Figure 6
Matrix of F ST values of SNPs located in the outlier tiles between all pairs of age‐structured cohorts.
Figure 7
Figure 7
Network plot of the 10 most significant Biological Process (BP terms from gene ontology enrichment analysis). The size of the nodes is proportional to their degree of connectivity. The labels correspond to the name of the Quercus robur gene model followed by the locus name of the best Arabidopsis homolog and the corresponding Arabidopsis gene name (from TAIR: https://www.arabidopsis.org/) between brackets when available. When no gene name exists, a short description (from TAIR or EggNOG databases) is added. If no description is available, the description is set to “unknown.”

References

    1. Alberto, F. , Bouffier L., Louvet J. M., Lamy J. B., Delzon S., and Kremer A.. 2011. Adaptive responses for seed and leaf phenology in natural populations of sessile oak along an altitudinal gradient. J. Evol. Biol. 24:1442–1454. - PubMed
    1. Alexa, A. , and Rahnenfuhrer J.. 2020. topGO: enrichment analysis for gene ontology. R package version 2.40.0. Available via https://bioconductor.org/packages/release/bioc/html/topGO.html.
    1. Alexa, A. , Rahnenfuhrer J., and Lengauer T.. 2006. Improved scoring of functional groups from gene expression data by decorrelating GO graph structure. Bioinformatics 22:1600–1607. - PubMed
    1. Alexandre, H. , Truffaut L., Klein E., Ducousso A., Chancerel E., Lesur I., et al. 2020. How does contemporary selection shape oak phenotypes? Evol. Appl. 13:2772–2790. - PMC - PubMed
    1. Altmann, A. , Weber P., Bader D., Preuss M., Binder E. B., and Muller‐Myhsok B.. 2012. A beginners guide to SNP calling from high‐throughput DNA‐sequencing data. Hum. Genet. 131:1541–1554. - PubMed