. 2021 Dec 24;6(1):46-62.
doi: 10.1002/evl3.265. eCollection 2022 Feb.

Age-specific survivorship and fecundity shape genetic diversity in marine fishes

Affiliations

Age-specific survivorship and fecundity shape genetic diversity in marine fishes

Pierre Barry et al. Evol Lett. .

Abstract

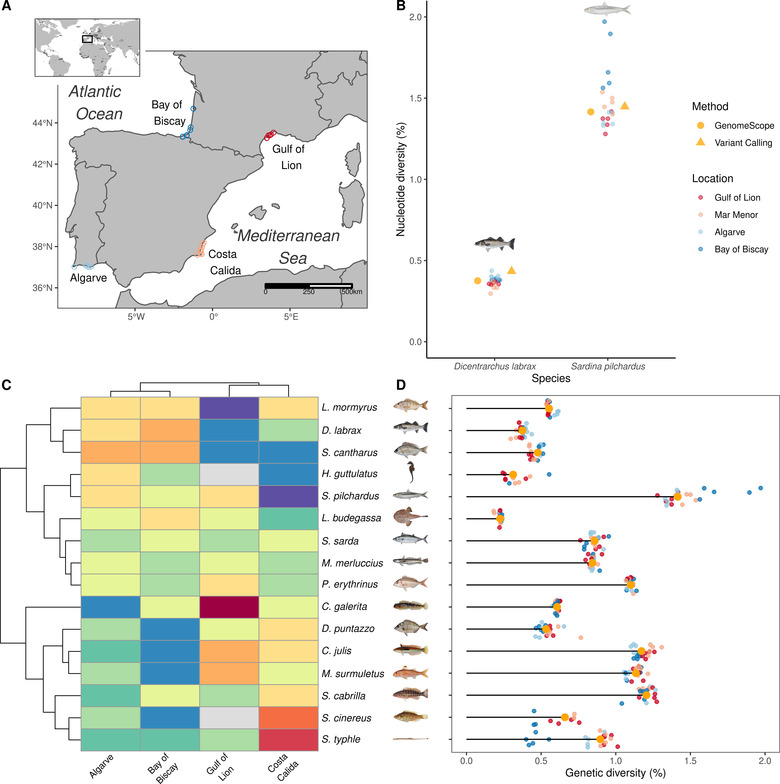
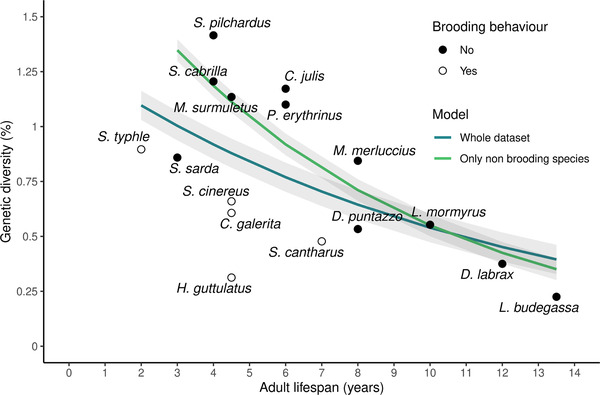
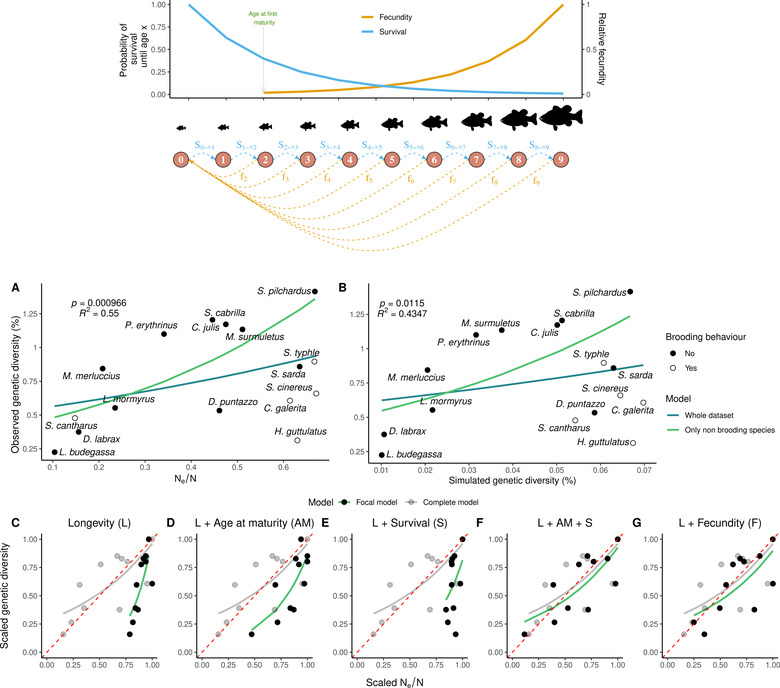
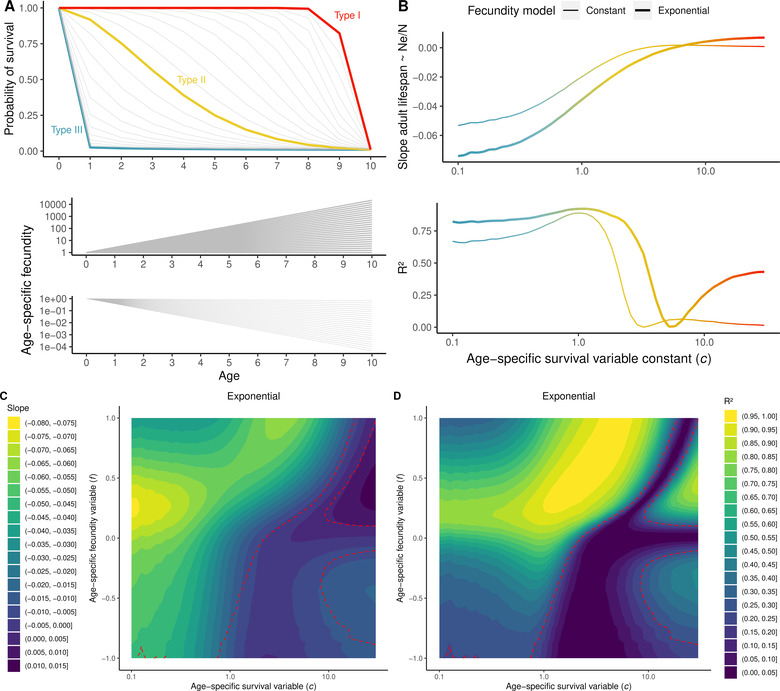
Genetic diversity varies among species due to a range of eco-evolutionary processes that are not fully understood. The neutral theory predicts that the amount of variation in the genome sequence between different individuals of the same species should increase with its effective population size ( N e ). In real populations, multiple factors that modulate the variance in reproductive success among individuals cause N e to differ from the total number of individuals ( N ). Among these, age-specific mortality and fecundity rates are known to have a direct impact on the N e / N ratio. However, the extent to which vital rates account for differences in genetic diversity among species remains unknown. Here, we addressed this question by comparing genome-wide genetic diversity across 16 marine fish species with similar geographic distributions but contrasted lifespan and age-specific survivorship and fecundity curves. We sequenced the whole genome of 300 individuals to high coverage and assessed their genome-wide heterozygosity with a reference-free approach. Genetic diversity varied from 0.2% to 1.4% among species, and showed a negative correlation with adult lifespan, with a large negative effect ( s l o p e = - 0.089 per additional year of lifespan) that was further increased when brooding species providing intense parental care were removed from the dataset ( s l o p e = - 0.129 per additional year of lifespan). Using published vital rates for each species, we showed that the N e / N ratio resulting simply from life tables parameters can predict the observed differences in genetic diversity among species. Using simulations, we further found that the extent of reduction in N e / N with increasing adult lifespan is particularly strong under Type III survivorship curves (high juvenile and low adult mortality) and increasing fecundity with age, a typical characteristic of marine fishes. Our study highlights the importance of vital rates as key determinants of species genetic diversity levels in nature.

Keywords: Adult lifespan; genetic diversity; life tables; marine fishes; variance in reproductive success.


Figures

Figure 1
Figure 1
Sampling and estimation of genetic diversity in 16 marine fish species. In panels A, B, and D, the geographical origin of samples is represented by colors. Atlantic: Bay of Biscay (dark blue), Faro region in Algarve (light blue). Mediterranean: Murcia region in Costa Calida (pink), and Gulf of Lion (red). (A) Sampling map of all individuals included in this study. Each point represents the coordinates of a sample taken from one of four locations: two in the Atlantic Ocean and two in the Mediterranean Sea. (B) Genome‐wide diversity in the European pilchard (S. pilchardus) and European sea bass (D. labrax) estimated after variant calling (orange triangle) or from GenomeScope (orange dot: median; smaller dots: individual estimates) (C) Heatmap clustering showing the variance in scaled genetic diversity within species among locations. Each line represents one species, with the corresponding species name written on the right side; every column represents one location. Blue and red colors, respectively, indicate lower and higher genetic diversity within a location for a given species compared to the average species genetic diversity. (D) Individual and median genetic diversity within each species estimated with GenomeScope. Species illustrations were retrieved from Iglésias (2013) with permissions.
Figure 2
Figure 2
Relationship between species median genetic diversity (%) and adult lifespan, Each point represents the median of the individual genetic diversities for a given species. Adult lifespan is defined as the difference between lifespan and age at first maturity in years. Dot points and empty circles represent nonbrooding species and brooding species, respectively. Blue and green lines represent the beta regression between adult lifespan and genetic diversity considering either the whole dataset (16 species), or the 11 nonbrooding species only, respectively.
Figure 3
Figure 3
Variance in reproductive success induced by age‐specific vital rates and adult lifespan correlates with observed genetic diversity. On top, schematic illustration of age‐specific fecundity (FAge, in orange) and survival (SAge>Age+1, blue) for a given species. (A) and (B) represent the relationship between observed genetic diversity on the y‐axis and, respectively, Ne/N estimated by AgeNe, and simulated genetic diversity with forward‐in‐time simulations in SLiM version 3.31 (Haller and Messer 2017), on x‐axis. Life tables containing information on age‐specific survival, fecundity and lifespan were used for the 16 species. Age at maturity was used only with AgeNe. Dot points represent nonbrooding species and empty circles, brooding species. Blue and green lines represent the beta regression between adult lifespan and genetic diversity considering the whole dataset (16 species), and the 11 nonbrooding species only, respectively. The p-value and the pseudo‐R2 are represented on the top left for each of the two top panels for the nonbrooders model. Panels (C)–(G) represent the relationship between scaled genetic diversity and scaled Ne/N (i.e., divided by the maximum corresponding value) for the 11 nonbrooding species. In each panel, the gray points represent scaled Ne/N estimated from life tables including age at maturity, age‐specific fecundity and survival and sex‐specific differences (as in Panel A). Black points are scaled estimates of Ne/N from life tables with only: (C) longevity (L); (D) longevity (L) and age at maturity (AM); (E) longevity (L) and age‐specific survival (S); (F) longevity (L), age at maturity (AM) and age‐specific survival (S); and (G) longevity (L) and age‐specific fecundity (F). Beta regression models (gray and green lines) that closely overlap the red dotted line indicate that a decrease in Ne/N leads to a similar decrease in genetic diversity.
Figure 4
Figure 4
Slope of the linear model between adult lifespan and Ne/N ratio estimated with AgeNe for different combinations of age‐specific survival and fecundity. (A) On top, gradient of survivorship curves simulated, ranging from type III (blue, c<1) characterized by high juvenile mortality and low adult mortality; to type II (orange, c around 1), constant mortality and type I (red), low juvenile mortality and high adult mortality. At the bottom, simulated fecundity either increases or decreases exponentially with age following FAge=expf×Age, with f ranging from −1 to 1. Sixteen simulated life tables were constructed with the same values of age at maturity and lifespan as the 16 studied species, and all possible survivorship curves and fecundity‐age relationships shown in Panels A and B). Slope and R2 of the regression between adult lifespan and Ne/N ratio for the 16 simulated species as a function of c, for constant fecundity with age (thin line) and exponential increase of fecundity with age with f=0.142 (thick line). (C) Slope and (D) R2 of the regression between adult lifespan and Ne/N ratio for the 16 simulated species for a gradient of values of c and f. In (C), warmer colors indicate steeper negative slopes; in (D) higher R2.

References

    1. Benvenuto, C. , Coscia I., Chopelet J., Sala‐Bozano M., and Mariani S.. 2017. Ecological and evolutionary consequences of alternative sex‐change pathways in fish. Sci. Rep. 7:9084. - PMC - PubMed
    1. Brüniche‐Olsen, A. , Kellner K. F., and DeWoody J. A.. 2019. Island area, body size and demographic history shape genomic diversity in Darwin's finches and related tanagers. Mol. Ecol. 28:4914–4925. - PubMed
    1. Chen, J. , Glémin S., and Lascoux M.. 2017. Genetic diversity and the efficacy of purifying selection across plant and animal species. Mol. Biol. Evol. 34:1417–1428. - PubMed
    1. Chen, S. , Zhou Y., Chen Y., and Gu J.. 2018. Fastp: an ultra‐fast all‐in‐one FASTQ preprocessor. Bioinformatics 34:i884–i890. - PMC - PubMed
    1. Cribari‐Neto, F. , and Zeileis A.. 2010. Beta regression. R. J. Stat. Softw. 34:1–24.