. 2022 Jan 11:11:790037.
doi: 10.3389/fonc.2021.790037. eCollection 2021.

A Novel 2-Carbon-Linked Dimeric Artemisinin With Potent Antileukemic Activity and Favorable Pharmacology

Affiliations

A Novel 2-Carbon-Linked Dimeric Artemisinin With Potent Antileukemic Activity and Favorable Pharmacology

Amanda B Kagan et al. Front Oncol. .

Abstract

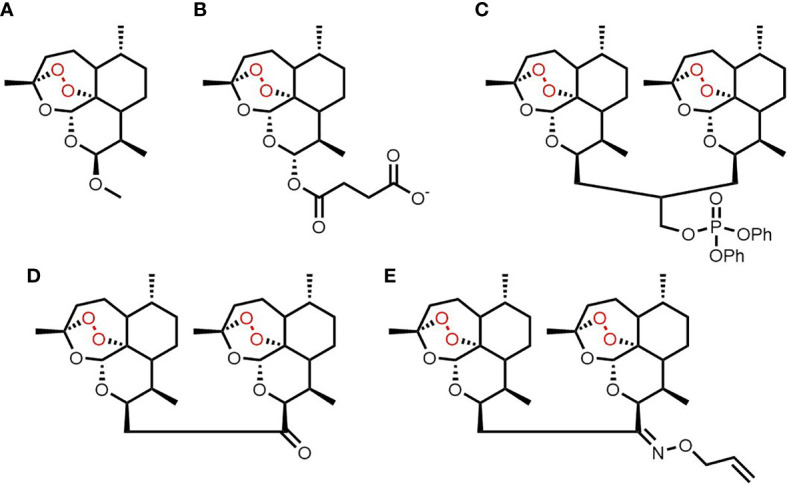
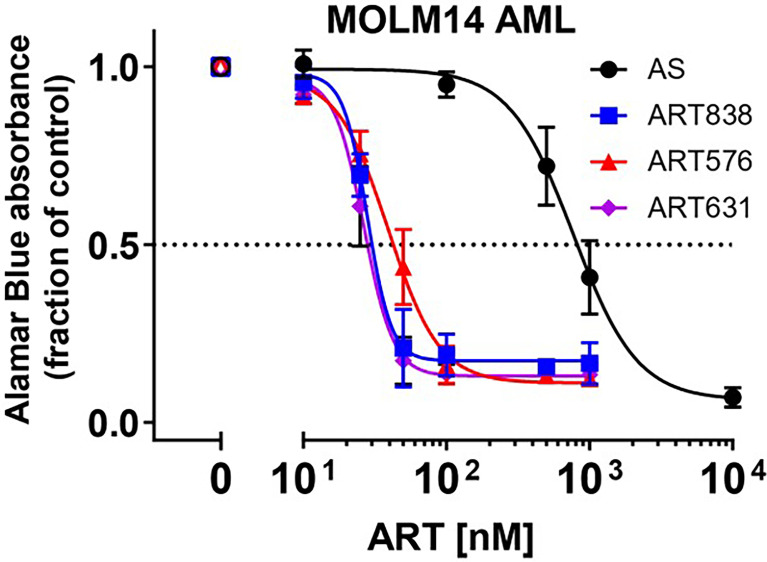
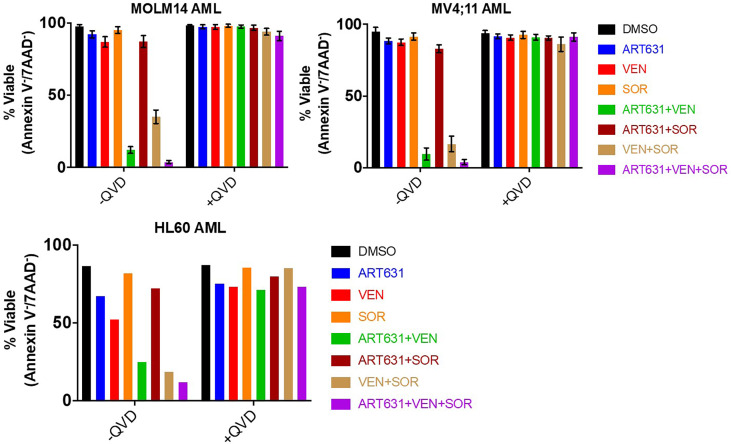
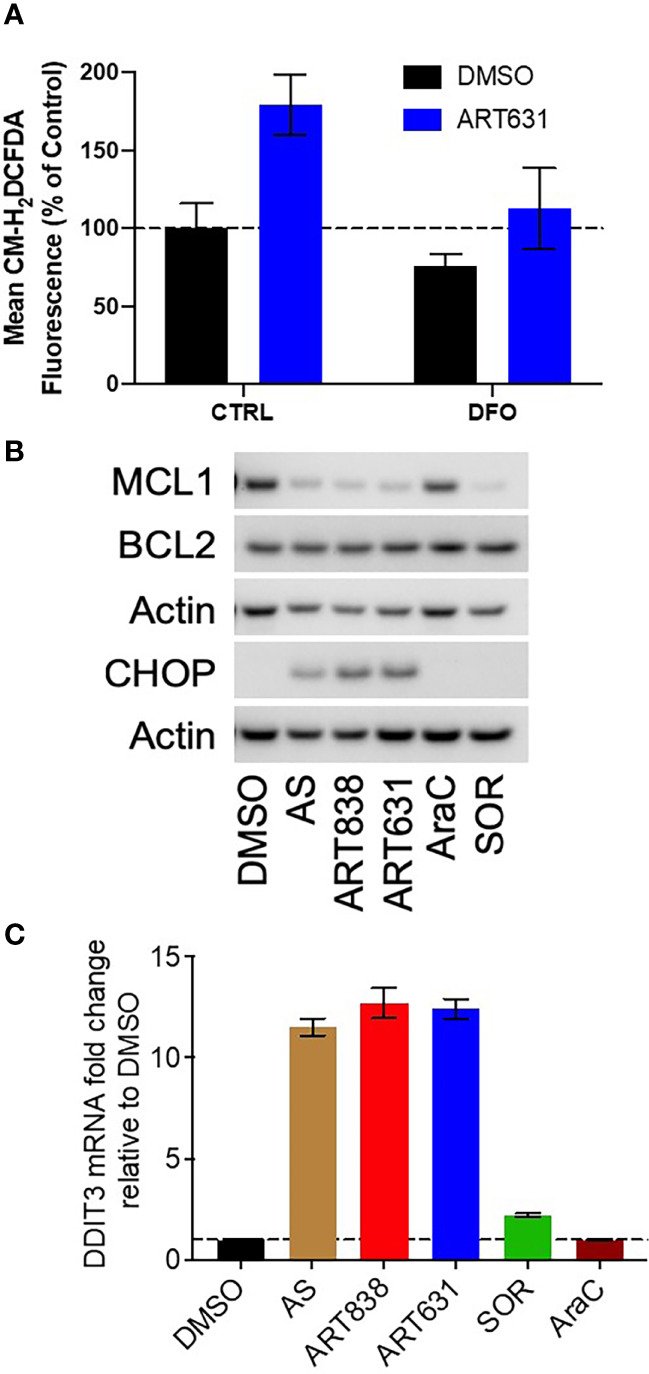
Acute myeloid leukemia (AML) remains a devastating disease, with low cure rates despite intensive standard chemotherapy regimens. In the past decade, targeted antileukemic drugs have emerged from research efforts. Nevertheless, targeted therapies are often effective for only a subset of patients whose leukemias harbor a distinct mutational or gene expression profile and provide only transient antileukemic responses as monotherapies. We previously presented single agent and combination preclinical data for a novel 3-carbon-linked artemisinin-derived dimer (3C-ART), diphenylphosphate analog 838 (ART838), that indicates a promising approach to treat AML, given its demonstrated synergy with targeted antileukemic drugs and large therapeutic window. We now report new data from our initial evaluation of a structurally distinct class of 2-carbon-linked dimeric artemisinin-derived analogs (2C-ARTs) with prior documented in vivo antimalarial activity. These 2C-ARTs have antileukemic activity at low (nM) concentrations, have similar cooperativity with other antineoplastic drugs and comparable physicochemical properties to ART838, and provide a viable path to clinical development.

Keywords: antineoplastics; artemisinins; leukemia; sorafenib; venetoclax (ABT-199).


Conflict of interest statement

BTM is an inventor on patent/patent applications related to the 2C-ARTs synthesis (US20150361088A1, expiration 01/22/2034). MR and CC are inventors on patent/patent applications related the Treatment of Leukemia with Artemisinin Derivatives and Combinations with Other Antineoplastic Agents (US Patent Application Number: 14/757,433/US Patent 9,918,972/expiration 12/23/35). BTM, CC, and MR are founders of Geminus Therapeutics LLC, serve on its Board of Directors and hold equity. Under a license agreement between Geminus Therapeutics LLC and the Johns Hopkins University, Dr. Rudek and the University are entitled to royalty distributions related to technology described in the study discussed in this publication. This arrangement has been reviewed and approved by the Johns Hopkins University (MR) or University of Maryland (CC) in accordance with their conflict of interest policies. The remaining authors declare that the research was conducted in the absence of any commercial or financial relationships that could be construed as a potential conflict of interest.

Figures

Figure 1
Figure 1
Chemical structures of artemisinin (A), artesunate (B), ART838 (C), ART576 (D) and ART631 (E).
Figure 2
Figure 2
2C-ARTs ART631 and ART576 potently inhibited the growth of MOLM14 AML cells, with activity comparable to ART838. In this experiment, provided to show the entire concentration:response range, MOLM14 AML cells were cultured with a range of concentrations of artesunate (AS), ART838, ART631, and ART576 for 48h. Graph indicates growth inhibition relative to vehicle (DMSO)-treated controls by alamarBlue absorbance assays. Data points and error bars represent mean and SD of 3 independent experiments done in triplicate. Although Table 1 shows only IC50s, this full concentration:response range was assessed for all 10 AML cell lines.
Figure 3
Figure 3
ART631-based combination treatments reduced cell viability in AML cell lines. MOLM14, MV4;11, and HL60 AML cells were each treated for 18h with vehicle (DMSO) control, ART631 alone (200 nM), VEN alone (50 nM), SOR alone (5 uM), and 2- and 3-drug combinations, all with and without a 30-45 min pre-incubation with 10 nM pan-caspase inhibitor QVD-OPh (QVD). Treated cells were stained with 2.5 ug/mL 7-aminoactinomycin D (7-AAD) and 0.5 ug/mL allophycocyanin (APC)-conjugated Annexin V in Annexin V binding buffer and analyzed by flow cytometry. Graphs indicate % cell viability based on Annexin V/7-AAD dual staining. For MOLM14 and MV4;11, means and SDs shown are based on 3 independent experiments. HL60 cell data is from one experiment done in triplicate.
Figure 4
Figure 4
ART631 elevated ROS and CHOP levels and reduced MCL1 expression in MOLM14 AML cells. (A) MOLM14 AML cells were pre-treated with ROS detection reagent CM-H2DCFDA (5 mM) for 30 min, pre-treated with deferoxamine mesylate (DFO; 11 mM) for 60 min, and then treated with ART631 (200 nM) or DMSO control for 18h. They were then analyzed by flow cytometry. Graph represents %CM-H2DCFDA fluorescence compared to vehicle (DMSO) control treated cells. Error bars represent SD from 3 independent experiments. (B) MOLM14 AML cells were treated for 18h with vehicle, AS (10 uM), ART838 (200 nM), ART631 (200 nM), cytarabine (AraC; 150 nM), or SOR (5 uM). Protein was isolated and western blotted for MCL1, BCL2, CHOP, and β-actin. (C) MOLM14 cells were treated as in (B) for 18h, total RNA isolated, cDNA synthesized, and SYBR Green qRT-PCR performed in triplicates. Ct values were normalized to housekeeping gene GAPDH and fold change shown relative to vehicle (DMSO) control. Error bars represent SD from 3 independent experiments done in triplicate.
Figure 5
Figure 5
ART631 elevated ROS and CHOP levels and reduced MCL1 expression in MV4;11 and ML2 AML cells. (A) MV4;11 cells (left) and ML2 cells (right) were treated for 18h with vehicle, AS (10 uM), ART838 (200 nM), ART631 (200 nM), cytarabine (AraC; 150 nM), or SOR (5 uM). Protein was isolated and western blotted for MCL1, BCL2, CHOP, and β-actin. (B) MV4;11 cells (left) and ML2 cells (right) were treated as in (A) for 18h, total RNA isolated, cDNA synthesized, and SYBR Green qRT-PCR performed. Ct values were normalized to housekeeping gene GAPDH and fold change shown relative to vehicle (DMSO) control. Error bars represent SD from 3 independent experiments done in triplicate. ML2 cell data is from one experiment done in triplicate.
Figure 6
Figure 6
Concentration-time profiles of ART631 in NRG mice (n=3) treated with single doses of 75 mg/kg PO ART631 (MTD dose; closed circle), or multiple doses of 15 mg/kg PO ART631 for 5 days (MTD dose) alone (open circle) or in the SAV combination (closed square). Plasma was obtained over 12h, with ART631 concentration determined by LC/MS-MS. Dashed line represents the highest in vitro IC50 of ART631 (45 nM). Data points and error bars represent mean and SD of 3 replicates, respectively.
Figure 7
Figure 7
VEN plus SOR plus ART631 induced deep, long remissions in AML xenografts. (A) SAV MTD cyclic drug treatment schema. (B) NRG mice were transplanted IV with Luc-labeled MV4;11 cells on day -10. After Xenogen quantification of baseline total body luminescence on day 0, mice were placed into balanced experimental groups prior to drug administration via gavage, then treated per our previously established MTD PO x 5 day schedule (5 days on, 9 days off). Mice were treated with 15 mg/kg/d ART631 as monotherapy or in combination with 150 mg/kg/d VEN and 30 mg/kg/d SOR for 5 identical 5-day treatment cycles over 10 weeks. These xenograft experiments with ART631 and ART631-containing SAV were performed simultaneously with those with ART838 and ART838-containing SAV reported previously (20). Treatment response outcomes were measured by (C) leukemia response quantitation (fold-change in leukemia burden on day 7 (and later) vs day 0 for each mouse via Xenogen imaging (grey-shaded bands on graphs indicate days when mice were treated). Error bars represent SD of fold-change in leukemia burden of mice in each treatment group. (D) shows corresponding Kaplan-Meier survival curves. Mouse deaths empirically defined to have occurred for reasons other than leukemia (i.e. deaths of mice with luminescence at or below average background luminescence (5.7x10⁵ photons/mouse based on intensity values from non-leukemia bearing mice) were censored. Comparisons between treatment groups were calculated by log-rank (Mantel-Cox) test.
Figure 8
Figure 8
VEN plus SOR plus ART631 induced deep, long remissions in AML xenografts. (A) NRG mice were transplanted IV with Luc-labeled MOLM14 cells on day -10. After Xenogen quantification of baseline total body luminescence on day 0, mice were placed into balanced experimental groups prior to drug administration via gavage, then treated per our previously established MTD PO x 5 day schedule (5 days on, 9 days off). Mice were treated with 15 mg/kg/d ART631 as monotherapy or in combination with 150 mg/kg/d VEN and 30 mg/kg/d SOR for 5 identical 5-day treatment cycles over 10 weeks. These xenograft experiments with ART631 and ART631-containing SAV were performed simultaneously with those with ART838 and ART838-containing SAV reported previously (20). Treatment response outcomes were measured by (B) leukemia response quantitation (fold-change in leukemia burden on day 7 (and later) vs day 0 for each mouse via Xenogen imaging (grey-shaded bands on graphs indicate days when mice were treated). Error bars represent SD of fold-change in leukemia burden of mice in each treatment group. (C) shows corresponding Kaplan-Meier survival curves. Mouse deaths empirically defined to have occurred for reasons other than leukemia (i.e. deaths of mice with luminescence at or below average background luminescence (5.7x10⁵ photons/mouse based on intensity values from non-leukemia bearing mice) were censored. Comparisons between treatment groups were calculated by log-rank (Mantel-Cox) test.
Figure 9
Figure 9
VEN plus SOR plus ART631 inhibited growth of an AML PDX. NRG mice bearing luc/YFP-labeled AML45 PDX were prepared as in Figure 7 . (A) After Xenogen quantification of baseline total body luminescence on day 0, mice were placed into balanced experimental groups prior to drug administration via gavage, then treated per our previously established MTD PO x 5 day schedule (5 days on, 9 days off). Mice were treated with 15 mg/kg/d ART631 as monotherapy, with 150 mg/kg/d VEN and 30 mg/kg/d SOR, or with ART631 plus VEN plus SOR (i.e. SAV) at the previously indicated doses for 4 identical 5-day treatment cycles over 8 weeks. This PDX experiment was also performed simultaneously with the previously reported AML45 PDX experiment with ART838 and ART838-containing SAV (20). Treatment response outcomes were measured by (B) leukemia response quantitation (fold-change in leukemia burden on day 7 (and later) versus day 0 for each mouse via Xenogen imaging (grey-shaded bands on graphs indicate days when mice were treated). Error bars represent the SD of fold-change in leukemia burden of mice in each treatment group. (C) shows corresponding Kaplan-Meier survival curves. Comparisons between treatment groups were calculated by log-rank (Mantel-Cox) test.

References

    1. Kantarjian HM, Short NJ, Fathi AT, Marcucci G, Ravandi F, Tallman M, et al. . Acute Myeloid Leukemia: Historical Perspective and Progress in Research and Therapy Over 5 Decades. Clin Lymphoma Myeloma Leuk (2021) 21(9):580–97. doi: 10.1016/j.clml.2021.05.016 - DOI - PMC - PubMed
    1. Sasaki K, Ravandi F, Kadia TM, DiNardo CD, Short NJ, Borthakur G, et al. . De Novo Acute Myeloid Leukemia: A Population-Based Study of Outcome in the United States Based on the Surveillance, Epidemiology, and End Results (SEER) Database 1980 to 2017. Cancer (2021) 127(12):2049–61. doi: 10.1002/cncr.33458 - DOI - PMC - PubMed
    1. Lai C, Doucette K, Norsworthy K. Recent Drug Approvals for Acute Myeloid Leukemia. J Hematol Oncol (2019) 12(1):100. doi: 10.1186/s13045-019-0774-x - DOI - PMC - PubMed
    1. Konopleva M, Pollyea DA, Potluri J, Chyla B, Hogdal L, Busman T, et al. . Efficacy and Biological Correlates of Response in a Phase II Study of Venetoclax Monotherapy in Patients With Acute Myelogenous Leukemia. Cancer Discov (2016) 6(10):1106–17. doi: 10.1158/2159-8290.CD-16-0313 - DOI - PMC - PubMed
    1. Scholl S, Fleischmann M, Schnetzke U, Heidel FH. Molecular Mechanisms of Resistance to FLT3 Inhibitors in Acute Myeloid Leukemia: Ongoing Challenges and Future Treatments. Cells (2020) 9(11):2493. doi: 10.3390/cells9112493 - DOI - PMC - PubMed