. 2022 Jan 21:12:811767.
doi: 10.3389/fonc.2022.811767. eCollection 2022.

A Magnetic Resonance Imaging-Based Radiomic Model for the Noninvasive Preoperative Differentiation Between Transitional and Atypical Meningiomas

Affiliations

A Magnetic Resonance Imaging-Based Radiomic Model for the Noninvasive Preoperative Differentiation Between Transitional and Atypical Meningiomas

Jing Zhang et al. Front Oncol. .

Abstract

Preoperative distinction between transitional meningioma and atypical meningioma would aid the selection of appropriate surgical techniques, as well as the prognosis prediction. Here, we aimed to differentiate between these two tumors using radiomic signatures based on preoperative, contrast-enhanced T1-weighted and T2-weighted magnetic resonance imaging. A total of 141 transitional meningioma and 101 atypical meningioma cases between January 2014 and December 2018 with a histopathologically confirmed diagnosis were retrospectively reviewed. All patients underwent magnetic resonance imaging before surgery. For each patient, 1227 radiomic features were extracted from contrast-enhanced T1-weighted and T2-weighted images each. Least absolute shrinkage and selection operator regression analysis was performed to select the most informative features of different modalities. Subsequently, stepwise multivariate logistic regression was chosen to further select strongly correlated features and build classification models that can distinguish transitional from atypical meningioma. The diagnostic abilities were evaluated by receiver operating characteristic analysis. Furthermore, a nomogram was built by incorporating clinical characteristics, radiological features, and radiomic signatures, and decision curve analysis was used to validate the clinical usefulness of the nomogram. Sex, tumor shape, brain invasion, and four radiomic features differed significantly between transitional meningioma and atypical meningioma. The clinicoradiomic model derived by fusing the above features resulted in the best discrimination ability, with areas under the curves of 0.809 (95% confidence interval, 0.743-0.874) and 0.795 (95% confidence interval, 0.692-0.899) and sensitivity values of 74.0% and 71.4% in the training and validation cohorts, respectively. The clinicoradiomic model demonstrated good performance for the differentiation between transitional and atypical meningioma. It is a quantitative tool that can potentially aid the selection of surgical techniques and the prognosis prediction and can thus be applied in patients with these two meningioma subtypes.

Keywords: clinical decision-making; meningioma; neoplasm grading; radiomics; retrospective studies.


Conflict of interest statement

The authors declare that the research was conducted in the absence of any commercial or financial relationships that could be construed as a potential conflict of interest.

Figures

Figure 1
Figure 1
Inclusion and exclusion criteria.
Figure 2
Figure 2
Boxplots of the four radiomic features (A–D) with significant differences between transitional meningioma (TM) and atypical meningioma (AM) groups in the training cohort. The symbol **** represents p < 0.001.
Figure 3
Figure 3
Chord diagram of the correlation between clinicoradiological and selected radiomic features. Correlation analysis of clinicoradiological and selected radiomic features in the training (A) and validation (B) cohorts. The Spearman correlation test confirms that each link is significantly correlated (P < 0.05). The width of a link represents the strength of the correlation. For example, the T1C_SquareRootGLSZM_squareroot_zoneEntropy feature (gray) is highly correlated with tumor shape in both training and validation cohorts.
Figure 4
Figure 4
Plots (A–E) show the boxplots of the corresponding radiomics score in the T1C, T2, combination of T1C and T2, clinical and clinicoradiomics models, respectively.
Figure 5
Figure 5
Comparison of the receiver operating characteristic (ROC) curves of the different models. (A, B) ROC curves of the different models in the training and validation cohorts. The clinicoradiomic model demonstrates the best discrimination ability among these models, with area under the curve (AUC) values of 0.809 and 0.795 in the training and validation cohorts, respectively. (C, D) Radiomic signature histogram of the training and validation cohorts. The red bar shows the sample with transitional meningioma (TM), and the blue bar shows the sample with atypical meningioma (AM).
Figure 6
Figure 6
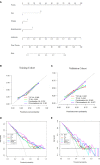
Establishment and performance of the clinicoradiomic model. (A) The clinicoradiomic model is used to develop a nomogram. (B, C) Calibration curves of the clinicoradiomic nomogram for the training and validation cohorts. The x-axis represents the probability of atypical meningioma (AM) and transitional meningioma (TM) as measured by the clinicoradiomic model, and the y-axis represents the actual rate of AM and TM. The solid line represents the discrimination ability of the nomogram, and the diagonal dotted line represents the ideal evaluation by a perfect model. The P-values in the Hosmer-Lemeshow test are 0.361 and 0.472 in the training and validation cohorts, respectively. A closer fit to the diagonal dotted line represents a better evaluation. (D, E) Decision curve analysis for the clinicoradiomic model. The x-axis shows the threshold probability, and the y-axis measures the net benefit. The gray line represents all patients with AM, whereas the black line represents all patients with TM. The pink line represents the clinicoradiomic model.

References

    1. Park YW, Oh J, You SC, Han K, Ahn SS, Choi YS, et al. . Radiomics and Machine Learning may Accurately Predict the Grade and Histological Subtype in Meningiomas Using Conventional and Diffusion Tensor Imaging. Eur Radiol (2019) 29(8):4068–76. doi: 10.1007/s00330-018-5830-3 - DOI - PubMed
    1. Louis DN, Perry A, Reifenberger G, von Deimling A, Figarella-Branger D, Cavenee WK, et al. . The 2016 World Health Organization Classification of Tumors of the Central Nervous System: A Summary. Acta Neuropathol (2016) 131(6):803–20. doi: 10.1007/s00401-016-1545-1 - DOI - PubMed
    1. Ma X-J, Zhang G-J, Wang W, Li D, Wu Z, Zhang J-T. Proposed Treatment for Intracranial Transitional Meningioma: A Single-Center Series of 298 Cases. World Neurosurgery (2019) 127:e280–7. doi: 10.1016/j.wneu.2019.03.104 - DOI - PubMed
    1. Barresi V, Lionti S, Caliri S, Caffo M. Caffo: Histopathological Features to Define Atypical Meningioma: What Does Really Matter for Prognosis? Brain Tumor Pathol (2018) 35(3):168–80. doi: 10.1007/s10014-018-0318-z - DOI - PubMed
    1. Dehghan Harati M, Yu A, Magaki SD, Perez-Rosendahl M, Im K, Park YK, et al. . Clinicopathologic Features and Pathogenesis of Melanocytic Colonization in Atypical Meningioma. Neuropathology (2018) 38(1):54–61. doi: 10.1111/neup.12409 - DOI - PubMed

LinkOut - more resources