

Thiol antioxidants protect human lens epithelial (HLE B-3) cells against tert-butyl hydroperoxide-induced oxidative damage and cytotoxicity
- PMID: 35128081
- PMCID: PMC8808075
- DOI: 10.1016/j.bbrep.2022.101213
Thiol antioxidants protect human lens epithelial (HLE B-3) cells against tert-butyl hydroperoxide-induced oxidative damage and cytotoxicity
Abstract
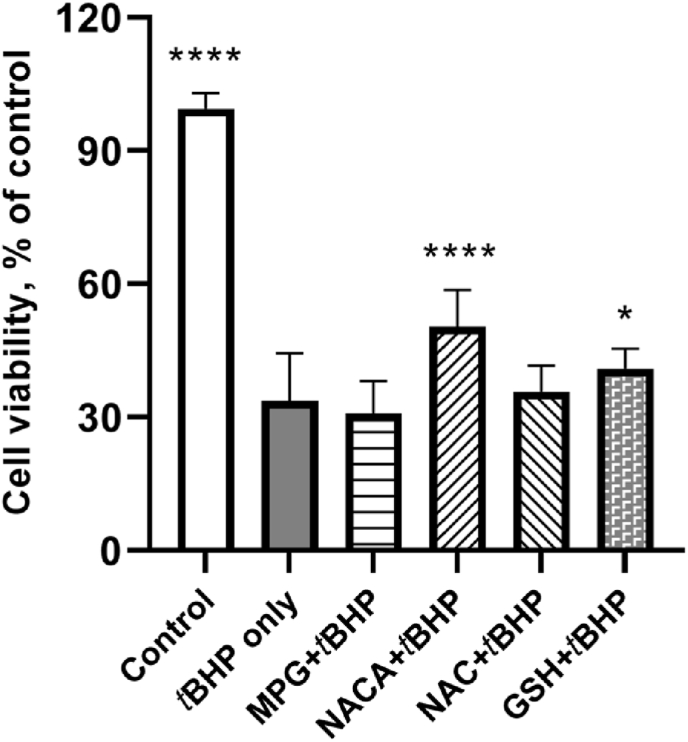
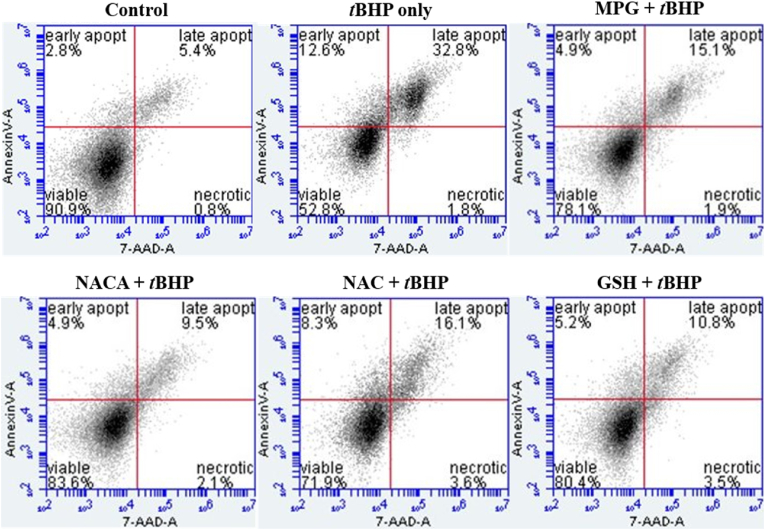
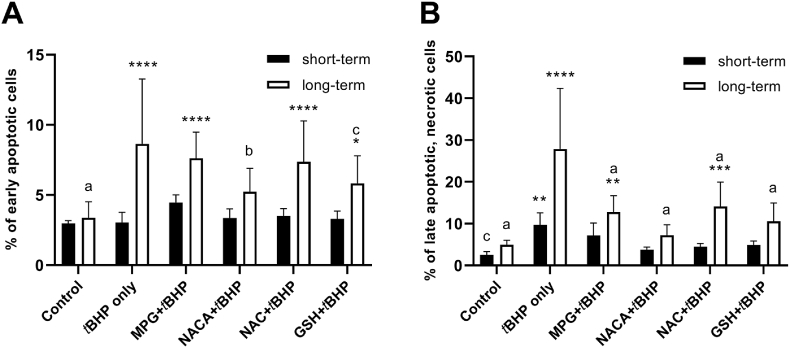
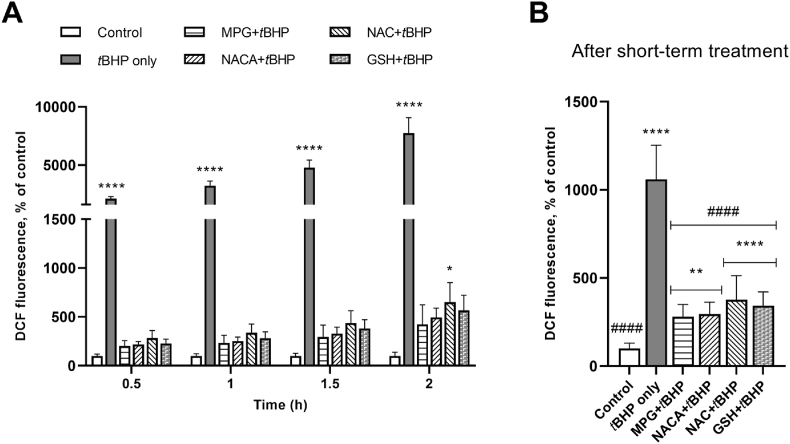
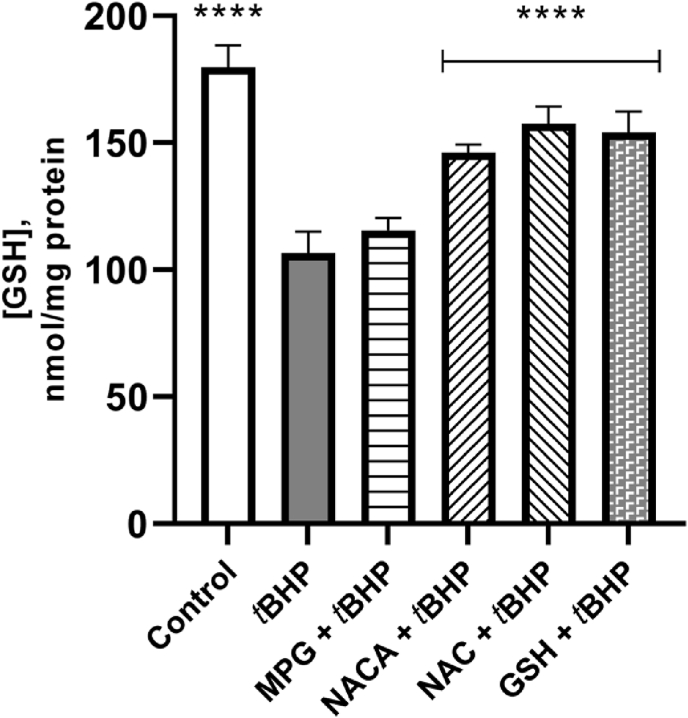
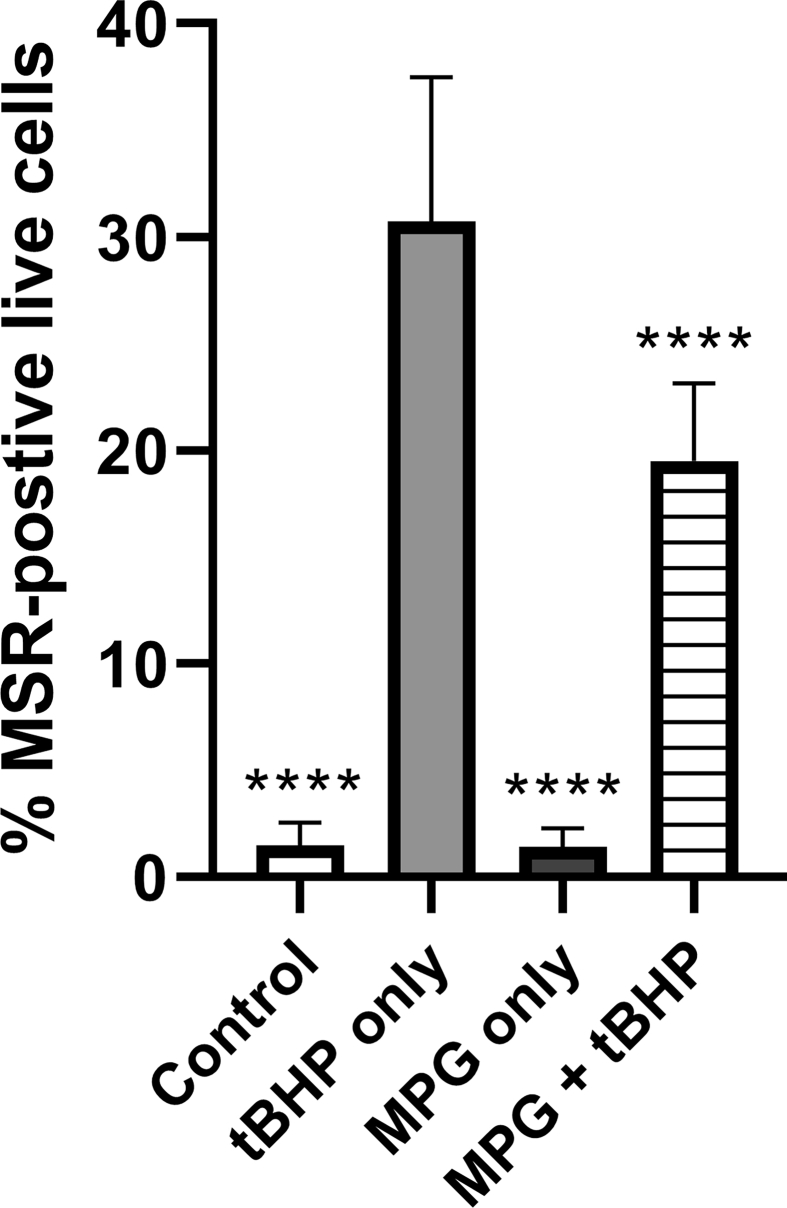
Oxidative damage to lens epithelial cells plays an important role in the development of age-related cataract, and the health of the lens has important implications for overall ocular health. As a result, there is a need for effective therapeutic agents that prevent oxidative damage to the lens. Thiol antioxidants such as tiopronin or N-(2-mercaptopropionyl)glycine (MPG), N-acetylcysteine amide (NACA), N-acetylcysteine (NAC), and exogenous glutathione (GSH) may be promising candidates for this purpose, but their ability to protect lens epithelial cells is not well understood. The effectiveness of these compounds was compared by exposing human lens epithelial cells (HLE B-3) to the chemical oxidant tert-butyl hydroperoxide (tBHP) and treating the cells with each of the antioxidant compounds. MTT cell viability, apoptosis, reactive oxygen species (ROS), and levels of intracellular GSH, the most important antioxidant in the lens, were measured after treatment. All four compounds provided some degree of protection against tBHP-induced oxidative stress and cytotoxicity. Cells treated with NACA exhibited the highest viability after exposure to tBHP, as well as decreased ROS and increased intracellular GSH. Exogenous GSH also preserved viability and increased intracellular GSH levels. MPG scavenged significant amounts of ROS, and NAC increased intracellular GSH levels. Our results suggest that both scavenging ROS and increasing GSH may be necessary for effective protection of lens epithelial cells. Further, the compounds tested may be useful for the development of therapeutic strategies that aim to prevent oxidative damage to the lens.
Keywords: 7-AAD, 7-aminoactinomycin D; ATCC, American Type Culture Collection; Antioxidant; Carboxy-H2DCFDA, 6-carboxy-2′,7′-dichlorodihydrofluorescein diacetate; Cataract; EMEM, Eagle's minimum essential medium; FBS, fetal bovine serum; FDA, United States Food and Drug Administration; GSH, glutathione; GSSG, glutathione disulfide; Glutathione; H2O2, hydrogen peroxide; HLE B-3, human (eye) lens epithelial cell line B-3; Lens; MPG, N-(2-mercaptopropionyl)glycine; MTT, (3-(4,5-dimethylthiazol-2-yl)-2,5-diphenyltetrazolium bromide); NAC, N-acetylcysteine; NACA, N-acetylcysteine amide; OH•, hydroxyl radical; Oxidative stress; PBS, phosphate-buffered saline; ROS, reactive oxygen species; Thiol; tBHP, tert-butyl hydroperoxide.
© 2022 The Authors.
Conflict of interest statement
This work was supported by the Nation Institutes of Health National Eye Institute 1R15EY029813-01A1. The authors report no additional conflicts of interest.
Figures
Similar articles
-
Topical Instillation of N-Acetylcysteine and N-Acetylcysteine Amide Impedes Age-Related Lens Opacity in Mice.Biomolecules. 2025 Mar 19;15(3):442. doi: 10.3390/biom15030442. Biomolecules. 2025. PMID: 40149978 Free PMC article.
-
N-Acetylcysteine amide (NACA) and diNACA inhibit H2O2-induced cataract formation ex vivo in pig and rat lenses.Exp Eye Res. 2023 Sep;234:109610. doi: 10.1016/j.exer.2023.109610. Epub 2023 Aug 1. Exp Eye Res. 2023. PMID: 37536438
-
Flavonoids Derived from Abelmoschus esculentus Attenuates UV-B Induced Cell Damage in Human Dermal Fibroblasts Through Nrf2-ARE Pathway.Pharmacogn Mag. 2016 May;12(Suppl 2):S129-38. doi: 10.4103/0973-1296.182175. Epub 2016 May 11. Pharmacogn Mag. 2016. PMID: 27279697 Free PMC article.
-
Reactive Oxygen Species and the Aging Eye: Specific Role of Metabolically Active Mitochondria in Maintaining Lens Function and in the Initiation of the Oxidation-Induced Maturity Onset Cataract--A Novel Platform of Mitochondria-Targeted Antioxidants With Broad Therapeutic Potential for Redox Regulation and Detoxification of Oxidants in Eye Diseases.Am J Ther. 2016 Jan-Feb;23(1):e98-117. doi: 10.1097/MJT.0b013e3181ea31ff. Am J Ther. 2016. PMID: 21048433 Review.
-
Glutathione and Glutaredoxin in Redox Regulation and Cell Signaling of the Lens.Antioxidants (Basel). 2022 Oct 1;11(10):1973. doi: 10.3390/antiox11101973. Antioxidants (Basel). 2022. PMID: 36290696 Free PMC article. Review.
Cited by
-
Oxidative Stress in Cataract Formation: Is There a Treatment Approach on the Horizon?Antioxidants (Basel). 2024 Oct 16;13(10):1249. doi: 10.3390/antiox13101249. Antioxidants (Basel). 2024. PMID: 39456502 Free PMC article. Review.
-
Enzymatic Biosynthesis of Simple Phenolic Glycosides as Potential Anti-Melanogenic Antioxidants.Antioxidants (Basel). 2022 Jul 19;11(7):1396. doi: 10.3390/antiox11071396. Antioxidants (Basel). 2022. PMID: 35883887 Free PMC article.
-
The impact of lutein-loaded poly(lactic-co-glycolic acid) nanoparticles following topical application: An in vitro and in vivo study.PLoS One. 2024 Aug 1;19(8):e0306640. doi: 10.1371/journal.pone.0306640. eCollection 2024. PLoS One. 2024. PMID: 39088452 Free PMC article.
-
Improving dermal fibroblast-to-epidermis communications and aging wound repair through extracellular vesicle-mediated delivery of Gstm2 mRNA.J Nanobiotechnology. 2024 Jun 2;22(1):307. doi: 10.1186/s12951-024-02541-1. J Nanobiotechnology. 2024. PMID: 38825668 Free PMC article.
-
Topical Instillation of N-Acetylcysteine and N-Acetylcysteine Amide Impedes Age-Related Lens Opacity in Mice.Biomolecules. 2025 Mar 19;15(3):442. doi: 10.3390/biom15030442. Biomolecules. 2025. PMID: 40149978 Free PMC article.
References
-
- Lee C.M., Afshari N.A. The global state of cataract blindness. Curr. Opin. Ophthalmol. 2017;28:98–103. - PubMed
-
- Chang S. LXII Edward Jackson lecture: open angle glaucoma after vitrectomy. Am. J. Ophthalmol. 2006;141:1033–1043. - PubMed
-
- Teh B.L., Megaw R., Borooah S., Dhillon B. Optimizing cataract surgery in patients with age-related macular degeneration. Surv. Ophthalmol. 2017;62:346–356. - PubMed
Grants and funding
LinkOut - more resources
Full Text Sources
Research Materials
