. 2022 Jan 12;25(2):103764.
doi: 10.1016/j.isci.2022.103764. eCollection 2022 Feb 18.

BepiTBR: T-B reciprocity enhances B cell epitope prediction

Affiliations

BepiTBR: T-B reciprocity enhances B cell epitope prediction

James Zhu et al. iScience. .

Abstract

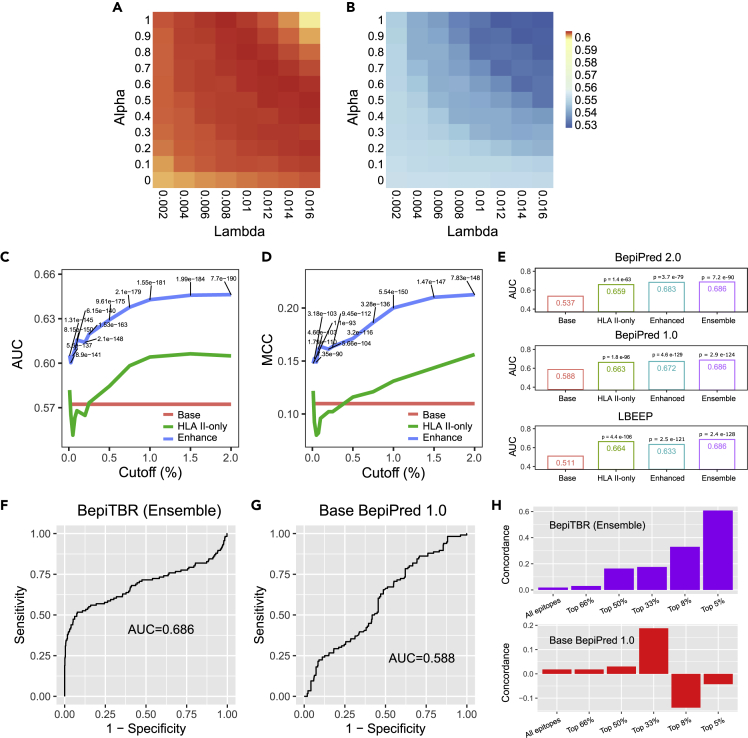
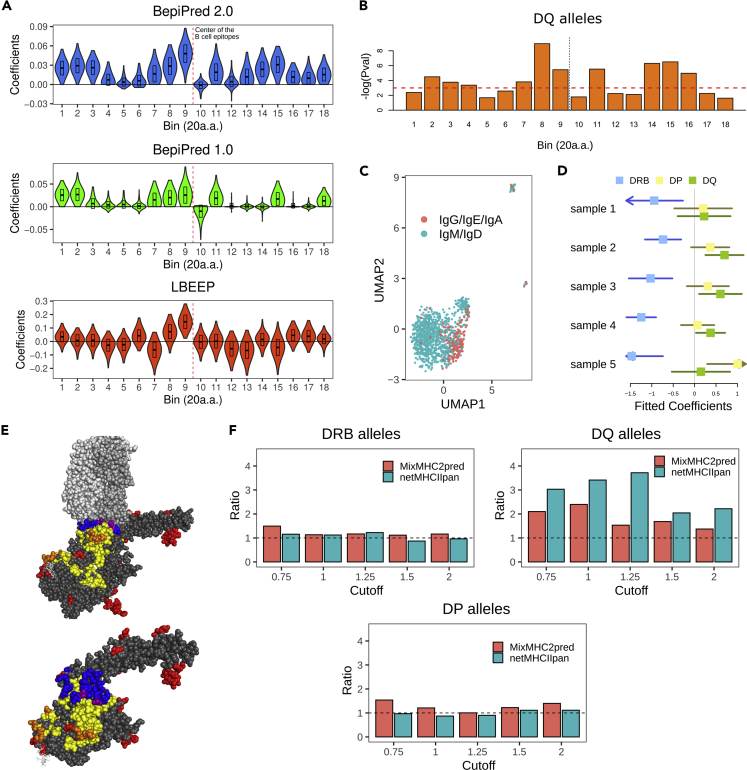
The ability to predict B cell epitopes is critical for biomedical research and many clinical applications. Investigators have observed the phenomenon of T-B reciprocity, in which candidate B cell epitopes with nearby CD4+ T cell epitopes have higher chances of being immunogenic. To our knowledge, existing B cell epitope prediction algorithms have not considered this interesting observation. We developed a linear B cell epitope prediction model, BepiTBR, based on T-B reciprocity. We showed that explicitly including the enrichment of putative CD4+ T cell epitopes (predicted HLA class II epitopes) in the model leads to significant enhancement in the prediction of linear B cell epitopes. Curiously, the positive impact on B cell epitope generation is specific to the enrichment of DQ allele binders. Overall, our work provides interesting mechanistic insights into the generation of B cell epitopes and points to a new avenue to improve B cell epitope prediction for the field.

Keywords: Bioinformatics; Immunology; Systems biology.


Conflict of interest statement

The authors declare no competing interests.

Figures

None
Graphical abstract
Figure 1
Figure 1
The rationale of the proposed model (A) The process of B cell maturation involves help from CD4+ T cells, which results in selective peptide loading of the MHC II complex. (B) Cartoon of the format of the input data that are utilized by the BepiTBR model. The candidate B cell epitope is shown in blue. A window centering around each B cell epitope is examined in the antigen protein sequence and divided into bins. The MHC class II DP, DQ, and DRB allele binders are counted in each bin. The B cell epitope confidence score of the base model, the MHC class II binder counts, and their interaction terms form the input data. (C) The process of model training and internal validation. The proposed BepiTBR model has incorporated three different base B cell epitope prediction models (Bepi.) and two different HLA class II epitope (T cell epitope) prediction models (Tepi.). To evaluate the model performance, we tested all possible combinations of base B cell epitope prediction models and HLA class II epitope prediction models, together with different parameters in the model: HLA class II epitope rank cutoff (cutoff), overall penalty strength (lambda), and balance between L1 and L2 penalty (alpha). The internal validation set was used to select the best parameter combination for each base model. The final models were further validated in other independent data, examined for model interpretation, and applied to COVID-19 research.
Figure 2
Figure 2
Prediction performance evaluation of the BepiTBR model (A) A heatmap showing the AUCs in the validation dataset with the BepiPred1.0 B cell epitope prediction software and netMHCIIpan HLA class II epitope prediction software as the base models, at a rank percentile cutoff of 1. The parameter lambdas are shown on the X axis, and the parameter alphas are shown on the Y axis. (B) A heatmap showing the AUCs in the validation dataset without using any base B cell epitope prediction model. In this model, only the HLA class II epitope prediction scores estimated by the netMHCIIpan software were incorporated in the model. (C) A curve showing the best AUCs of all combinations of Tepi., lambdas, and alphas at each percentile cutoff vs. the cutoffs employed. The BepiTBR, the HLA II-only model (the model trained to predict B cell epitope only includes HLA class II epitope counts), and the base B cell epitope prediction model (LBEEP)’ results are shown together. (D) The same analyses as in (C), but performed with MCC as the benchmark metric. (E) Barplots showing the AUCs of the BepiTBR models (enhanced model), the matching HLA II-only models (matched to the tuning parameters of the corresponding BepiTBR models), and the base B cell epitope prediction models, on the test cohort. The AUC of the ensemble BepiTBR model is also shown in each panel. (F and G) The AUC of ROC plots for BepiTBR (ensemble) and for BepiPred 1.0. (H) Pearson correlation between the similarity in B cell epitopes of any pair of Env proteins and the similarity in Libra-seq scores for the same pair of Env proteins across all sampled B cells. There are a total of five different Env proteins, and therefore, 10 possible pairs. Either all candidate B cell epitopes without any confidence score filtering or B cell epitopes with confidence scores larger than a cutoff are included. See also Figures S1 and S2, and Table S1
Figure 3
Figure 3
BepiTBR reveals insight into the generation of B cell epitopes (A) The Elastic-Net model coefficients, for DQ alleles, of the BepiTBR (BepiPred 2.0), BepiTBR (BepiPred 1.0), and BepiTBR (LBEEP) models. 1–18 represents the 18 bins covering (−180 a.a., 180 a.a.) in 20 a.a. intervals. 200 bootstraps were performed to derive the distributions of coefficients. (B) Negative log p values of the Mann-Whitney U tests investigating whether the true B cell epitopes have different counts of DQ allele binders in each of the 18 bins, compared with the negative cases. Positive direction: true B cell epitopes have higher counts of binders; Negative direction: true B cell epitopes have lower counts of binders. (C) UMAP plot of single B cell scRNA-seq data showing the clustering of B cells by their class switching status. The vdj_v1_hs_pbmc dataset was shown as an example. (D) Multivariate logistic regression of the expression of DP, DQ, and DRB alleles in each B cell against the status of class switching. Forest plots were used to display the fitted coefficients and their CIs. Samples one to five are sc5p_v2_hs_PBMC, vdj_nextgem_hs_pbmc3, vdj_v1_hs_pbmc2, vdj_v1_hs_pbmc, and vdj_v1_hs_pbmc3, respectively. (E) The 3D structure of 3N85 from PDB, showing the antigen (bottom dark gray), antibody (top light gray), the curated conformational B cell epitopes (purple), the predicted conformational B cell epitopes by discotope (red), and the predicted HLA class II epitopes by MixMHC2pred (yellow). Blue color refers to the overlap between the curated B cell epitopes and HLA class II epitopes. Orange color refers to the overlap between HLA class II epitopes and the predicted B cell epitopes. Close-up image of the same 3 d structure, with the antibody removed, is also shown. (F) Barplots showing the ratios of the number of curated conformational B cell epitope residues that are closer to predicted HLA class II epitopes on the same antigen proteins divided by the number of B cell epitope residues that are closer to epitopes not predicted to bind HLA class II proteins. The distances to HLA class II epitopes are averaged for each B cell epitope residue and the same is done for non-binding epitopes. All B cell epitopes of all structures available from PDB are aggregated. See also Tables S2, S3, and S4; Figures S3, S4, S5, S6, and S7.
Figure 4
Figure 4
BepiTBR predicts B cell immunogenicity loss in SARS-CoV-2 (A) Variants detected in the SARS-CoV-2 strains, compared to the reference genome MN908947. Y axis shows the proportion of viral strains with a particular mutation. Mutations with relatively high abundances in the analyzed sequences are labeled. In the S protein region, “∗” indicates mutations associated with (B)1.1.7 (Alpha/UK variant),“+” denotes mutations present in (B)1.351 (Beta/South African variant), and “-” denotes mutations present in (B)1.617.2 (Delta/Indian variant). (B) The B cell epitope confidence scores by the BepiTBR model for each epitope of each SARS-CoV-2 viral protein. The cutoff of 0 is shown by the yellow line and the cutoff of 0.75 is shown by the red line. (C) The number of predicted B cell epitopes of all viral proteins of all SARS-CoV-2 strains. The red line shows the number for the reference strain. Cutoff = 0. (D) The number of predicted B cell epitopes of all viral proteins of all SARS-CoV-2 strains, broken down into the months by which they were first discovered. Cutoff = 0.75. (E) The same analyses as in (D), but for cutoff = 0. (F) The change in the number of predicted B cell epitopes of each viral protein of all SARS-CoV-2 strains, with respect to those of the reference genome, normalized by protein lengths. Counts for the Spike RBD are normalized by the length of the S RBD. Cutoff = 0. (G) For the Wang et al. and Wu et al. studies, we investigated the B cell epitopes that were lost in the mutated S protein sequences compared to the reference S sequence. We calculated the average B cell immunogenicity confidence score, by BepiTBR (left) and by BepiPred 2.0 (right), for the lost B cell epitopes in each mutated S protein sequence. See also Table S4; Figures S8, S9, S10, and S11.

References

    1. Barroso M., Tucker H., Drake L., Nichol K., Drake J.R. Antigen-B cell receptor complexes associate with intracellular major histocompatibility complex (MHC) class II molecules. J. Biol. Chem. 2015;290:27101–27112. - PMC - PubMed
    1. Benjamin D.C., Berzofsky J.A., East I.J., Gurd F.R., Hannum C., Leach S.J., Margoliash E., Michael J.G., Miller A., Prager E.M. The antigenic structure of proteins: a reappraisal. Annu. Rev. Immunol. 1984;2:67–101. - PubMed
    1. Berzofsky J.A. T-B reciprocity. An Ia-restricted epitope-specific circuit regulating T cell-B cell interaction and antibody specificity. Surv. Immunol. Res. 1983;2:223–229. - PubMed
    1. Berzofsky J.A., Buckenmeyer G.K., Hicks G., Gurd F.R., Feldmann R.J., Minna J. Topographic antigenic determinants recognized by monoclonal antibodies to sperm whale myoglobin. J. Biol. Chem. 1982;257:3189–3198. - PubMed
    1. Brumeanu T.D., Casares S., Bot A., Bot S., Bona C.A. Immunogenicity of a contiguous T-B synthetic epitope of the A/PR/8/34 influenza virus. J. Virol. 1997;71:5473–5480. - PMC - PubMed