. 2021 Nov 2;3(1):362-372.
doi: 10.1039/d1ma00708d. eCollection 2022 Jan 4.

Polymer-templated mesoporous lithium titanate microspheres for high-performance lithium batteries

Affiliations

Polymer-templated mesoporous lithium titanate microspheres for high-performance lithium batteries

Minh Tri Nguyen et al. Mater Adv. .

Abstract

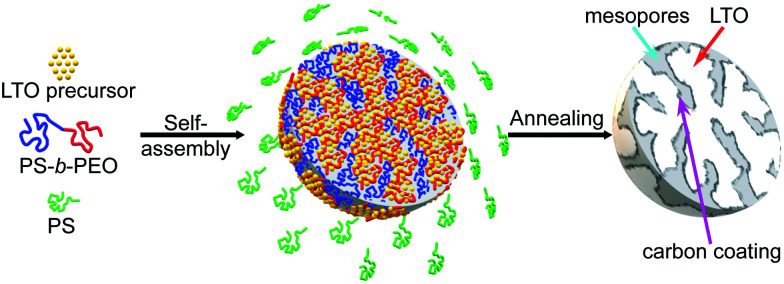
The spinel Li4Ti5O12 (LTO) is a promising lithium ion battery anode material with the potential to supplement graphite as an industry standard, but its low electrical conductivity and Li-ion diffusivity need to be overcome. Here, mesoporous LTO microspheres with carbon-coatings were formed by phase separation of a homopolymer from microphase-separated block copolymers of varying molar masses containing sol-gel precursors. Upon heating the composite underwent a sol-gel condensation reaction followed by the eventual pyrolysis of the polymer templates. The optimised mesoporous LTO microspheres demonstrated an excellent electrochemical performance with an excellent specific discharge capacity of 164 mA h g-1, 95% of which was retained after 1000 cycles at a C-rate of 10.


Conflict of interest statement

There are no conflicts to declare.

Figures

Fig. 1
Fig. 1. Schematic of the polymer-templated fabrication of carbon-coated mesoporous LTO microspheres. Initially, LTO precursors, PS-b-PEO block copolymers (BCPs) and PS homopolymer are mixed in a common solvent. Upon solvent evaporation, the BCP and the PS homopolymer phase separate into BCP spheres, in which the BCP blocks coassemble into a nanostructured morphology with the LTO precursor molecules preferentially residing in the PEO domains. Annealing this blend in an argon atmosphere causes confined crystallisation of the LTO while the polymer template is burnt away and partially carbonised, thereby creating LTO microspheres with carbon-coated mesopores.
Fig. 2
Fig. 2. XRD patterns of the mesoporous LTO microspheres listed in Tables 1 and 2, (a) LTO-A, (b) LTO-B and (c) LTO-C. The symbols show the experimental data and the lines are fitted Rietveld refinements. The vertical bars indicate the tabulated peak positions for spinel LTO, below which the differences between experimental data and fits are plotted. In (c) the peaks expected for a spinel structure (space group: Fdm) are indexed with the (hkl) values of the corresponding lattice planes.
Fig. 3
Fig. 3. Raman spectra of the mesoporous LTO microspheres. (a) LTO-A-600, (b) LTO-A-700, (c) LTO-B-600, (d) LTO-B-700, and (e) LTO-C-700.
Fig. 4
Fig. 4. Low to high magnification SEM images (left to right columns) of mesoporous LTO-A-600 (a), LTO-A-700 (b), LTO-B-600 (c), LTO-B-700 (d), and LTO-C-700 (e) showing the predominance of LTO spheres exhibiting mesoporosity. Left column scale bar: 20 μm, centre column scale bar: 2 μm, right column scale bar: 100 nm.
Fig. 5
Fig. 5. (a) Nitrogen physisorption isotherms of the mesoporous LTO microspheres at 77 K. (b) Pore size distribution as determined from the adsorption branch using the BJH method, where the derivative pore volume normalised to the natural logarithm of pore-width interval, dV/d log(W), is shown as a function of the pore width.
Fig. 6
Fig. 6. First four galvanostatic discharge and charge profiles of mesoporous LTO-A-600 (a), LTO-A-700 (b), LTO-B-600 (c), LTO-B-700 (d) and LTO-C-700 (e), C-rate of 0.5.
Fig. 7
Fig. 7. Initial galvanostatic discharge/charge profiles at different C-rates for the mesoporous LTO-A-600 (a), LTO-A-700 (b), LTO-B-600 (c), LTO-B-700 (d) and LTO-C-700 (e).
Fig. 8
Fig. 8. Rate test (a) and cycle test (b) of mesoporous LTO microsphere composite electodes. Cycle testing at a C-rate of 10. Percentages indicate capacity retention during cycle testing. The measurements of each sample in (a) and (b) were carried out with the same cells.
Fig. 9
Fig. 9. Peak current ipvs. scan rate ν1/2 of the five mesoporous LTO microsphere samples, (a) post-assembly, (b) post-rate test, and (c) post-cycle test. The slopes in the positive peak current region correspond to the anodic processes, the slopes in the negative peak current region correspond to the cathodic processes.
Fig. 10
Fig. 10. Nyquist plots of Li-metal/LTO half-cells, before the rate test (a), and after the cycle test (b). The equivalent circuit (c) with R1 the apparatus resistance and two RQ elements, the Li- metal/electrolyte and electrolyte/LTO interfaces. Q4 accounts for Li–ion diffusion at low frequencies.

References

    1. Zubi G. Dufo-Lopez R. Carvalho M. Pasaoglu G. Renewable Sustainable Energy Rev. 2018;89:292–308. doi: 10.1016/j.rser.2018.03.002. - DOI
    1. Li M. Lu J. Chen Z. Amine K. Adv. Mater. 2018;30:1800561. doi: 10.1002/adma.201800561. - DOI - PubMed
    1. Reddy M. V. Subba Rao G. V. Chowdari B. V. R. Chem. Rev. 2013;113:5364–5457. doi: 10.1021/cr3001884. - DOI - PubMed
    1. Ding Y. Cano Z. P. Yu A. Lu J. Chen Z. Electrochem. Energy Rev. 2019;2:1–28. doi: 10.1007/s41918-018-0022-z. - DOI
    1. Zhu G.-N. Wang Y.-G. Xia Y.-Y. Energy Environ. Sci. 2012;5:6652–6667. doi: 10.1039/C2EE03410G. - DOI

LinkOut - more resources