. 2022 Mar;62(3):570-583.
doi: 10.1111/trf.16819. Epub 2022 Feb 12.

Antibody profiles in COVID-19 convalescent plasma prepared with amotosalen/UVA pathogen reduction treatment

Affiliations

Antibody profiles in COVID-19 convalescent plasma prepared with amotosalen/UVA pathogen reduction treatment

Anil Bagri et al. Transfusion. 2022 Mar.

Abstract

Background: COVID-19 convalescent plasma (CCP), from donors recovered from severe acute respiratory syndrome coronavirus-2 (SARS-CoV-2) infection, is one of the limited therapeutic options currently available for the treatment of critically ill patients with COVID-19. There is growing evidence that CCP may reduce viral loads and disease severity; and reduce mortality. However, concerns about the risk of transfusion-transmitted infections (TTI) and other complications associated with transfusion of plasma, remain. Amotosalen/UVA pathogen reduction treatment (A/UVA-PRT) of plasma offers a mitigation of TTI risk, and when combined with pooling has the potential to increase the diversity of the polyclonal SARS-CoV-2 neutralizing antibodies.

Study design and methods: This study assessed the impact of A/UVA-PRT on SARS-CoV-2 antibodies in 42 CCP using multiple complimentary assays including antigen binding, neutralizing, and epitope microarrays. Other mediators of CCP efficacy were also assessed.

Results: A/UVA-PRT did not negatively impact antibodies to SARS-CoV-2 and other viral epitopes, had no impact on neutralizing activity or other potential mediators of CCP efficacy. Finally, immune cross-reactivity with other coronavirus antigens was observed raising the potential for neutralizing activity against other emergent coronaviruses.

Conclusion: The findings of this study support the selection of effective CCP combined with the use of A/UVA-PRT in the production of CCP for patients with COVID-19.

Keywords: FFP transfusion; plasma derivatives; transfusion-transmitted disease-other.


Conflict of interest statement

AB, MVG, MG, and LMC are employees and shareholders of Cerus Corporation which markets the INTERCEPT Blood System. CTT, PVR, and DS are employees of ENable Biosciences which markets ADAP assay for SARS‐CoV‐2 detection. PLF is a shareholder in Antigen Discovery Inc. and Nano immune Inc. RRDA, GS, ZWM, MS, CDG, RM, OD, JR, DW, AZ, SK, and MPB have disclosed no conflicts of interest.

Figures
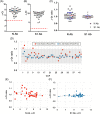
FIGURE 1
FIGURE 1
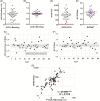
Amotosalen/UVA light pathogen inactivation treatment (PRT) does not impact SARS‐CoV‐2 antibody binding using the highly sensitive ADAP assay. (A) Distribution of Δ‐Ct measurements for antibodies binding to the nucleocapsid (N) protein. The cut‐off of positivity is depicted with the dashed red line. (B) Distribution of Δ‐Ct measurements for antibodies binding to the Spike 1 (S1) protein. The cut‐off of positivity is depicted with the dashed red line. (C) The distribution, average (red line) and SEM (blue error bars) of ratio of antibody Post‐PRT to Pre‐PRT Δ‐Ct (Δ‐Ct ratio) for the N and the S1 proteins. (D) Δ‐Ct ratio for individual COVID‐19 convalescent plasma antibodies for N (red) and the S1 (blue) ADAP assay. Ideal ratio of 1 is highlighted with a dotted red line, and the 10% change is delineated by gray shading. (E) Δ‐Ct ratio for the N protein antibody as a function of N protein Δ‐Ct. The linear trend line depicts that the ratios have a minimal change over the dynamic range of the assay. (F) Δ‐Ct ratio for the antibody to Spike (S1) protein as a function of antibody level to S1 protein Δ‐Ct. The linear trend line depicts that the ratios have a minimal change over the dynamic range of the assay. ADAP, Antibody dependent agglutination PCR; PRT, pathogen reduction treatment; SARS‐CoV‐2, severe acute respiratory syndrome coronavirus‐2 [Color figure can be viewed at wileyonlinelibrary.com]
FIGURE 2
FIGURE 2
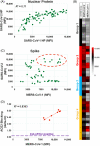
Amotosalen/UVA light pathogen reduction treatment (PRT) does not impact antibodies to a broad range of viral antigens. (A) Heatmap for viral antigen microarray. The heatmap shows mean fluorescence intensity across four replicates, for IgG against each antigen organized into rows color coded by viral class (right side), for sera organized into columns of paired Pre‐PRT (green) and Post‐PRT (blue) COVID‐19 convalescent plasma (CCP) samples. (B) Principal component analysis showing the spatial distribution of the pre‐PRT samples for all donors along the first and second principal components. Samples were grouped into four populations: non‐reactive (G1—Black); broadly reactive (G2—Red); primarily N protein reactive (G3—Blue—samples that are highly reactive to N protein but lower reactive to the other antigens) and; Primarily spike reactive (G4—Yellow—samples that are reactive to spike but with low reactivity to N protein). (C) The average ratio of Post‐PRT to Pre‐PRT mean fluorescent intensity (MFI) (MFI ratio) for IgG, IgM and IgA binding to epitopes from SARS‐CoV‐2, severe acute respiratory syndrome coronavirus‐2 (SARS‐CoV‐2), other coronaviruses, Influenza, other common respiratory viruses and all epitopes on the viral antigen microarray. Error bars represent SEM. (D) MFI ratio for IgG binding to SARS‐CoV‐2 epitopes on the viral antigen microarray as a function of signal strength (Normalized MFI). The linear trend line red dashed line demonstrates that the ratios have a minimal change over the dynamic range of the assays [Color figure can be viewed at wileyonlinelibrary.com]
FIGURE 3
FIGURE 3
Amotosalen/UVA light PRT does not broadly impact antibodies in a given CCP sample. (A) Scatter plots of all IgG Pre‐PRT to Post‐PRT normalized MFI data above the threshold of positivity for a given CCP for a representative donor from Group 2, 3 and 4. Best fit line is shown in blue with the 95% CI highlighted in dark gray. (B) Scatter plot of R 2 values for IgG, IgM and IgA for each individual CCP with mean and SEM delineated. (C) Principal component analysis depicting that PRT does not impact CCP cluster designation for Group 2, 3 or 4. CCP, COVID‐19 convalescent plasma; MFI, mean fluorescent intensity; PRT, pathogen reduction treatment [Color figure can be viewed at wileyonlinelibrary.com]
FIGURE 4
FIGURE 4
Amotosalen/UVA light pathogen inactivation treatment (PRT) does not impact SARS‐CoV‐2 neutralizing activity. (A) Distribution of ACE‐2 Blocking Δ‐Ct. The assay cut‐off of positivity is depicted with the dashed red line. (B) The distribution, average (red line) and SEM (blue error bars) of ratio of Post‐PRT to Pre‐PRT ACE‐2 Blocking Δ‐Ct. (C) ACE‐2 blocking Δ‐Ct Ratio for individual CCP for ACE‐2 blocking ADAP assay. Ideal ratio of 1 is highlighted with a dotted red line, and the 10% change is delineated by gray shading. (D) Distribution of RVPN NT50. The assay cut‐off of positivity is depicted with the dashed red line. (E) The distribution, average (red line) and SEM (blue error bars) of ratio of Post‐PRT to Pre‐PRT RVPN NT50. (F) Ratio of Post‐PRT to Pre‐PRT NT50 (NT50 ratio) values for individual donors in the RVPN neutralization assay. Ideal ratio of 1 is highlighted with a dotted red line, and the 10% change is delineated by gray shading. (G) Scatter plot depicting correlation of RVPN NT50 with ACE‐2 Blocking Δ‐Ct. ADAP, Antibody dependent agglutination PCR; CCP, COVID‐19 convalescent plasma; PRT, pathogen reduction treatment; SARS‐CoV‐2, severe acute respiratory syndrome coronavirus‐2 [Color figure can be viewed at wileyonlinelibrary.com]
FIGURE 5
FIGURE 5
Amotosalen/UVA light pathogen inactivation treatment (PRT) treatment impacts pro‐inflammatory cytokines but does not impact vascular protective factors. (A) The distribution, average (red line) and SEM (blue error bars) of ratio of Post‐PRT to Pre‐PRT Fibrinogen levels. (B) The distribution, average (red line) and SEM (blue error bars) of ratio of Post‐PRT to Pre‐PRT VEGF levels. (C) Graph of MIP‐1β (pg/ml) for paired Pre‐PRT (red squares) and Post‐PRT (black circles) samples. The LLoQ for MIP‐1β assay is delineated as a blue line (p < .001). (D) Scatter plot of the percent reduction of MIP‐1β levels Post‐PRT compared to Pre‐PRT. Donors for which levels were reduced to LLoQ are highlighted in red. (E) Graph of MCP‐1 (pg/ml) for paired Pre‐PRT (red squares) and Post‐PRT (black circles) samples. The LLoQ for MCP‐1 assay is delineated as a blue line (p < .001). (F) Scatter plot of the percent reduction of MCP‐1 levels Post‐PRT compared to Pre‐PRT. Donors for which levels were reduced to LLoQ are highlighted in red. (G) Graph of Interleukin‐1 (Il‐1)β (pg/ml) for paired Pre‐PRT (red squares) and Post‐PRT (black circles) samples. The LLoQ for Il‐1β assay is delineated as a blue line (p = .014). (H) Scatter plot of the percent reduction of Il‐1β levels Post‐PRT compared to Pre‐PRT. Donors for which levels were reduced to LLoQ are highlighted in red. PRT, pathogen reduction treatment; VEGF, vascular endothelial growth factor [Color figure can be viewed at wileyonlinelibrary.com]
FIGURE 6
FIGURE 6
Cross‐reactivity between SARS‐CoV‐2 and related coronaviruses suggests the potential for CCP to provide protection against other coronaviruses. (A) Correlation between SARS‐CoV‐2 and SARS‐CoV Nuclear protein reactivity in the viral antigen microarray. Logarithmic trendline with R 2 value of 0.71 is depicted with a dashed line. (B) Heatmap of COVAM MFI for SARS‐CoV‐2 Spike protein (middle column) and MERS‐CoV‐1 Spike protein (left column) reactivity of CCP re‐organized into the 4 COVAM reactivity clusters (right column: group 1—black; group 2—red; group 3—blue; group 4—yellow). (C) Correlation between SARS‐CoV‐2 and MERS‐CoV Spike protein reactivity in the viral antigen microarray. A population of donors with high SARS‐CoV‐2 and MERS‐CoV reactivity and highlighted in the red dashed oval. (D) Correlation of ACE‐2 Blocking in the ADAP assay with MERS‐CoV spike protein reactivity in the viral antigen microarray for the subpopulation of donors with high SARS‐CoV‐2 and MERS‐CoV Spike protein reactivity highlighted in (B). Linear trend line with R‐squared value of 0.84 shown. The cut‐off for positive ACE‐2 blocking ADAP assay is also depicted. ADAP, Antibody dependent agglutination PCR; CCP, COVID‐19 convalescent plasma; COVAM, coronavirus antigen microarray; MERS, Middle East Respiratory Syndrome; MFI, mean fluorescent intensity; PRT, pathogen reduction treatment; SARS‐CoV‐2, severe acute respiratory syndrome coronavirus‐2 [Color figure can be viewed at wileyonlinelibrary.com]

Comment in

References

    1. Yang W, Cao Q, Qin L, Wang X, Cheng Z, Pan A, et al. Clinical characteristics and imaging manifestations of the 2019 novel coronavirus disease (COVID‐19): a multi‐center study in Wenzhou city, Zhejiang, China. J Infect. 2020;80(4):388–93. - PMC - PubMed
    1. Guan WJ, Ni ZY, Hu Y, Liang WH, Ou CQ, He JX, et al. Clinical characteristics of coronavirus disease 2019 in China. N Engl J Med. 2020;382(18):1708–20. - PMC - PubMed
    1. Jean SS, Lee PI, Hsueh PR. Treatment options for COVID‐19: the reality and challenges. J Microbiol Immunol Infect. 2020;53(3):436–43. - PMC - PubMed
    1. Bloch EM, Shoham S, Casadevall A, Sachais BS, Shaz B, Winters JL, et al. Deployment of convalescent plasma for the prevention and treatment of COVID‐19. J Clin Invest. 2020;130(6):2757–65. - PMC - PubMed
    1. Enria DA, Briggiler AM, Sanchez Z. Treatment of argentine hemorrhagic fever. Antiviral Res. 2008;78(1):132–9. - PMC - PubMed