Source-anchored, trace-anchored, and general match score-based likelihood ratios for camera device identification
- PMID: 35128659
- PMCID: PMC9302670
- DOI: 10.1111/1556-4029.14991
Source-anchored, trace-anchored, and general match score-based likelihood ratios for camera device identification
Abstract
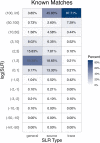
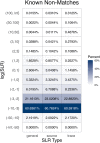
Forensic camera device identification addresses the scenario, where an investigator has two pieces of evidence: a digital image from an unknown camera involved in a crime, such as child pornography, and a person of interest's (POI's) camera. The investigator wants to determine whether the image was taken by the POI's camera. Small manufacturing imperfections in the photodiode cause slight variations among pixels in the camera sensor array. These spatial variations, called photo-response non-uniformity (PRNU), provide an identifying characteristic, or fingerprint, of the camera. Most work in camera device identification leverages the PRNU of the questioned image and the POI's camera to make a yes-or-no decision. As in other areas of forensics, there is a need to introduce statistical and probabilistic methods that quantify the strength of evidence in favor of the decision. Score-based likelihood ratios (SLRs) have been proposed in the forensics community to do just that. Several types of SLRs have been studied individually for camera device identification. We introduce a framework for calculating and comparing the performance of three types of SLRs - source-anchored, trace-anchored, and general match. We employ PRNU estimates as camera fingerprints and use correlation distance as a similarity score. Three types of SLRs are calculated for 48 camera devices from four image databases: ALASKA; BOSSbase; Dresden; and StegoAppDB. Experiments show that the trace-anchored SLRs perform the best of these three SLR types on the dataset and the general match SLRs perform the worst.
Keywords: digital cameras; digital evidence; digital images; forensic camera identification; score-based likelihood ratios and SLR.
© 2022 The Authors. Journal of Forensic Sciences published by Wiley Periodicals LLC on behalf of American Academy of Forensic Sciences.
Figures


References
-
- National Research Council . Strengthening forensic science in the United States: a path forward. Washington, DC: The National Academies Press; 2009.
-
- Daubert v. Merrell Dow Pharmaceuticals, Inc. 509 U.S. 579; 1993.
-
- Stern HS. Statistical issues in forensic science. Annu Rev Stat Appl. 2017;4:225–44. 10.1146/annurev-statistics-041715-033554 - DOI
-
- Ommen DM, Saunders CP. A problem in forensic science highlighting the differences between the Bayes factor and likelihood ratio. Stat Sci. 2021;36(3):344–59. 10.1214/20-STS805 - DOI
-
- Lukas J, Fridrich J, Goljan M. Determining digital image origin using sensor imperfections. Proceedings SPIE 5685, image and video communications and processing; 2005 Jan 16–20; San Jose, CA. Bellingham, WA: SPIE; 2005. p. 249–60. 10.1117/12.587105 - DOI
MeSH terms
Grants and funding
LinkOut - more resources
Full Text Sources
Other Literature Sources
Medical
Research Materials

