Three-dimensional high-resolution T1 and T2 mapping of whole macaque brain at 9.4 T using magnetic resonance fingerprinting
- PMID: 35129226
- PMCID: PMC8957571
- DOI: 10.1002/mrm.29181
Three-dimensional high-resolution T1 and T2 mapping of whole macaque brain at 9.4 T using magnetic resonance fingerprinting
Abstract
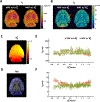
Purpose: Quantitative T1 and T2 mapping in non-human primates with whole-brain coverage is challenged by the requirement of sub-millimeter resolution and the inhomogeneity of the transmit magnetic field (B1+ ) covering a large field of view. The goal of the current study is to develop a magnetic resonance fingerprinting (MRF) method for simultaneous T1 and T2 mapping of the entire macaque brain within feasible scan time.
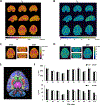
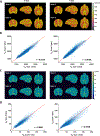
Methods: A three-dimensional (3D) MRF sequence with both inversion- and T2 -preparation modules was developed and evaluated on a 9.4 T preclinical scanner. Data acquisition used a 3D stack-of-spirals trajectory, with undersampling along both the in-plane and the through-plane directions. The effect of B1+ inhomogeneity was accounted for by matching the acquired fingerprint to a dictionary simulated with the B1+ factors measured from a separate scan. In vitro and ex vivo studies were performed to evaluate the accuracy and the undersampling capacity of the MRF method. The application of the MRF method for in vivo, brain-wide T1 and T2 mapping was demonstrated on macaques at 4, 6, and 12 years of age.
Results: The MRF method enabled highly repeatable T1 and T2 mapping at high spatial resolution (0.35 × 0.35 × 1 mm3 ) with an acceleration factor of 24. In vivo studies showed significant age-related T2 reduction in deep gray nuclei including the globus pallidus, the putamen, and the caudate nucleus.
Conclusions: This study demonstrates the first MRF study for brain-wide, multi-parametric quantification in non-human primates with sub-millimeter resolution.
Keywords: 9.4 T; macaque brain; magnetic resonance fingerprinting; quantitative MRI; relaxometry.
© 2022 International Society for Magnetic Resonance in Medicine.
Figures


References
-
- Watanabe T, Frahm J, Michaelis T. In vivo brain MR imaging at subnanoliter resolution: Contrast and histology. Magn Reson Med Sci. 2016;15:11–25. - PubMed
-
- Larsson HBW, Frederiksen J, Petersen J, Nordenbo A, Zeeberg I, Henriksen O, Olesen J. Assessment of demyelination, edema, and gliosis by in vivo determination of T1 and T2 in the brain of patients with acute attack of multiple sclerosis. Magn Reson Med. 1989;11:337–348. - PubMed
-
- Baudrexel S, Nürnberger L, Rüb U, Seifried C, Klein JC, Deller T, Steinmetz H, Deichmann R, Hilker R. Quantitative mapping of T1 and T2 discloses nigral and brainstem pathology in early Parkinson’s disease. Neuroimage [Internet]. 2010;51:512–520. Available from: 10.1016/j.neuroimage.2010.03.005 - DOI - PubMed
-
- Ma D, Jones SE, Deshmane A, Sakaie K, Pierre EY, Larvie M, McGivney D, Blümcke I, Krishnan B, Lowe M, Gulani V, Najm I, Griswold MA, Wang ZI. Development of high-resolution 3D MR fingerprinting for detection and characterization of epileptic lesions. J Magn Reson Imaging. 2019;49:1333–1346. - PubMed
Publication types
MeSH terms
Grants and funding
LinkOut - more resources
Full Text Sources
Medical
Miscellaneous

