. 2022 Jun;42(6):1344-1354.
doi: 10.1111/liv.15192. Epub 2022 Feb 21.

A novel serum metabolomic panel distinguishes IgG4-related sclerosing cholangitis from primary sclerosing cholangitis

Affiliations

A novel serum metabolomic panel distinguishes IgG4-related sclerosing cholangitis from primary sclerosing cholangitis

Daniel E Radford-Smith et al. Liver Int. 2022 Jun.

Abstract

Background & aims: Primary sclerosing cholangitis (PSC) and IgG4-related sclerosing cholangitis (IgG4-SC) are chronic fibro-inflammatory immune-mediated hepatobiliary conditions that are challenging to distinguish in a clinical setting. Accurate non-invasive biomarkers for discriminating PSC and IgG4-SC are important to ensure a correct diagnosis, prompt therapy and adequate cancer surveillance.

Methods: We performed nuclear magnetic resonance (NMR)-based metabolomic profiling using serum samples collected prospectively from patients with PSC (n = 100), IgG4-SC (n = 23) and healthy controls (HC; n = 16).

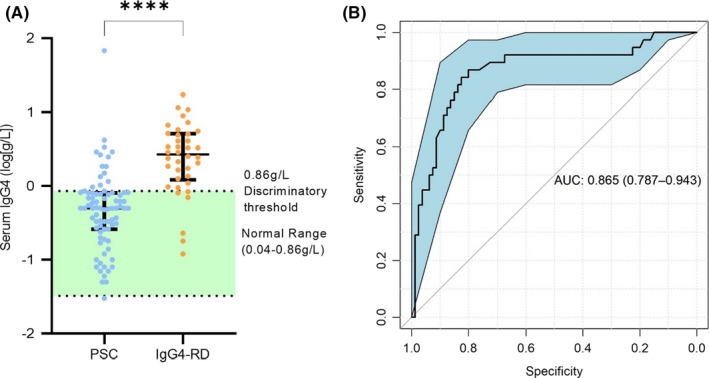
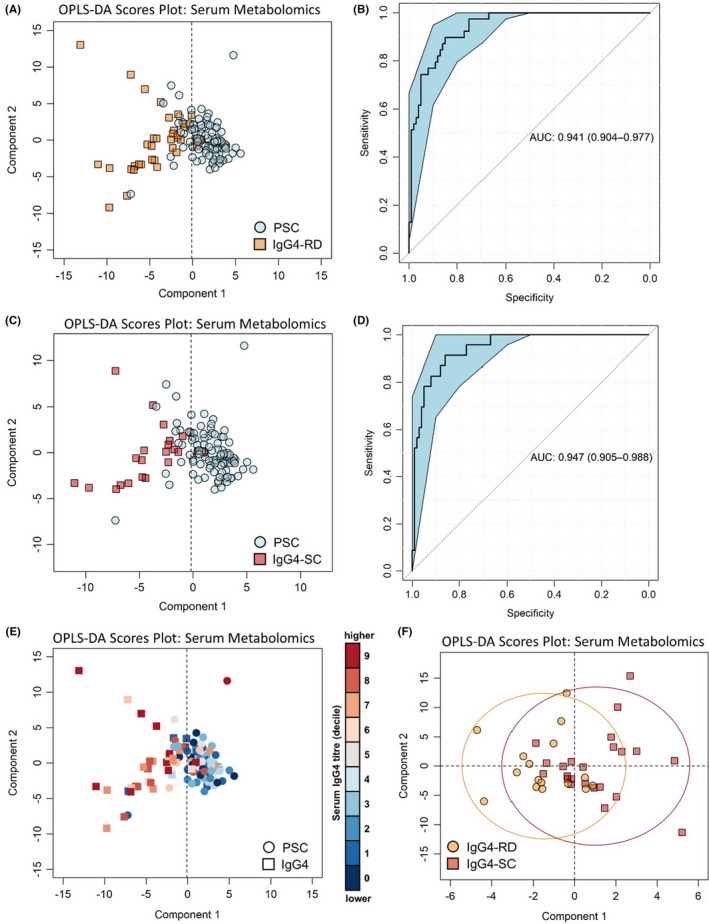
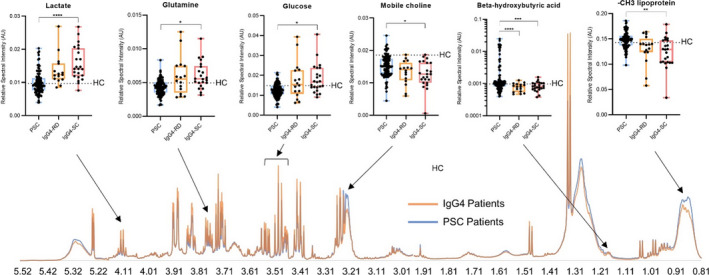
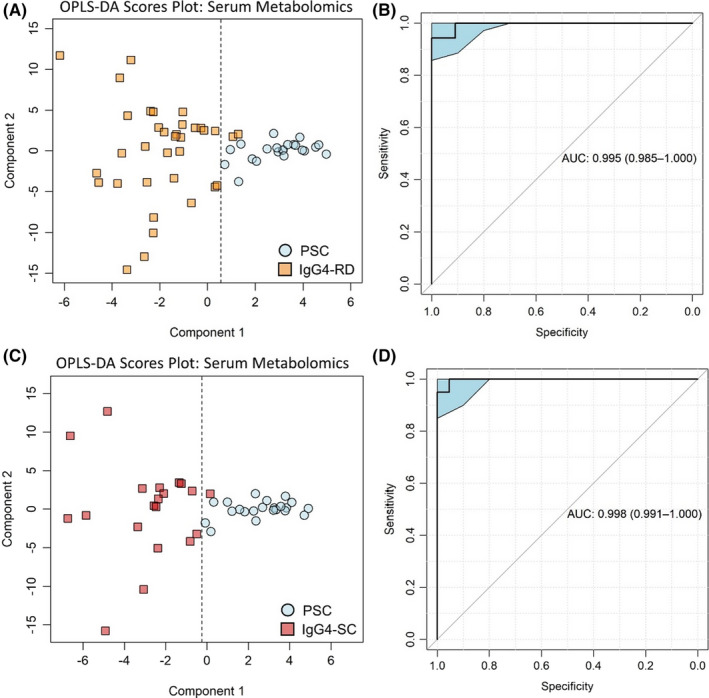
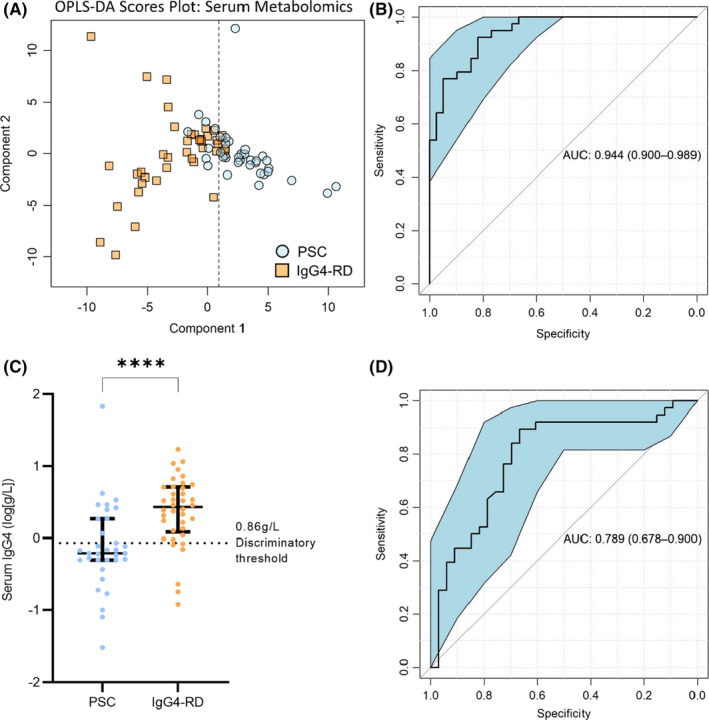
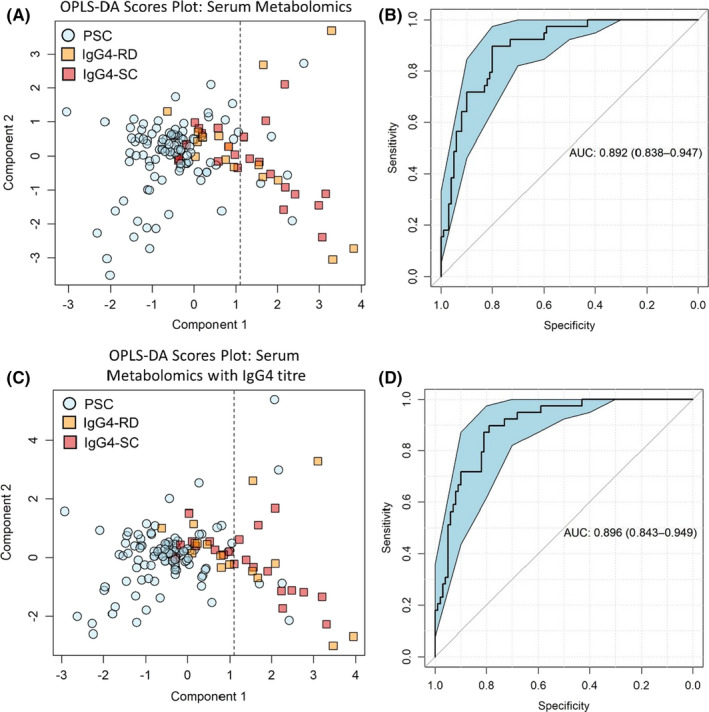
Results: Multivariate analysis of the serum metabolome discriminated PSC from IgG4-SC with greater accuracy (AUC 0.95 [95%CI 0.90-0.98]) than IgG4 titre (AUC 0.87 [95%CI 0.79-0.94]). When inflammatory bowel disease (IBD) was excluded as a comorbid condition (IgG4-SC n = 20, PSC n = 22), the diagnostic AUC increased to 1.0, suggesting that the metabolome differences identified are not a result of the increased prevalence of IBD in PSC relative to IgG4-SC patients. Serum lactate (p < .0001), glucose (p < .01) and glutamine (p < .01) metabolites were increased in IgG4-related disease (IgG4-RD) and IgG4-SC individuals compared to PSC, whereas mobile choline (p < .05), 3-hydroxybutyric acid (p < .01) and -CH3 lipoprotein resonances (p < .01) were decreased.

Conclusions: Taken together, serum metabolomic profiling has the potential to be incorporated as a diagnostic criterion, independent of IgG4 titre, to improve the diagnosis of IgG4-RD and help distinguish IgG4-SC from PSC.

Keywords: biomarkers; cholangitis; diagnosis; immunoglobulin G4-related disease; metabolomics; sclerosing.


Conflict of interest statement

EAS, ELC, DERS, DCA, FP, RP, KDL, MO, JB, KL and AB declare no conflicts of interest. MP is a shareholder in Perspectum, a University of Oxford spin‐out company. AG was employed by UCB Celltech during the preparation of this manuscript and is now an employee of Glaxo Smith Kline (GSK).

Figures

FIGURE 1
FIGURE 1
Serum IgG4 titre discriminates between IgG4‐related disease (IgG4‐RD) and primary sclerosing cholangitis (PSC) with high sensitivity but low specificity. (A) Patients with IgG4‐RD had elevated serum IgG4 titres (Mann Whitney U test, p < .0001). Median ± interquartile range showing all points. While HC serum IgG4 was not measured, the normal range (.04–0.86 g/L) is indicated in green. (B) ROC curve for IgG4 titre classifying PSC vs IgG4‐RD. ROC curves show AUC ± 95% confidence intervals. N = 80 (PSC) and 38 (IgG4‐RD). ****Mann Whitney U test, p < .0001
FIGURE 2
FIGURE 2
Multivariate analysis of serum metabolites discriminates PSC from IgG4‐RD with 86% diagnostic accuracy. PSC vs IgG4‐RD disease (a) OPLS‐DA scores plot and (b) corresponding ROC curve. PSC vs IgG4‐SC (c) OPLS‐DA scores plot and (d) corresponding ROC curve. (e) OPLS‐DA scores plot of PSC vs IgG4 disease coloured by serum IgG4 titre. (f) OPLS‐DA scores plot of IgG4‐RD (excl. IgG4‐SC) vs IgG4‐SC. ROC curves show AUC ± 95% confidence intervals. N = 100 (PSC), 23 (IgG4‐SC), 16 (IgG4‐RD excl. IgG4‐SC)
FIGURE 3
FIGURE 3
Altered metabolite concentrations indicate a molecular signature of IgG4‐RD compared to PSC. NMR spectra showing median intensity of IgG4 (orange) and PSC (blue) individuals, and box plots of key metabolites. Whiskers indicate min/max values showing all datapoints. Welch’s one‐way ANOVA followed by Dunnett’s post hoc comparisons and Bonferroni’s correction for multiple tests: Lactate (p < .0001), glutamine (p < .05) and glucose (p < .05) were higher in IgG4‐SC patients (n = 23) than in PSC patients (n = 100), while ‐CH3 lipoprotein (p < .01), mobile choline (p < .05), and 3‐hydroxybutyric acid (p < .001) were decreased. Similar trends in metabolite concentrations were observed in IgG4‐RD patients (n = 16) for lactate (p = .055), glutamine (p = .084), glucose (p = .12) and ‐CH3 lipoprotein (p = .051), while 3‐hydroxybutyric acid was also significantly decreased (p < .0001). The dotted line in the univariate plots represents the average healthy control value. p‐values < .05, .01, .001 and .0001 are represented by *, **, *** and ****, respectively
FIGURE 4
FIGURE 4
The distinct serum metabolic profiles of PSC and IgG4‐SC are not obscured by the much higher prevalence of comorbid inflammatory bowel disease (IBD) in PSC patients. PSC vs IgG4‐RD (a) OPLS‐DA scores plot and (b) corresponding ROC curve. PSC vs IgG4‐SC (c) OPLS‐DA scores plot and (d) corresponding ROC curve. Models were built using serum metabolomic data only and excluded patients with IBD. ROC curves show AUC ±95% confidence intervals. N = 22 (PSC), 20 (IgG4‐SC), 15 (IgG4‐RD excl. IgG4‐SC)
FIGURE 5
FIGURE 5
Serum metabolomics remains more specific than IgG4 titre when discriminating IgG4‐RD from PSC in age and sex‐matched patient subgroup. (a) Boxplot of serum IgG4 antibodies in IgG4 disease and PSC patients in age and sex‐matched subgroup (Kolmogorov Smirnov, p < .0001). Median ± interquartile range showing all points. (b) ROC curve for IgG4 titre classifying PSC vs IgG4 disease in matched subgroup. (c) Multivariate scores plot of PSC vs IgG4 disease using serum metabolomic data. (d) ROC curve for serum metabolomic data, classifying PSC and IgG4 disease in the matched cohort. ROC curves show AUC ±95% confidence intervals. N = 39 (PSC) and 39 (all IgG4‐RD). ****p‐values < .0001
FIGURE 6
FIGURE 6
A panel of four serum metabolites retains a high discriminatory capacity. Multivariate scores plot of (a) PSC vs IgG4‐RD and (c) PSC vs IgG4‐SC using only spectral peaks pertaining to beta‐hydroxy butyric acid, lactate, mobile choline and glutamine. (b) ROC curve generated from the three metabolites, classifying PSC vs IgG4‐RD and (d) classifying PSC vs IgG4‐SC. ROC curves show AUC ±95% confidence intervals. N = 100 (PSC) and 39 (all IgG4‐RD)

References

    1. Manganis CD, Chapman RW, Culver EL. Review of primary sclerosing cholangitis with increased IgG4 levels. World J Gastroenterol. 2020;26:3126‐3144. doi:10.3748/wjg.v26.i23.3126 - DOI - PMC - PubMed
    1. Culver EL, Chapman RW. IgG4‐related hepatobiliary disease: an overview. Nat Rev Gastroenterol Hepatol. 2016;13:601‐612. doi:10.1038/nrgastro.2016.132 - DOI - PubMed
    1. Culver EL et al. Elevated serum IgG4 levels in diagnosis, treatment response, organ involvement, and relapse in a prospective IgG4‐related disease UK cohort. Am J Gastroenterol. 2016;111:733‐743. doi:10.1038/ajg.2016.40 - DOI - PubMed
    1. Boonstra K et al. Serum immunoglobulin G4 and immunoglobulin G1 for distinguishing immunoglobulin G4‐associated cholangitis from primary sclerosing cholangitis. Hepatology. 2014;59:1954‐1963. doi:10.1002/hep.26977 - DOI - PMC - PubMed
    1. de Buy M, Wenniger LJ, et al. Immunoglobulin G4+ clones identified by next‐generation sequencing dominate the B cell receptor repertoire in immunoglobulin G4 associated cholangitis. Hepatology. 2013;57:2390‐2398. doi:10.1002/hep.26232 - DOI - PubMed

Publication types