Clinical Trial
. 2022 Mar;603(7903):934-941.
doi: 10.1038/s41586-022-04489-4. Epub 2022 Feb 7.

GD2-CAR T cell therapy for H3K27M-mutated diffuse midline gliomas

Affiliations
Clinical Trial

GD2-CAR T cell therapy for H3K27M-mutated diffuse midline gliomas

Robbie G Majzner et al. Nature. 2022 Mar.

Abstract

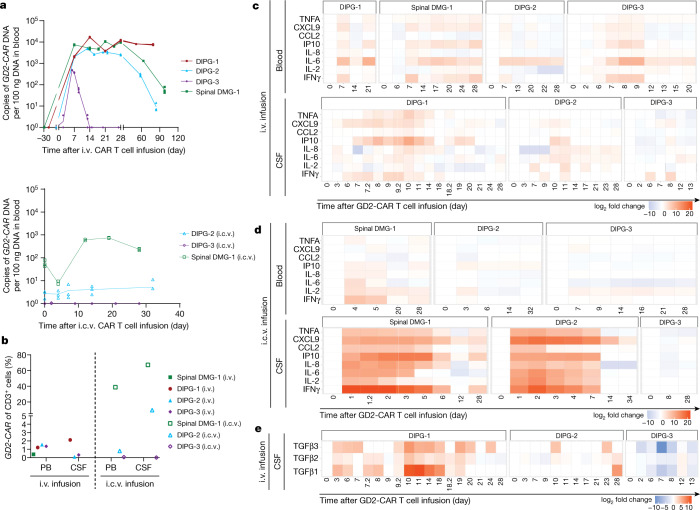
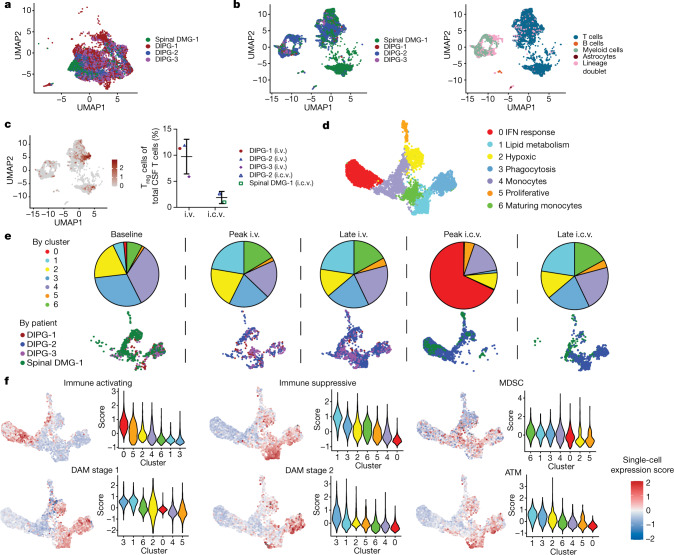
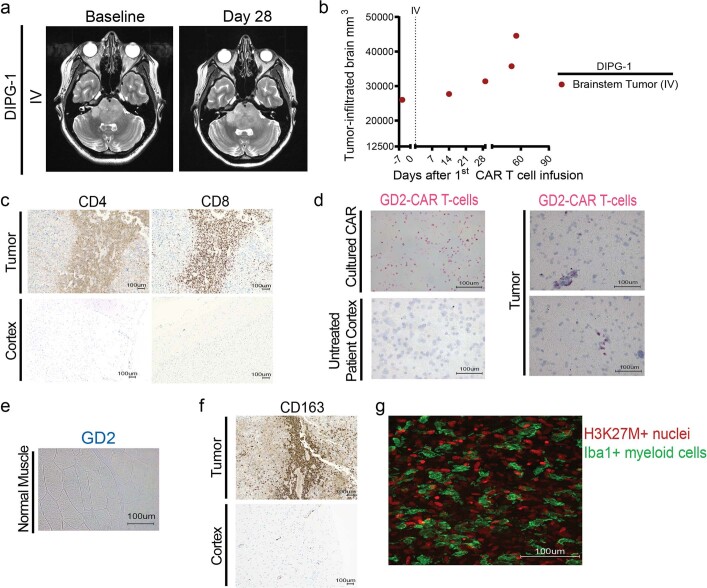
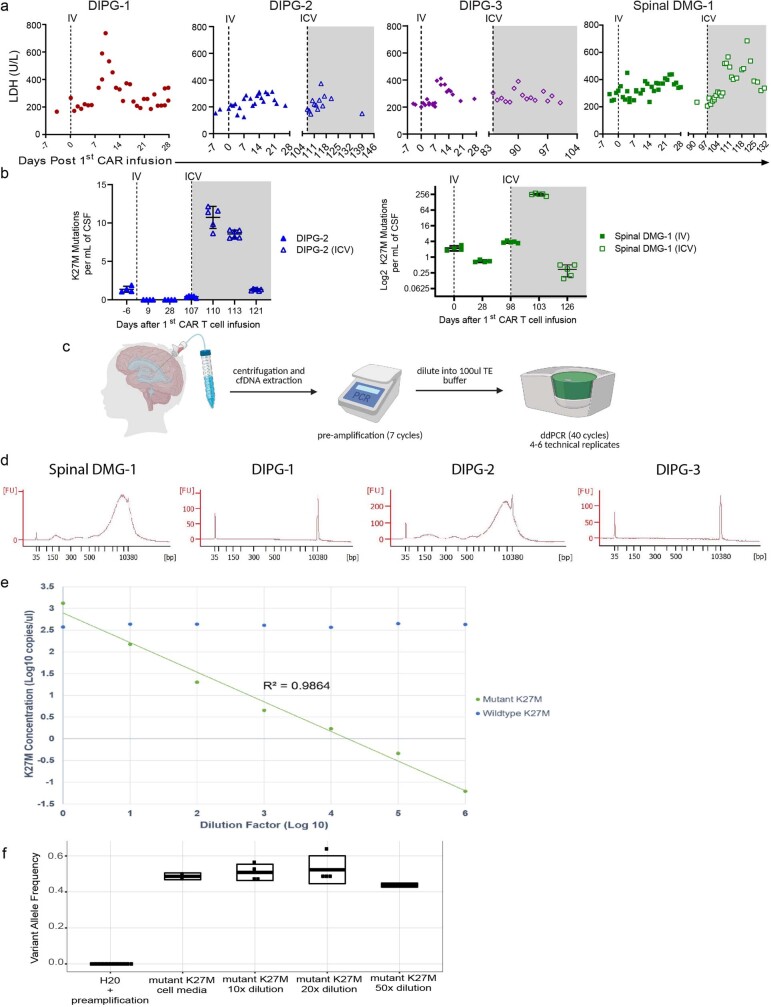
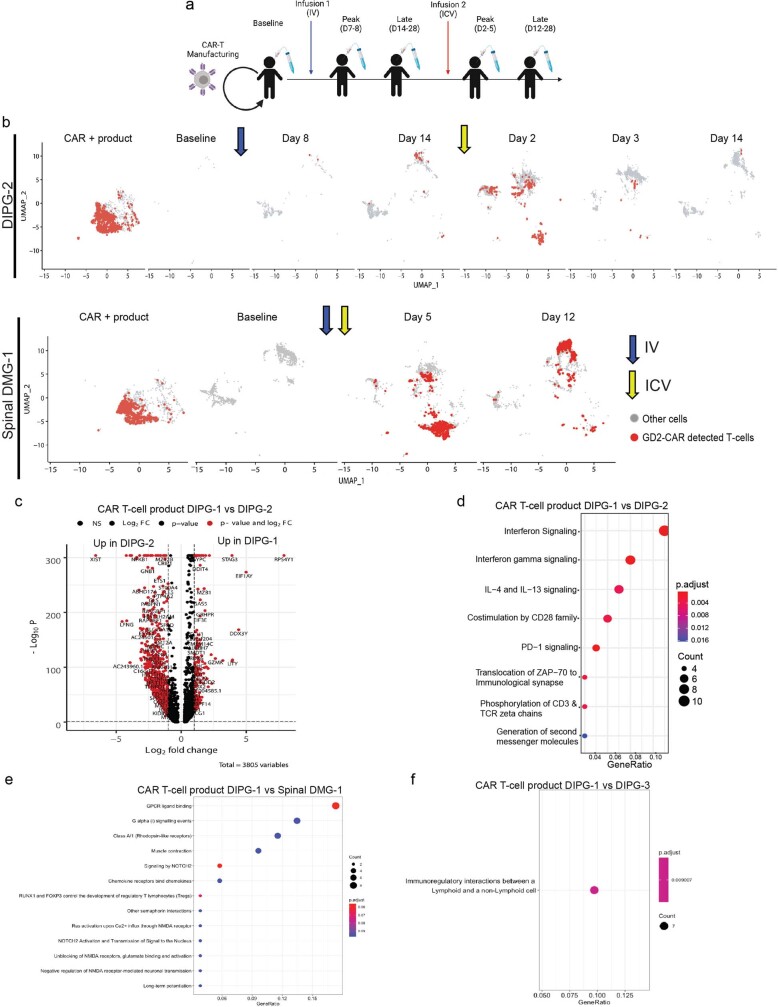
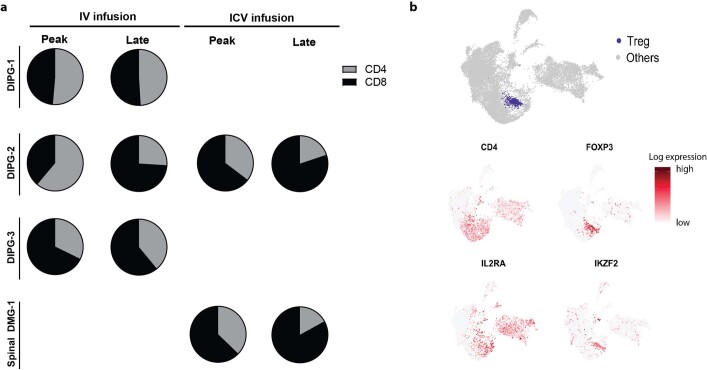
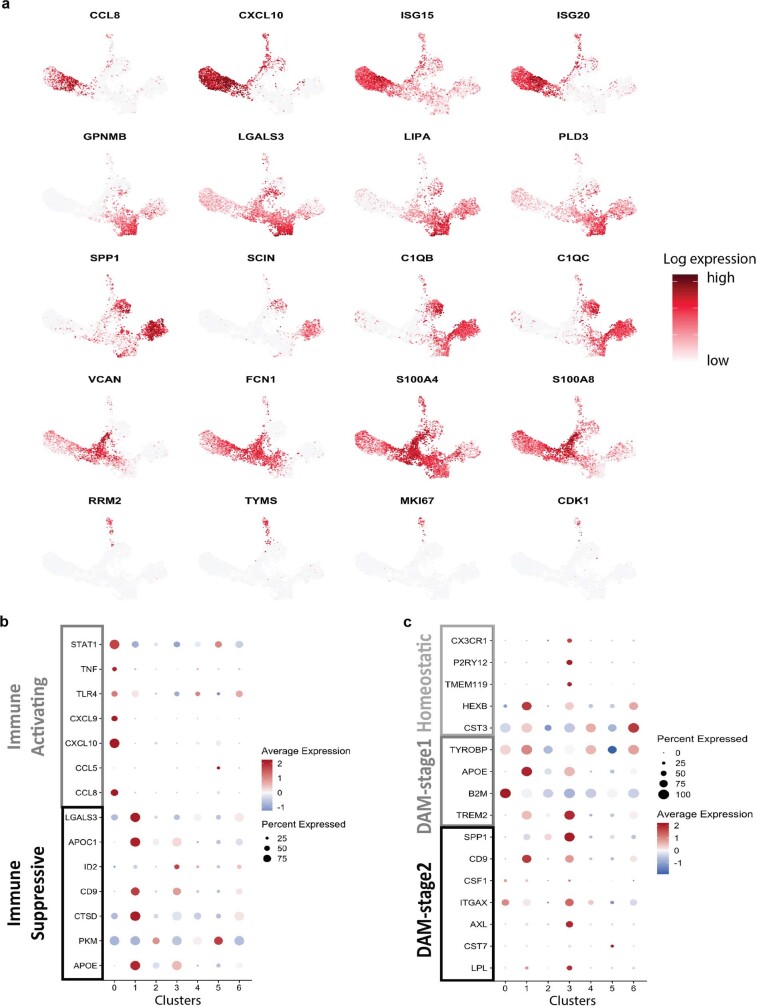
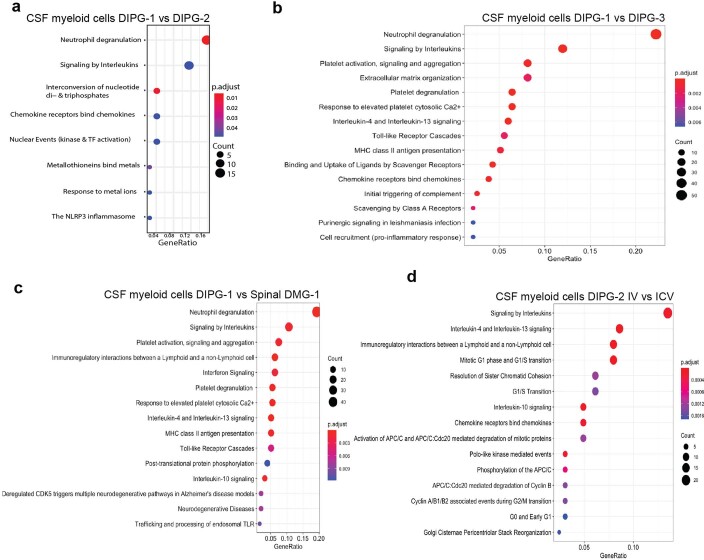
Diffuse intrinsic pontine glioma (DIPG) and other H3K27M-mutated diffuse midline gliomas (DMGs) are universally lethal paediatric tumours of the central nervous system1. We have previously shown that the disialoganglioside GD2 is highly expressed on H3K27M-mutated glioma cells and have demonstrated promising preclinical efficacy of GD2-directed chimeric antigen receptor (CAR) T cells2, providing the rationale for a first-in-human phase I clinical trial (NCT04196413). Because CAR T cell-induced brainstem inflammation can result in obstructive hydrocephalus, increased intracranial pressure and dangerous tissue shifts, neurocritical care precautions were incorporated. Here we present the clinical experience from the first four patients with H3K27M-mutated DIPG or spinal cord DMG treated with GD2-CAR T cells at dose level 1 (1 × 10⁶ GD2-CAR T cells per kg administered intravenously). Patients who exhibited clinical benefit were eligible for subsequent GD2-CAR T cell infusions administered intracerebroventricularly3. Toxicity was largely related to the location of the tumour and was reversible with intensive supportive care. On-target, off-tumour toxicity was not observed. Three of four patients exhibited clinical and radiographic improvement. Pro-inflammatory cytokine levels were increased in the plasma and cerebrospinal fluid. Transcriptomic analyses of 65,598 single cells from CAR T cell products and cerebrospinal fluid elucidate heterogeneity in response between participants and administration routes. These early results underscore the promise of this therapeutic approach for patients with H3K27M-mutated DIPG or spinal cord DMG.


Conflict of interest statement

Stanford University is in the process of applying for a patent application covering treatment of H3K27M-mutated gliomas with GD2-CAR T cells that lists M.M., C.L.M., R.G.M and C.W.M. as inventors. C.L.M. is a cofounder and holds equity in Lyell Immunopharma and Syncopation Life Sciences, which are developing CAR-based therapies, Red Tree Venture Capital, Ensme and Mammoth and consults for Lyell, Syncopation, Red Tree, NeoImmune Tech, Apricity, Nektar, Immatics, Ensoma and Mammoth. R.G.M. is a cofounder of and holds equity in Syncopation Life Sciences; he is also a consultant for Lyell Immunopharma, Syncopation Life Sciences, NKarta, Gamma Delta Therapeutics, Aptorum Group, Illumina Radiopharmaceuticals, ImmunAI, Arovella Therapeutics and Zai Lab. M.M. is on the scientific advisory board for Cygnal Therapeutics.

Figures

Fig. 1
Fig. 1. Trial design and patients 1 and 2 with DIPG.
a, GD2–4-1BB–CD3Ζ CAR schematic. TM, transmembrane domain. b, Outline of clinical trial design. D0, day 0; LD, lymphodepleting chemotherapy. c, Post-mortem examination of participant 1 with DIPG (DIPG-1). From left to right: haemotoxylin and eosin staining; CD3 immunohistochemistry (brown); GD2-CAR mRNA puncta (pink; haematoxylin counterstain for all cells in blue); and GD2 antigen (blue) immunohistochemistry (H3K27M+ nuclei in brown). d, qPCR for GD2-CAR DNA from autopsy samples from DIPG-1 exhibit the presence of GD2-CAR in tumour-involved midbrain and pons, but not her uninvolved cortex or brain tissue from an untreated individual (control). Resected temporal lobe tumour from patient 1 with spinal DMG (spinal DMG-1) following i.v. infusion reveals the presence of GD2-CAR DNA. Data represent mean ± s.e.m., n = 3 technical replicates for each sample. e, MRI scan (axial T2, shown at the level of the lower pons) of participant 2 with DIPG (DIPG-2) before and 4 weeks after i.v. infusion (top row). An MRI scan before and 2 weeks following i.c.v. infusion is also shown (bottom row). A reduction in the tumour size is observed after each infusion (red arrows). f, Photographs of DIPG-2 demonstrate significant improvement in left facial strength 2 weeks after i.c.v. infusion. Photographs were obtained and published with informed consent. Schematics were created with BioRender.com. Source data
Fig. 2
Fig. 2. Patient 3 with DIPG and patient 1 with spinal DMG.
a, MRI images (axial T2) of participant 3 with DIPG (DIPG-3) showed a decrease in abnormal T2 signal (tumour) in the left cerebral peduncle corticospinal tract motor fibres (red arrows) 4 weeks following i.v. infusion that remained stably improved (MRI 2 weeks following i.c.v. infusion is also shown). b, The right hand of DIPG-3 at baseline, which exhibited poor strength, increased tone and was held in chronic flexion. Recovery of right-hand motor function was observed by 2 weeks after i.v. treatment, with increased movement and improved tone. c, Midbrain (left cerebral peduncle) tumour volume change over time in DIPG-3. d, Tumour volume change in the pons and medulla, and the middle cerebellar peduncles (MCP) and cerebellum over time in DIPG-3. e, Sagittal MRI images of patient 1 with spinal cord DMG (spinal DMG-1) show a decrease in the tumour (outlined in red) following i.v. treatment (blue arrow) and i.c.v. re-treatment (yellow arrow). f, Change over time in spinal cord tumour volume in spinal DMG-1. Grey shading indicates time period following i.c.v. infusion (c,d,f). g, Despite significant tumour reduction in f, a temporal lobe tumour (red arrow) in spinal DMG-1 did not respond (axial T2 MRI images). h, GD2 expression in the resected temporal lobe tumour from spinal DMG-1 was high and uniform by flow cytometry as compared to a fluorescence-minus-one control. Source data
Fig. 3
Fig. 3. CAR T cell kinetics and cytokine production.
a, qPCR for GD2-CARDNA illustrates kinetics of CAR T cell expansion and persistence in the peripheral blood following i.v. (top) and i.c.v. (bottom) administration. Each point represents one technical replicate; n = 3 technical replicates per timepoint per patient, 4 patients (i.v.), 3 patients (i.c.v.). b, Flow cytometry of GD2-CAR demonstrated significantly higher proportion of CAR T cells in the CSF following i.c.v. GD2-CAR T cell infusion than following i.v. infusion at peak inflammation timepoints. Each dot represents one patient. n = 4 patients (i.v.), 3 patients (i.c.v.). c, d, Pro-inflammatory cytokines in the blood and CSF after i.v. infusion (c), n = 4 patients, and after i.c.v. infusion (d), n = 3 patients. Note that the expression of IFNγ in the CSF of spinal DMG-1 on D1–3 after i.c.v. infusion was above the upper limit of detection of the assay. e, Levels of the immunosuppressive cytokines TGFβ1, TGFβ2 and TGFβ3 in the CSF after i.v. infusion. n = 3 patients. Heatmaps in ce were generated from Luminex multiplex cytokine analysis of patient blood plasma and CSF in technical duplicates. Average pg ml−1 results are represented by log2 fold change from D0 timepoint. Source data
Fig. 4
Fig. 4. Single-cell transcriptomic analyses identifies distinct myeloid subpopulations.
a, UMAP representation identifies cellular populations within GD2-CAR+ flow-sorted T cell products. n = 20,000 single cells (5,000 GD2-CAR+ cells from each of the 4 patient products). b, UMAP representation identifies cellular populations within CSF samples from patients. CSF cells by patient (left) and CSF cells by cell type (right) are shown. n = 25,598 single cells. c, UMAP highlighting FOXP3+ regulatory T (Treg) cells (left). Treg cell population (defined by CD4, FOXP3 and CD25 expression) identified in CSF samples at peak inflammation timepoints following i.v. or i.c.v. administration (right). n = 523 Treg cells were analysed from a total of 17,699 CSF T cells from 3 participants after i.v. and 2 participants after i.c.v. administration. With a Bayesian model-based single-cell compositional data analysis (scCODA) framework, the log fold change was 0.6, the inclusion probability was 0.75 and the false discovery rate was less than 0.05. d, CSF sample single-cell RNA sequencing was filtered to isolate myeloid cells. Clustering was conducted after data integration by Harmony. n = 6,497 myeloid cells. e, Pie charts represent myeloid cluster proportions at different timepoints. A single UMAP was generated with myeloid cells from the CSF, and then individually visually represented based on timepoint of the sample, coloured by patient. Note the alterations in the presence of myeloid clusters over time. f, Expression signature of ‘immune activating’, ‘immune suppressive’, ‘disease-associated myeloid (DAM) stage 1’, ‘DAM stage 2’, ‘myeloid-derived suppressor cell (MDSC)’ and ‘axon tract-associated microglial (ATM)’ cell states and associated representation within clusters based on single-cell expression scores (Z score). Source data
Extended Data Fig. 1
Extended Data Fig. 1. Additional correlative findings and imaging for DIPG-1.
a, MRI images (axial T2) of participant 1 with DIPG (DIPG-1) prior to and Day+28 following GD2-CART infusion showed no improvement. b, Tumour volume change over time in DIPG-1. c, Post-mortem pons tumour tissue of DIPG-1 shows evidence of CD4+ and CD8+ T-cells by immunohistochemistry (brown). Unaffected cortex CD4+ staining depicts rare leptomeningeal vascular CD4+ cells and serves as an internal positive control. d, RNAscope probe against the GD2-CAR construct mRNA identifies GD2-CAR T cells (GD2-CAR mRNA puncta, pink). Positive control GD2-CAR T cells in tissue culture and negative control cortex from a DIPG patient not treated with CAR T cells were used to validate the RNAscope probe. GD2-CAR mRNA expression detected by RNAscope identified GD2-CAR T cells in tumour tissue from DIPG-1. GD2-CAR mRNA puncta = pink, hematoxylin counterstain for all cells = blue. e, Normal human muscle tissue immunostained for GD2 as negative control for GD2 antigen immunohistochemistry. f, CD163+ myeloid cells (brown) in tumor tissue of DIPG-1 by immunohistochemistry. Unaffected cortex CD163 immunostaining demonstrates microglial cells in their "resting" perivascular location. CD163+ reactive microglia/macrophages were not evident in the normal cortex of DIPG-1. g, Confocal microscopy of DIPG-1 tumour tissue obtained at autopsy demonstrates significant myeloid cells (Iba1+ cells, green) infiltrating the tumor (H3K27M+ cells, red). Scale bars = 100 micrometers. Source data
Extended Data Fig. 2
Extended Data Fig. 2. Additional MRI findings.
a, Participant 2 with DIPG (DIPG-2) MRI images (axial T2) at the level of the mid-pons demonstrate T2 signal abnormality in the trigeminal nucleus (red arrow) that worsened (increased T2 signal, consistent with pseudoprogression) at Day+7 and progressively decreased on the Day+14 and Day+21 scans. Together with this T2 signal change, trigeminal function (muscles of mastication and left facial sensation) worsened around Day+7 and then progressively improved clinically. The size of the intra-tumoral cyst near the trigeminal nucleus decreased in size after treatment (red arrowhead) and the size and shape of the fourth ventricle normalized. b, Tumor volume change over time in DIPG-2. c, MRIs (axial T2) of cerebellum from participant 3 with DIPG (DIPG-3) shows increased disease in cerebellum over time, despite GD2-CAR T cell treatments. Disease in the cerebellar peduncle was relatively stable at 1 month post-IV infusion, but by the time of ICV infusion (new ICV baseline, bottom row) the cerebellar peduncle and cerebellar disease had increased, consistent with tumour progression at this site. d, Patient 1 with spinal cord DMG (Spinal DMG-1) MRI brain (axial T2) prior to and 21 days after ICV GD2-CAR T cell administration. Note the extensive spread of tumour throughout brain, which reduced following ICV treatment (for example, see arrows at the left inferior frontal lobe highlighting decreased infiltrative disease at Day 21). Source data
Extended Data Fig. 3
Extended Data Fig. 3. Spinal DMG-1 EEG during episode of encephalopathy.
Electroencephalogram (EEG) demonstrates diffuse slowing with triphasic waves on Day 2-3 following ICV GD2-CAR T cell administration in Spinal DMG-1. Consistent with this EEG pattern that is often observed with reversible toxic/metabolic/inflammatory encephalopathy, mental status returned to baseline over the course of days.
Extended Data Fig. 4
Extended Data Fig. 4. Peripheral blood LDH kinetics, CSF cell-free tumor DNA (ctDNA) findings, and ctDNA validation.
a, Elevated Lactate Dehydrogenase (LDH) levels approximately 7–14 days following GD2-CAR T cell infusions (either IV or ICV) in N = 4 patients. Filled dot=IV, open dot=ICV. b, Cell-free tumor DNA (ctDNA) from patient CSF was evaluated using digital droplet PCR for the H3K27M mutation in the H3F3A gene. N=at least 4 technical replicates represented as Log2 of mutations per mL CSF ± SEM. Each point equals one technical replicate at the indicated timepoint; Filled dot=IV, open dot=ICV. DIPG-2 and Spinal DMG-1 demonstrated increasing cfDNA levels directly following GD2-CAR T cell ICV infusion (p < 0.0001 calculated by t-test). All available CSF samples from patients with adequate DNA extraction are represented here. DIPG-1 and DIPG-3 exhibited below the limit of detection levels and are not shown (limit of detection = 1 mutation per mL). c, Workflow for cell-free tumor DNA (ctDNA) assay. Cell-free DNA (cfDNA) was extracted from 1–4ml of CSF and subjected to 7 cycles pre-amplification followed by 40 cycles of digital droplet PCR (ddPCR). Schematic created with BioRender.com. d, Representative bioanalyzer traces of patients demonstrate adequate cfDNA quantities in Spinal DMG-1 and DIPG-2 without detectable cfDNA in DIPG-1 and DIPG-3 (i.e. there was not enough total cell-free DNA to run the assay). e, Validation of ddPCR assay through serial dilution of mutant H3K27M gBlock (IDT) against a fixed background of wild type H3K27M gBlock demonstrates linear mutant H3K27M detection. Sample concentrations (copies/ul) and dilution factors are plotted at Log10 scale. The QuantaSoft Pro Software calculates the starting concentration of each target DNA molecule by modeling as a Poisson distribution; the formula used for Poisson modeling is: Copies per droplet = -ln(1-p) where p = fraction of positive droplets. f, Inclusion of negative and positive controls for each ddPCR assay was performed alongside patient samples. Pre-amplified water served as a negative control for every run. Conditioned medium from H3K27M-mutated DIPG cell cultures was used as a positive control. Serial dilutions of H3K27M-mutated DIPG cell culture medium demonstrate a reproducible variant allele frequency (VAF) of the positive control. Source data
Extended Data Fig. 5
Extended Data Fig. 5. Absolute values of pro-inflammatory and suppressive cytokines in pg/mL and anakinra levels measured by IL1-Ra in CSF and serum.
a, Time-course of anti-inflammatory agents (tocilizumab, anakinra and corticosteroids) administered to patients following CAR T cell infusions represented graphically to provide context for interpreting cytokine levels at various timepoints. bd, The same data in absolute values that is represented in heatmap form in Fig. 4. Each data point represents the pg/ml value of the indicated cytokine at the timepoint following GD2-CAR T cell infusion. b, Pro-inflammatory cytokine levels in blood and cerebrospinal fluid (CSF) following intravenous (IV) administration. N = 4 patients (blood) and 3 patients (CSF). c, Pro-inflammatory cytokine levels in blood and cerebrospinal fluid (CSF) following intra-cerebroventricular (ICV) administration. N = 3 patients. d, Immune-suppressive TGFβ cytokine levels in the CSF following IV CAR T cell administration. N = 3 patients. e, Peak serum and CSF IL1-Ra levels during anakinra treatment. Anakinra is recombinant IL1-Ra. CSF levels of anakinra, which can cross the blood-brain barrier, were approximately one tenth those of serum levels. Data generated by Luminex multi-plex cytokine analysis of patient blood plasma and CSF samples. N = 3 patients. be, Each data point represents the mean of two technical replicates. Red=DIPG-1, Blue=DIPG-2, Purple= DIPG-3, Green=Spinal DMG-1. Filled dot=IV, open dot=ICV. Source data
Extended Data Fig. 6
Extended Data Fig. 6. Single cell RNA-sequencing of GD2-CAR T cells in CSF and from manufactured product.
a, Schematic of single cell RNA sequencing (scRNA-seq) via 10X Genomics platform, conducted on sorted GD2-CAR+ and CAR- infusion products, as well as CSF samples at indicated timepoints throughout treatment. 65,598 single cells were sequenced, including 20,000 single cells from the CAR+ fraction of patient products and 25,598 cells obtained from patient CSF (shown in Fig. 4). Schematic created with BioRender.com. b, GD2-CAR+ T cells were identified in post-treatment CSF samples of DIPG-2 and Spinal DMG-1 following GD2-CAR T cell administration. T cells with detected GD2-CAR expression are represented as red dots. A single UMAP was generated with flow-sorted GD2-CAR T cell product and cells from the CSF then individually visually represented based on day of the sample. Note alterations in GD2-CAR T cell profile over time. CSF studies were not obtained for Spinal DMG-1 following IV infusion. CSF studies were also limited in DIPG-3: Following ICV GD2-CAR T cell administration, DIPG-3 did not require CSF drainage during the period of peak inflammation and given her young age, elective CSF collection was more limited. Therefore, the only post-ICV timepoint for CSF collection from DIPG-3 was Day 14, at which point there were not enough cells in CSF to conduct scRNAseq. Blue arrow=IV infusion, Yellow arrow=ICV infusion. c, Volcano plot representing CAR T cell product of DIPG-1 compared to DIPG-2. df, Gene ontology term analysis of the most significantly enriched pathways in DIPG-1CAR+ product relative to DIPG-2 (d), Spinal DMG-1 (e), and DIPG-3 (f) CAR+ product prior to CAR T cell administration. The y-axis shows the enhanced gene ontology terms, while the x-axis (“GeneRatio”) corresponds to the overlap between the up-regulated genes and genes associated with the given gene ontology terms in the dataset. Color of the circle corresponds to the p-value significance of the pathway enrichment, relative to all other genes in the dataset. Size of the circle corresponds to the relative number of matching up-regulated genes in the given gene ontology term.
Extended Data Fig. 7
Extended Data Fig. 7. CD4:CD8 Ratios of T cells throughout treatment and gene ontology term analysis of CAR T cell products prior to CAR T cell treatment.
a, Pie charts represent CSF T cell CD4:CD8 ratios from patients at different timepoints following CAR T cell administration. b, Top panel: CSF T cell UMAP projections highlighting Tregs in scRNA-seq data. The Treg cell cluster is highlighted in purple, while all other T cells are colored grey. Bottom panel: UMAP projections highlighting Tregs in scRNA-seq data by expressions of canonical marker genes of Tregs (CD4, FOXP3, CD25, and IKZF2). Source data
Extended Data Fig. 8
Extended Data Fig. 8. Expression of cell cluster-specific marker genes and myeloid signature genes.
a, CSF myeloid cell UMAP projections highlighting myeloid cell clusters in scRNA-seq data by top differentially expressed genes of each cell cluster. b, c, Expression of myeloid transcriptional signature genes (y-axis) of identified myeloid cell clusters (x-axis). Dot sizes represent the percentage of cells expressing the gene in the given cluster. Color scale shows scaled average expression. Genes of immune activating and suppressive (b), homeostatic, and DAM stage 1 and 2 signatures (c) are plotted.
Extended Data Fig. 9
Extended Data Fig. 9. Gene ontology term analysis of myeloid cells from CSF following GD2-CAR T cell treatment.
ac, Gene ontology term analysis demonstrates the most significantly activated pathways in the myeloid fraction of DIPG-1 compared to DIPG-2 (a), DIPG-3 (b), and Spinal DMG-1 (c). d, Gene ontology term analysis demonstrates the most significantly enriched pathways in the myeloid fraction of DIPG-2 CSF sample on Day 8 of IV CAR T administration relative to the myeloid fraction of DIPG-2 CSF sample on Day 2 of ICV CAR T cell administration (time points of peak inflammation following IV or ICV administration for this patient). The y-axis shows the enhanced gene ontology terms, while the x-axis (“GeneRatio”) corresponds to the overlap between the up-regulated genes and genes associated with the given gene ontology term in the dataset. Color of the circle corresponds to the p-value significance of the pathway enrichment, relative to all other genes in the dataset. Size of the circle corresponds to the relative number of matching up-regulated genes in the given gene ontology term. Only myeloid cells in CSF are included in this analysis.
Extended Data Fig. 10
Extended Data Fig. 10. Representative gating for flow cytometry of patient samples.
a, Representative gating of a patient CSF sample by flow cytometry (identical gating was used for PBMC obtained from blood). b, Gating of tumour cells by flow cytometry from temporal lobe resection tissue from Spinal DMG-1.

References

    1. Louis DN, et al. The 2016 World Health Organization Classification of Tumors of the Central Nervous System: a summary. Acta Neuropathol. 2016;131:803–820. - PubMed
    1. Mount CW, et al. Potent antitumor efficacy of anti-GD2 CAR T cells in H3-K27M+ diffuse midline gliomas. Nat. Med. 2018;24:572–579. - PMC - PubMed
    1. Theruvath J, et al. Locoregionally administered B7-H3-targeted CAR T cells for treatment of atypical teratoid/rhabdoid tumors. Nat. Med. 2020;26:712–719. - PMC - PubMed
    1. Lin GL, et al. Non-inflammatory tumor microenvironment of diffuse intrinsic pontine glioma. Acta Neuropathol. Commun. 2018;6:51. - PMC - PubMed
    1. Broniscer A, et al. Intratumoral hemorrhage among children with newly diagnosed, diffuse brainstem glioma. Cancer. 2006;106:1364–1371. - PubMed

Publication types

MeSH terms