. 2021 Feb 22;13(1):e0375121.
doi: 10.1128/mbio.03751-21. Epub 2022 Feb 8.

Subcellular Detection of SARS-CoV-2 RNA in Human Tissue Reveals Distinct Localization in Alveolar Type 2 Pneumocytes and Alveolar Macrophages

Affiliations

Subcellular Detection of SARS-CoV-2 RNA in Human Tissue Reveals Distinct Localization in Alveolar Type 2 Pneumocytes and Alveolar Macrophages

Kofi K Acheampong et al. mBio. .

Abstract

The widespread coronavirus disease 2019 (COVID-19) is caused by infection with the novel coronavirus SARS-CoV-2. Currently, we have limited understanding of which cells become infected with SARS-CoV-2 in human tissues and where viral RNA localizes on the subcellular level. Here, we present a platform for preparing autopsy tissue for visualizing SARS-CoV-2 RNA using RNA fluorescence in situ hybridization (FISH) with amplification by hybridization chain reaction. We developed probe sets that target different regions of SARS-CoV-2 (including ORF1a and N), as well as probe sets that specifically target SARS-CoV-2 subgenomic mRNAs. We validated these probe sets in cell culture and tissues (lung, lymph node, and placenta) from infected patients. Using this technology, we observe distinct subcellular localization patterns of the ORF1a and N regions. In human lung tissue, we performed multiplexed RNA FISH HCR for SARS-CoV-2 and cell-type-specific marker genes. We found viral RNA in cells containing the alveolar type 2 (AT2) cell marker gene (SFTPC) and the alveolar macrophage marker gene (MARCO) but did not identify viral RNA in cells containing the alveolar type 1 (AT1) cell marker gene (AGER). Moreover, we observed distinct subcellular localization patterns of viral RNA in AT2 cells and alveolar macrophages. In sum, we demonstrate the use of RNA FISH HCR for visualizing different RNA species from SARS-CoV-2 in cell lines and FFPE (formalin fixation and paraffin embedding) autopsy specimens. We anticipate that this platform could be broadly useful for studying SARS-CoV-2 pathology in tissues, as well as extended for other applications, including investigating the viral life cycle, viral diagnostics, and drug screening. IMPORTANCE Here, we developed an in situ RNA detection assay for RNA generated by the SARS-CoV-2 virus. We found viral RNA in lung, lymph node, and placenta samples from pathology specimens from COVID patients. Using high-magnification microscopy, we can visualize the subcellular distribution of these RNA in single cells.

Keywords: RNA FISH; cellular imaging; fluorescent image analysis; single cell.


Conflict of interest statement

The authors declare a conflict of interest. S.M.S. receives royalties related to Stellaris RNA FISH probes. All other authors declare no competing interests.

S.M.S. receives royalties related to Stellaris RNA FISH probes. All other authors declare no competing interests.

Figures
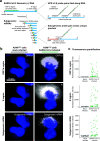
FIG 1
FIG 1
RNA FISH HCR v3.0 probe sets enable direct visualization of the SARS-CoV-2 virus. (a) Schematic of the SARS-CoV-2 genomic RNA and subgenomic RNA species with HCR v3.0 probe designs highlighted. We developed probes tiled along the ORF1a and N regions of the SARS-CoV-2 (+) RNA strand. These probe sets consisted of 23 probe pairs for ORF1a and 7 probe pairs for N. To detect all of the subgenomic RNAs, we positioned the HCR probes across the junction of the leader sequence and each unique subgenomic transcript. In the schematic, the leader sequence is shown in orange, the transcript is shown in blue, and the probe design is shown in green. (b) Representative images of the A549ACE2 cells mock infected or infected with SARS-CoV-2 at an MOI = 1, fixed 24 h postinfection, and then hybridized with probes for ORF1a, N, and subgenome. DAPI labels cell nuclei. The scale bar applies to all images and shows 10 μm. The images are z-projections from image stacks acquired at ×60 magnification. (c) Quantification of the fluorescence signal from the experiment in panel b. For each the mock-infected data set (shown in gray) and SARS-CoV-2-infected data set (shown in green), we quantified fluorescence signal intensity from 50 cells per condition. We found that for each probe set the SARS-CoV-2-infected sample had statistically significant differences in the distribution of fluorescence intensities compared to the mock-infected sample (ORF1a region, N region, and subgenomic RNAs, single-tailed KS test P values = 4.765e–16, <2.2e–16, and 4.496e–09, respectively). Note that the SARS-CoV-2-infected sample contained both cells that were infected and cells that remained uninfected.
FIG 2
FIG 2
RNA FISH HCR in FFPE human autopsy tissues. (a) Experiment design in which we performed RNA FISH HCR with ORF1a probe sets on FFPE tissues including lung, hilar lymph node, and placenta. (b) Example images of each tissue with ORF1a RNA staining. Images are large area scans of image tiles acquired at 20×. The scale bar on the large images shows 100 μm. Inset images show a zoomed in example of ORF1a RNA staining in that tissue. Scale bars on these inset images are 10 μm. DAPI stain (blue) labels the cell nuclei in all images.
FIG 3
FIG 3
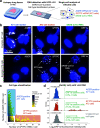
Multiplexed RNA FISH HCR identifies AT2 cells containing viral RNA in lung autopsy samples. (a) We probed FFPE human lung tissue with SARS-CoV-2 probe sets, as well as probe sets for cell-type-specific marker genes, AGER for AT1 cells, and SFTPC for AT2 cells. (b) Representative images of cells classified as AT1 cells or AT2 cells. The top row depicts an AT1 cell staining positive for AGER. The second row shows two SFTPC-positive AT2 cells staining with the ORF1a viral RNA probe set. DAPI stain (blue) labels the cell nuclei in all images. Scale bars show 10 μm. The images are z-projections of image stacks acquired at ×100 magnification. (c) Here, we acquired large tiled image scans consisting of 252,820 cells total. We quantified the AGER and SFTPC mRNA in each cell and set a cutoff (see Materials and Methods) for determining which cells are positive for each gene, indicating that they are either AT1 or AT2 cells, respectively. The plot shows a scatterplot of mRNA levels with cutoffs for AT1 and AT2 cells. The color on the scatterplot indicates the number of cells at each point on the plot, and the scale is shown by the legend with yellow indicating low cell numbers and blue indicating high cell numbers. The blue rectangle shows the region on the plot for AGER-positive AT1 cells, and the red rectangle shows the region on the plot for SFTPC-positive AT2 cells. (d) Histograms of the log2 of the fluorescence intensity for the SARS-CoV-2 ORF1a probe set in each cell. The data are split into three histograms for each cell identified (AT1 cells, AT2 cells, and undetermined cells). These histograms are normalized to the number of cells in each category. The y axis labels the density of these distributions (which is the normalized number of cells in each bin). The total number of cells in each category is labeled on the plot. The green dotted line shows the cutoff for calling a cell positive for viral RNA. AT2 cells had a statistically significant different distribution of ORF1a signal compared to AT1 cells (single-tailed KS test, P = 2.653e–15).
FIG 4
FIG 4
Alveolar macrophages and AT2 cells show distinct viral RNA staining patterns in autopsy tissue. (a) Schematic of experimental design in which we multiplexed cell-type-specific marker genes with SARS-CoV-2 ORF1a probes. We examined the subcellular distribution of RNA staining in infected alveolar macrophages and AT2 cells. (b) Examples of alveolar macrophages showing MARCO, ORF1a, and bright-field images for each cell. The border of each cell’s cytoplasm is shown by the red dotted line in each image. DAPI stain for cell nuclei is shown in blue. Scale bars show 10 μm. The images are z-projections of image stacks acquired at ×100 magnification. (c) Examples of AT2 cells showing SFTPC, ORF1a, and bright-field images for each cell. The borders, nuclei, and scale bars are labeled the same as in panel b. The images are z-projections of image stacks acquired at ×100 magnification.

References

    1. Huang C, Wang Y, Li X, Ren L, Zhao J, Hu Y, Zhang L, Fan G, Xu J, Gu X, Cheng Z, Yu T, Xia J, Wei Y, Wu W, Xie X, Yin W, Li H, Liu M, Xiao Y, Gao H, Guo L, Xie J, Wang G, Jiang R, Gao Z, Jin Q, Wang J, Cao B. 2020. Clinical features of patients infected with 2019 novel coronavirus in Wuhan, China. Lancet 395:497–506. doi:10.1016/S0140-6736(20)30183-5. - DOI - PMC - PubMed
    1. Pan X, Chen D, Xia Y, Wu X, Li T, Ou X, Zhou L, Liu J. 2020. Asymptomatic cases in a family cluster with SARS-CoV-2 infection. Lancet Infect Dis 20:410–411. doi:10.1016/S1473-3099(20)30114-6. - DOI - PMC - PubMed
    1. Wu Z, McGoogan JM. 2020. Characteristics of and important lessons from the coronavirus disease 2019 (COVID-19) outbreak in China: summary of a report of 72,314 cases from the Chinese Center for Disease Control and Prevention. JAMA 323:1239–1242. doi:10.1001/jama.2020.2648. - DOI - PubMed
    1. Zou X, Chen K, Zou J, Han P, Hao J, Han Z. 2020. Single-cell RNA-seq data analysis on the receptor ACE2 expression reveals the potential risk of different human organs vulnerable to 2019-nCoV infection. Front Med 14:185–192. doi:10.1007/s11684-020-0754-0. - DOI - PMC - PubMed
    1. Chen L, Li X, Chen M, Feng Y, Xiong C. 2020. The ACE2 expression in human heart indicates new potential mechanism of heart injury among patients infected with SARS-CoV-2. Cardiovasc Res 116:1097–1100. doi:10.1093/cvr/cvaa078. - DOI - PMC - PubMed

Publication types