

SARS-CoV-2 Variants Associated with Vaccine Breakthrough in the Delaware Valley through Summer 2021
- PMID: 35130727
- PMCID: PMC8942461
- DOI: 10.1128/mbio.03788-21
SARS-CoV-2 Variants Associated with Vaccine Breakthrough in the Delaware Valley through Summer 2021
Abstract
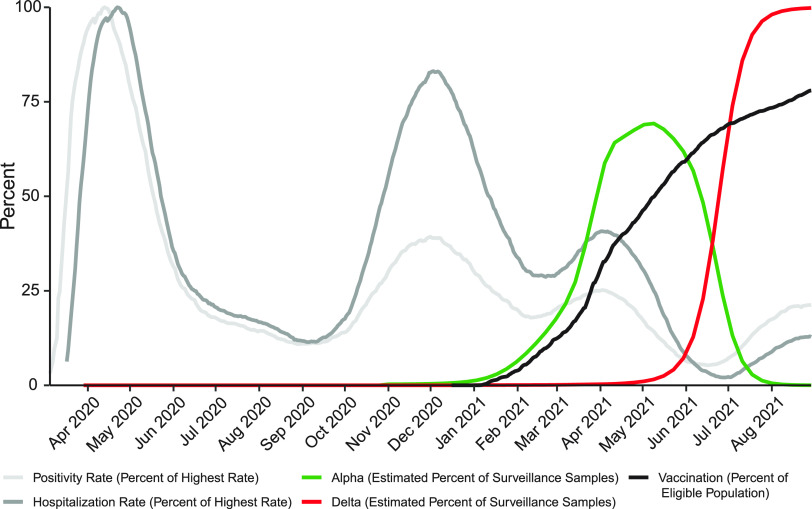
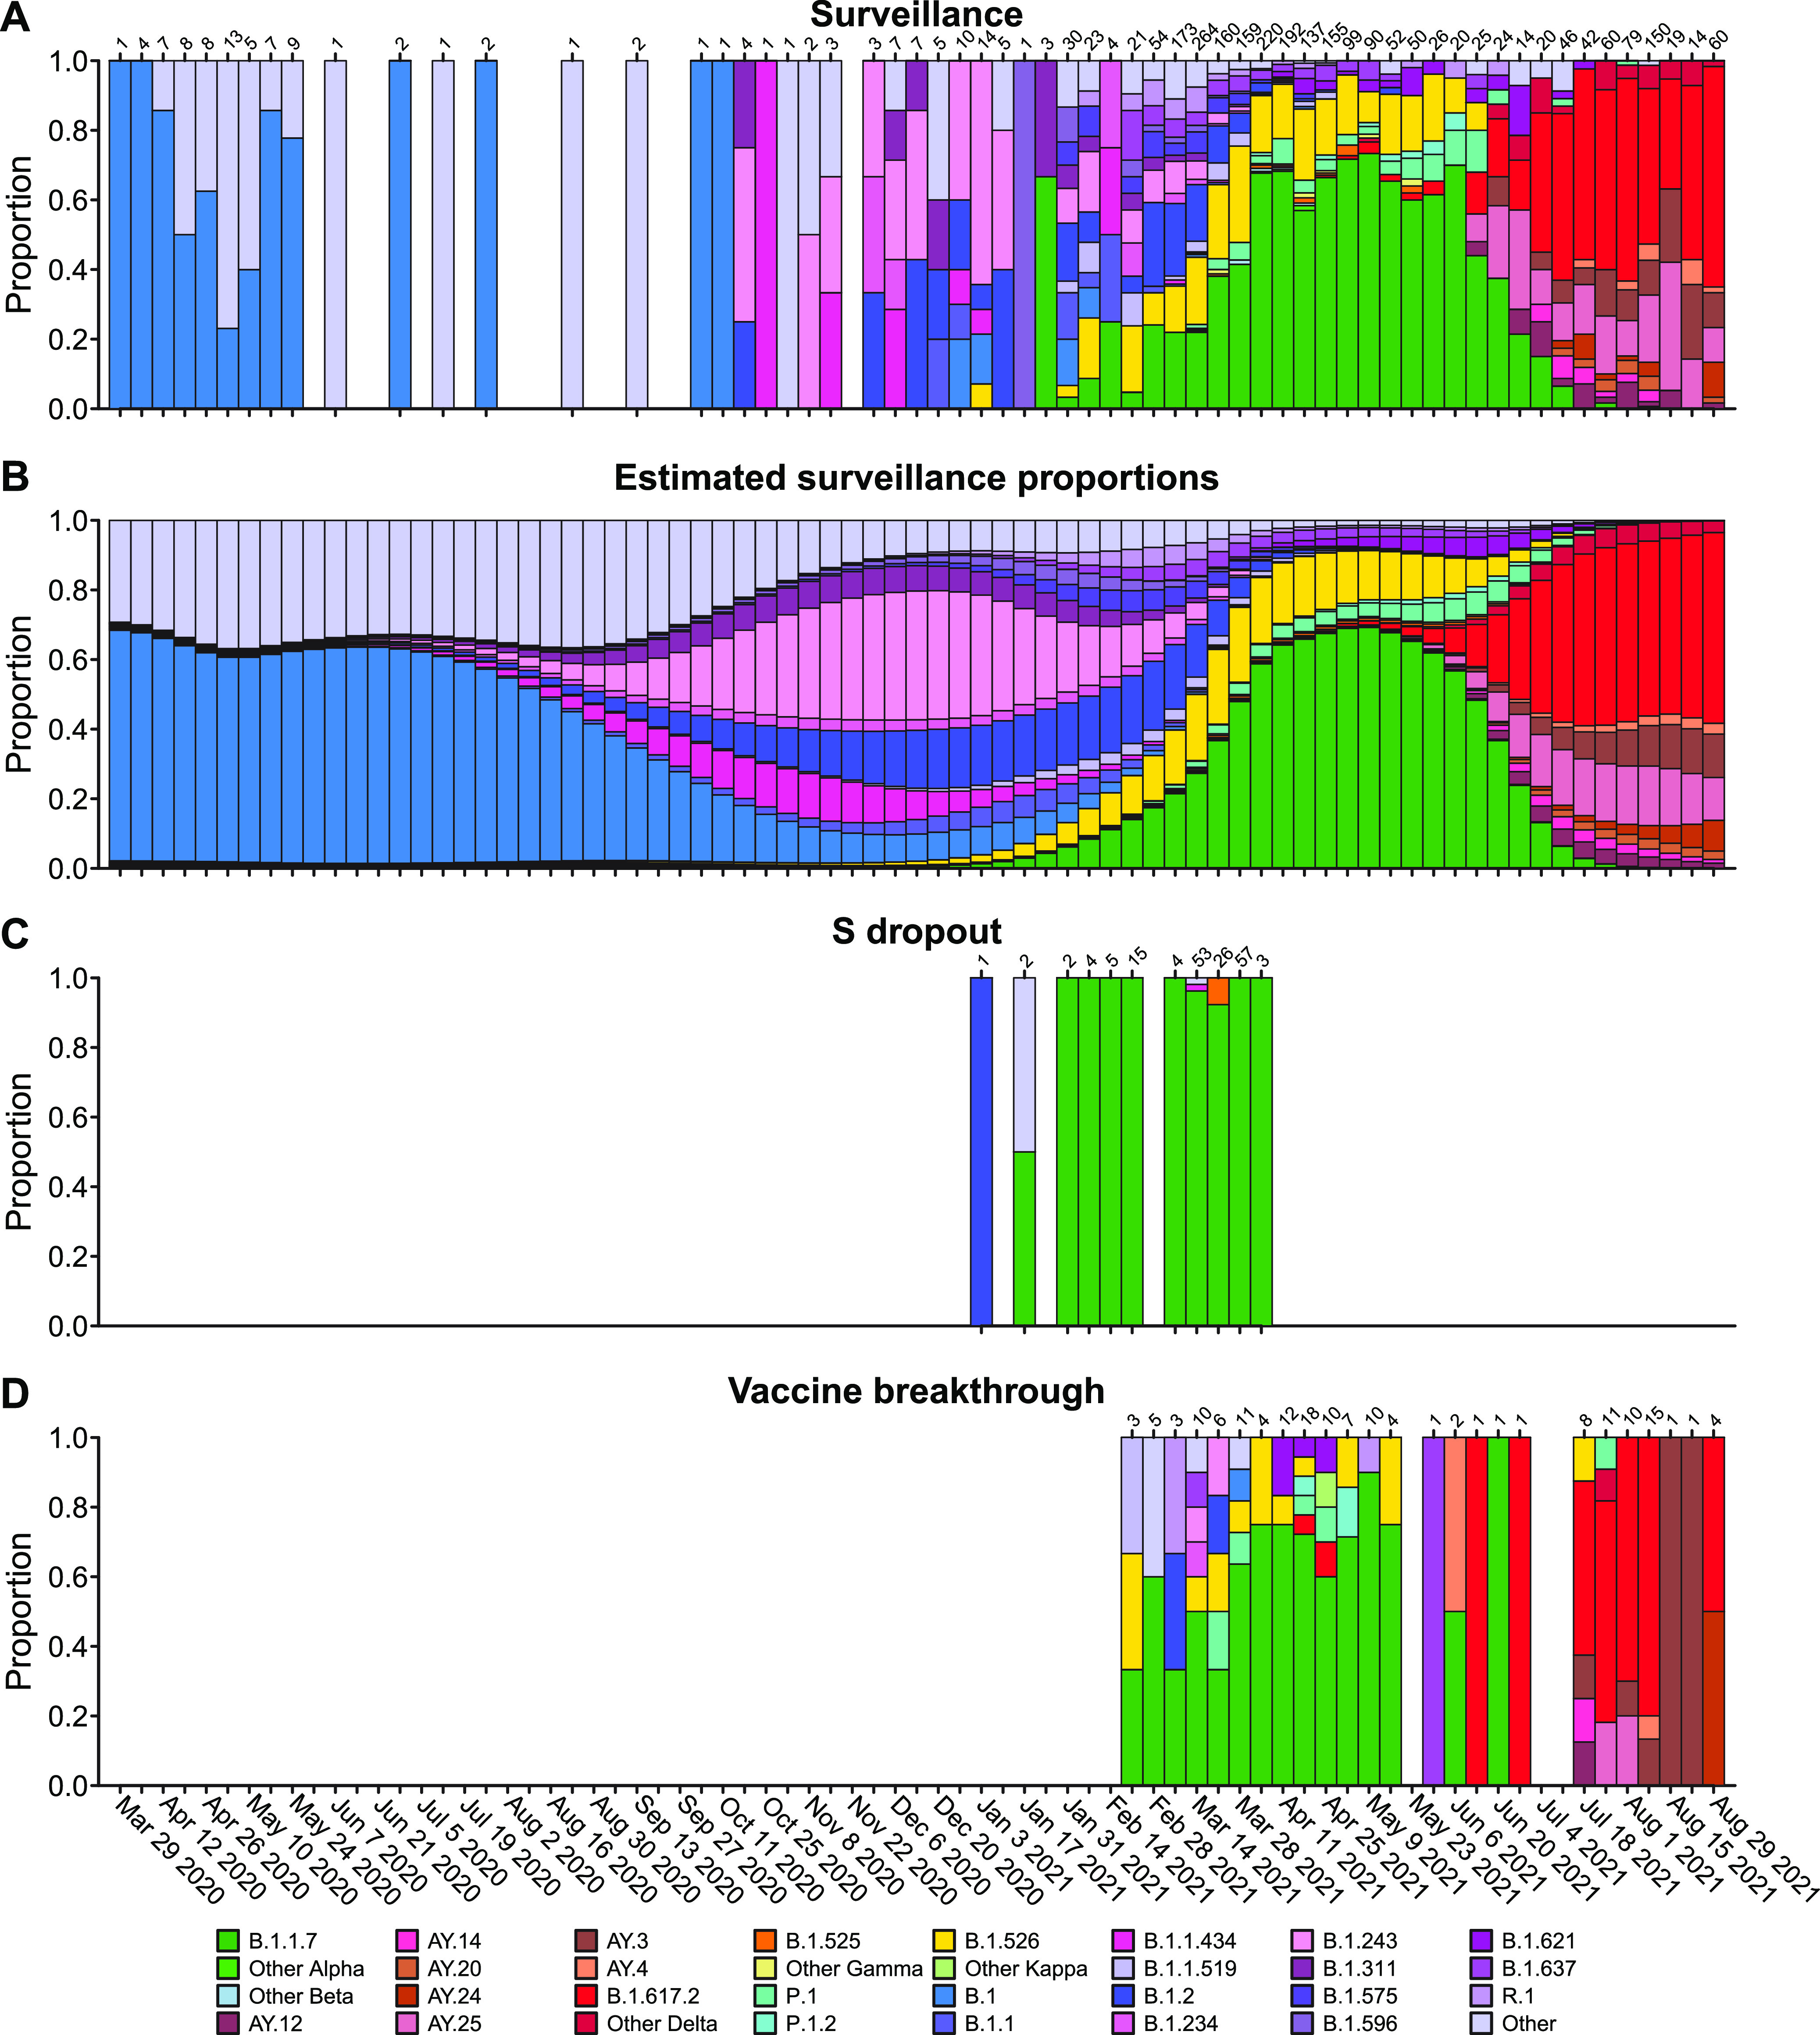
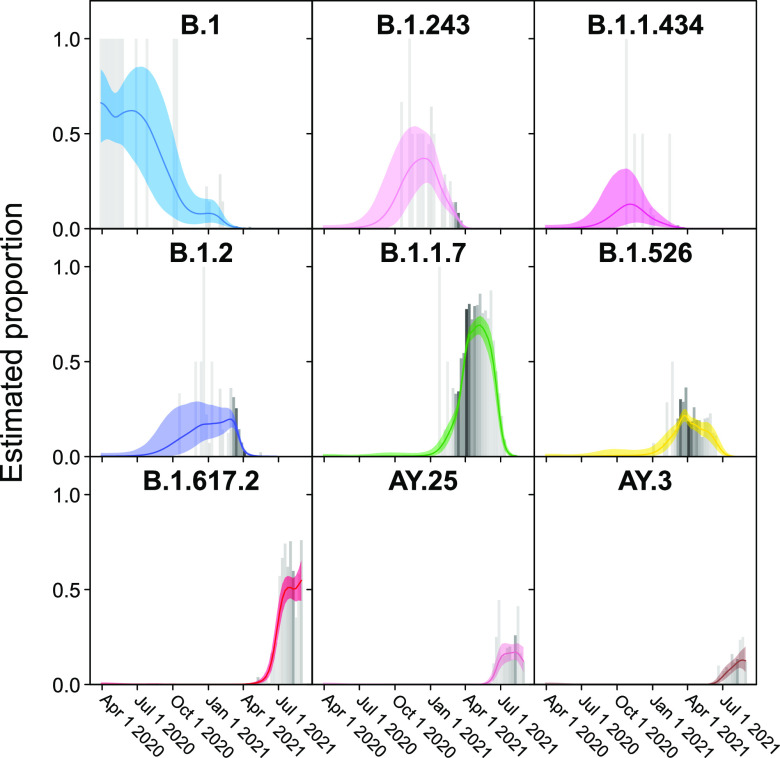
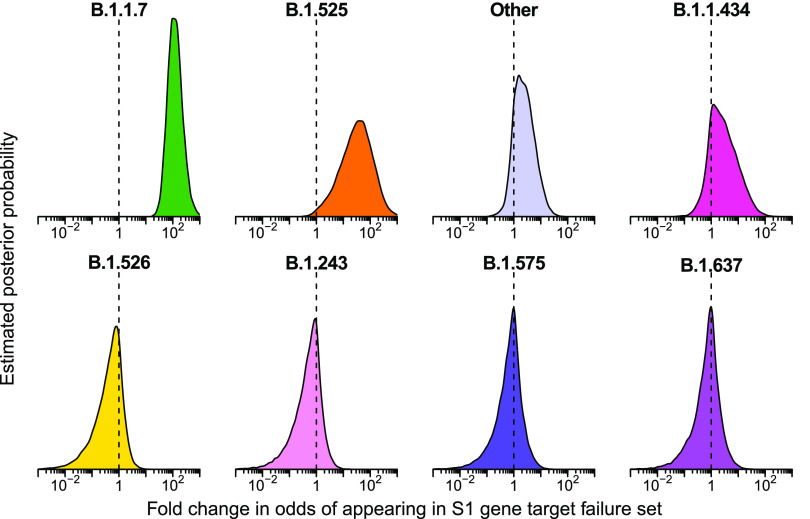
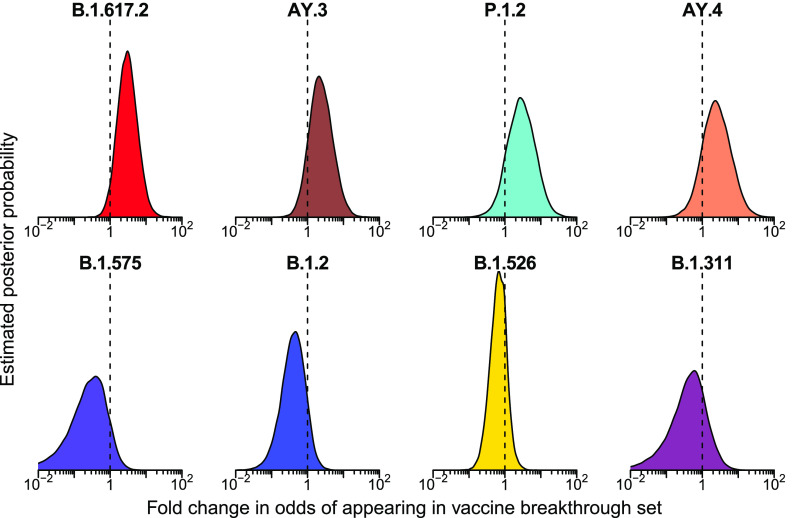
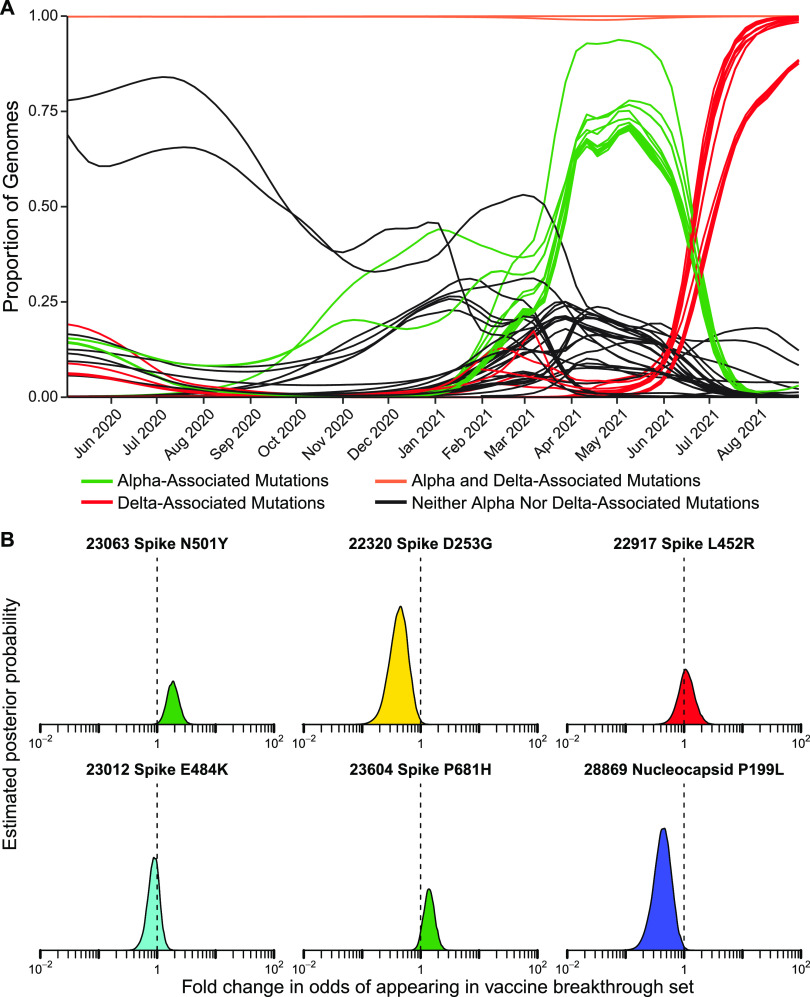
The severe acute respiratory coronavirus-2 (SARS-CoV-2) is the cause of the global outbreak of COVID-19. Evidence suggests that the virus is evolving to allow efficient spread through the human population, including vaccinated individuals. Here, we report a study of viral variants from surveillance of the Delaware Valley, including the city of Philadelphia, and variants infecting vaccinated subjects. We sequenced and analyzed complete viral genomes from 2621 surveillance samples from March 2020 to September 2021 and compared them to genome sequences from 159 vaccine breakthroughs. In the early spring of 2020, all detected variants were of the B.1 and closely related lineages. A mixture of lineages followed, notably including B.1.243 followed by B.1.1.7 (alpha), with other lineages present at lower levels. Later isolations were dominated by B.1.617.2 (delta) and other delta lineages; delta was the exclusive variant present by the last time sampled. To investigate whether any variants appeared preferentially in vaccine breakthroughs, we devised a model based on Bayesian autoregressive moving average logistic multinomial regression to allow rigorous comparison. This revealed that B.1.617.2 (delta) showed 3-fold enrichment in vaccine breakthrough cases (odds ratio of 3; 95% credible interval 0.89-11). Viral point substitutions could also be associated with vaccine breakthroughs, notably the N501Y substitution found in the alpha, beta and gamma variants (odds ratio 2.04; 95% credible interval of1.25-3.18). This study thus overviews viral evolution and vaccine breakthroughs in the Delaware Valley and introduces a rigorous statistical approach to interrogating enrichment of breakthrough variants against a changing background. IMPORTANCE SARS-CoV-2 vaccination is highly effective at reducing viral infection, hospitalization and death. However, vaccine breakthrough infections have been widely observed, raising the question of whether particular viral variants or viral mutations are associated with breakthrough. Here, we report analysis of 2621 surveillance isolates from people diagnosed with COVID-19 in the Delaware Valley in southeastern Pennsylvania, allowing rigorous comparison to 159 vaccine breakthrough case specimens. Our best estimate is a 3-fold enrichment for some lineages of delta among breakthroughs, and enrichment of a notable spike substitution, N501Y. We introduce statistical methods that should be widely useful for evaluating vaccine breakthroughs and other viral phenotypes.
Keywords: COVID-19; Philadelphia; SARS-CoV-2; coronavirus; genome sequencing.
Conflict of interest statement
The authors declare a conflict of interest. R.G.C. reports support to his lab for COVID-19 work unrelated to the current manuscript from OraSure, Inc, and ongoing collaborations with Resilient Biotics, Inc. All other authors have no competing interests.
Figures
Update of
-
SARS-CoV-2 variants associated with vaccine breakthrough in the Delaware Valley through summer 2021.medRxiv [Preprint]. 2021 Nov 17:2021.10.18.21264623. doi: 10.1101/2021.10.18.21264623. medRxiv. 2021. Update in: mBio. 2022 Feb 8;13(1):e0378821. doi: 10.1128/mbio.03788-21. PMID: 34704098 Free PMC article. Updated. Preprint.
References
-
- Lu R, Zhao X, Li J, Niu P, Yang B, Wu H, Wang W, Song H, Huang B, Zhu N, Bi Y, Ma X, Zhan F, Wang L, Hu T, Zhou H, Hu Z, Zhou W, Zhao L, Chen J, Meng Y, Wang J, Lin Y, Yuan J, Xie Z, Ma J, Liu WJ, Wang D, Xu W, Holmes EC, Gao GF, Wu G, Chen W, Shi W, Tan W. 2020. Genomic characterisation and epidemiology of 2019 novel coronavirus: implications for virus origins and receptor binding. Lancet 395:565–574. doi:10.1016/S0140-6736(20)30251-8. - DOI - PMC - PubMed
-
- Holmes EC, Goldstein SA, Rasmussen AL, Robertson DL, Crits-Christoph A, Wertheim JO, Anthony SJ, Barclay WS, Boni MF, Doherty PC, Farrar J, Geoghegan JL, Jiang X, Leibowitz JL, Neil SJD, Skern T, Weiss SR, Worobey M, Andersen KG, Garry RF, Rambaut A. 2021. The origins of SARS-CoV-2: a critical review. Cell 184:4848–4856. doi:10.1016/j.cell.2021.08.017. - DOI - PMC - PubMed
-
- Meng B, Kemp SA, Papa G, Datir R, Ferreira IATM, Marelli S, Harvey WT, Lytras S, Mohamed A, Gallo G, Thakur N, Collier DA, Mlcochova P, Duncan LM, Carabelli AM, Kenyon JC, Lever AM, De Marco A, Saliba C, Culap K, Cameroni E, Matheson NJ, Piccoli L, Corti D, James LC, Robertson DL, Bailey D, Gupta RK, COVID-19 Genomics UK (COG-UK) Consortium . 2021. Recurrent emergence of SARS-CoV-2 spike deletion H69/V70 and its role in the Alpha variant B.1.1.7. Cell Rep 35:109292. doi:10.1016/j.celrep.2021.109292. - DOI - PMC - PubMed
MeSH terms
Substances
Supplementary concepts
Grants and funding
LinkOut - more resources
Full Text Sources
Medical
Miscellaneous
