

Satellitome comparison of two oedipodine grasshoppers highlights the contingent nature of satellite DNA evolution
- PMID: 35130900
- PMCID: PMC8822648
- DOI: 10.1186/s12915-021-01216-9
Satellitome comparison of two oedipodine grasshoppers highlights the contingent nature of satellite DNA evolution
Erratum in
-
Author Correction: Satellitome comparison of two oedipodine grasshoppers highlights the contingent nature of satellite DNA evolution.BMC Biol. 2022 Mar 23;20(1):69. doi: 10.1186/s12915-022-01260-z. BMC Biol. 2022. PMID: 35317788 Free PMC article. No abstract available.
Abstract
Background: The full catalog of satellite DNA (satDNA) within a same genome constitutes the satellitome. The Library Hypothesis predicts that satDNA in relative species reflects that in their common ancestor, but the evolutionary mechanisms and pathways of satDNA evolution have never been analyzed for full satellitomes. We compare here the satellitomes of two Oedipodine grasshoppers (Locusta migratoria and Oedaleus decorus) which shared their most recent common ancestor about 22.8 Ma ago.
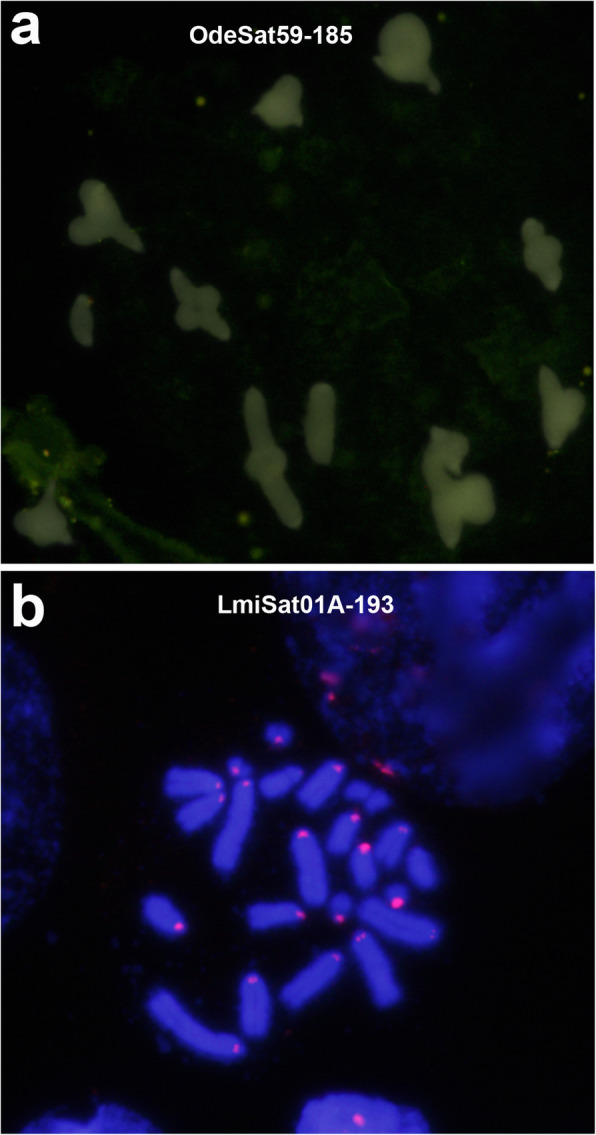
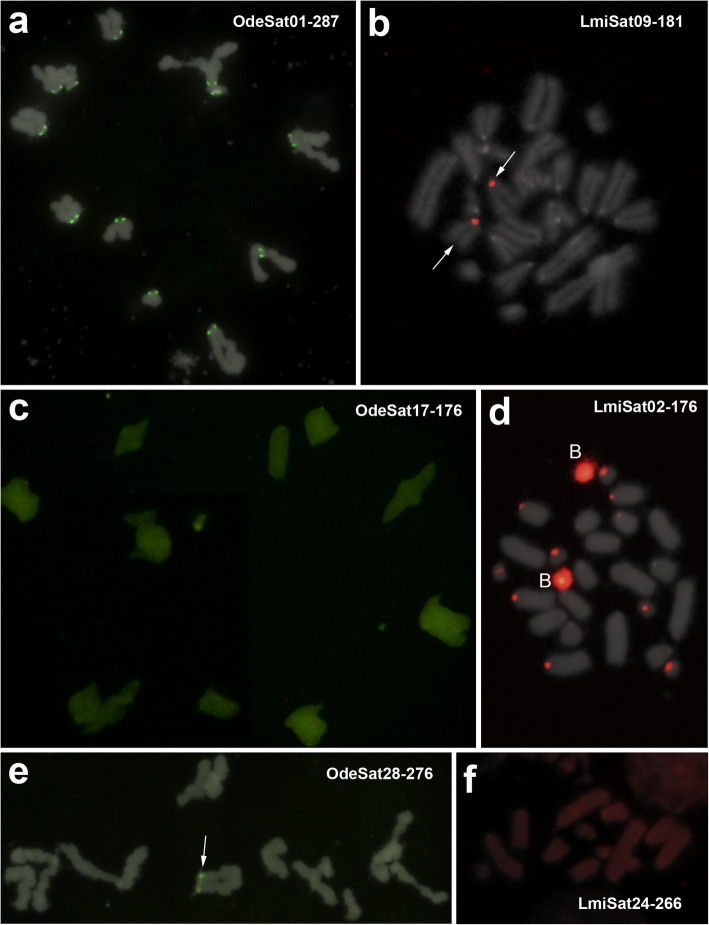
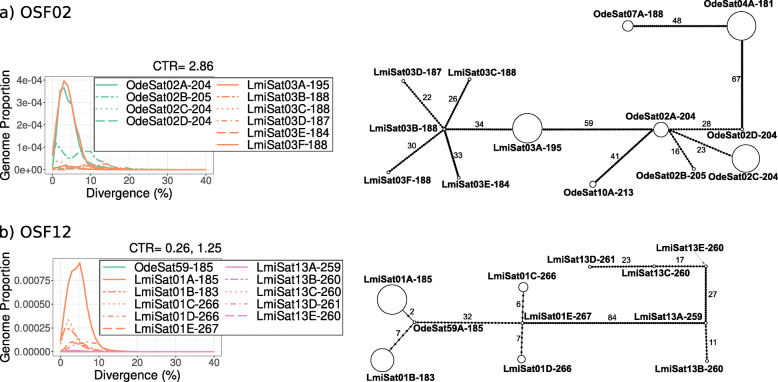
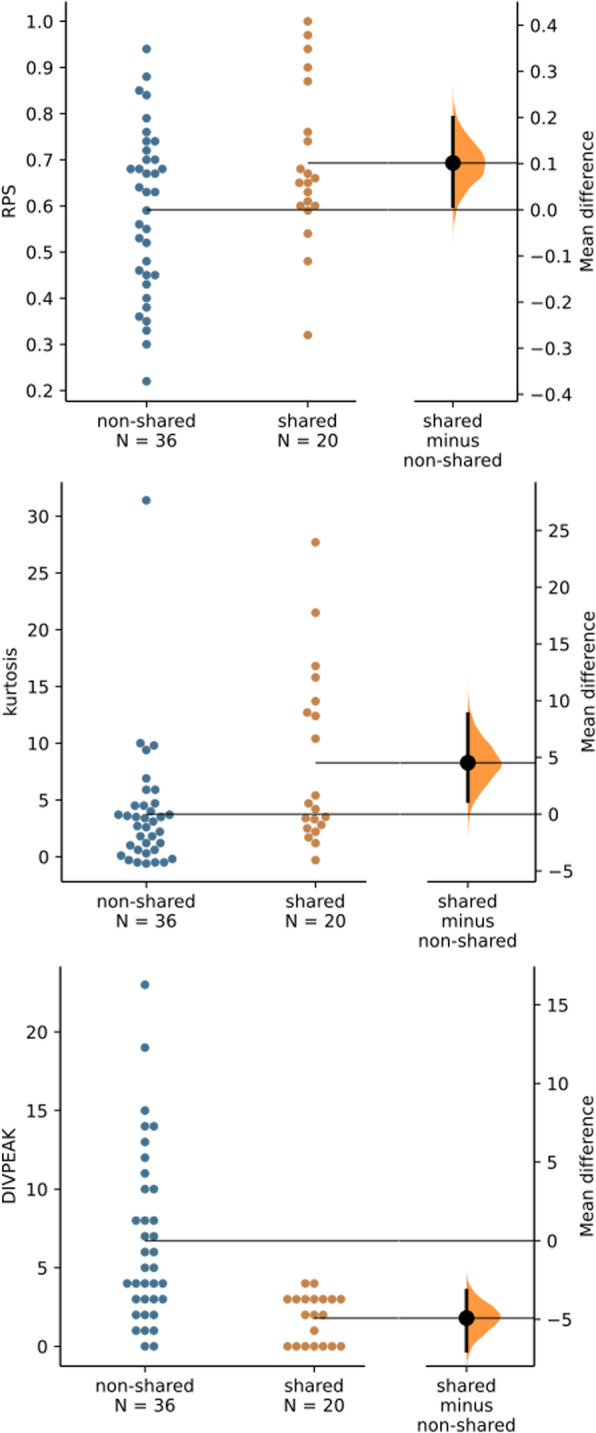
Results: We found that about one third of their satDNA families (near 60 in every species) showed sequence homology and were grouped into 12 orthologous superfamilies. The turnover rate of consensus sequences was extremely variable among the 20 orthologous family pairs analyzed in both species. The satDNAs shared by both species showed poor association with sequence signatures and motives frequently argued as functional, except for short inverted repeats allowing short dyad symmetries and non-B DNA conformations. Orthologous satDNAs frequently showed different FISH patterns at both intra- and interspecific levels. We defined indices of homogenization and degeneration and quantified the level of incomplete library sorting between species.
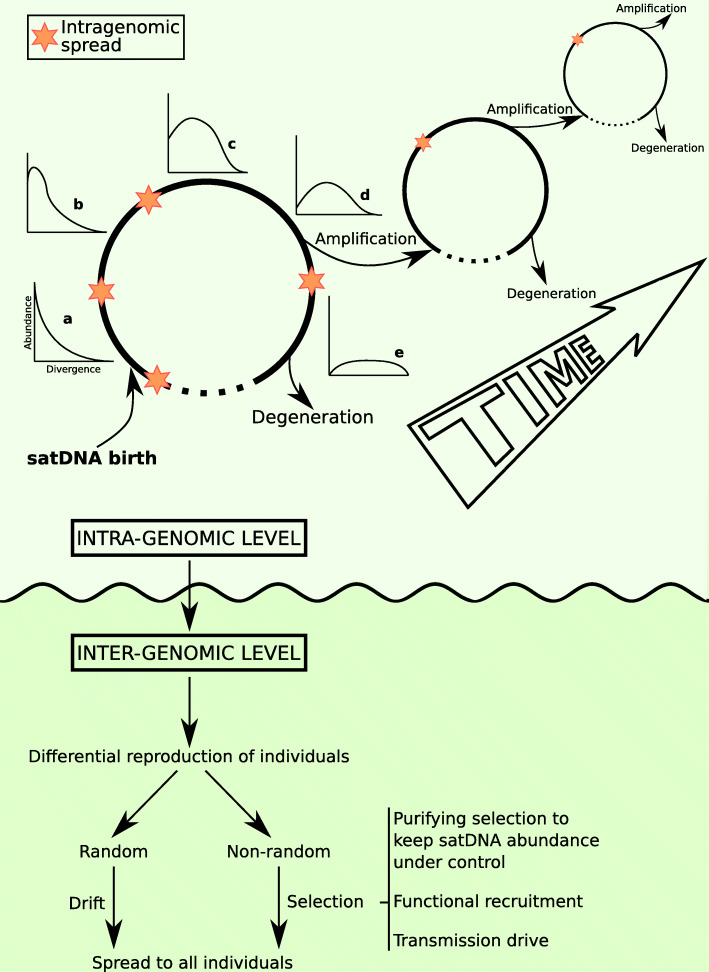
Conclusions: Our analyses revealed that satDNA degenerates through point mutation and homogenizes through partial turnovers caused by massive tandem duplications (the so-called satDNA amplification). Remarkably, satDNA amplification increases homogenization, at intragenomic level, and diversification between species, thus constituting the basis for concerted evolution. We suggest a model of satDNA evolution by means of recursive cycles of amplification and degeneration, leading to mostly contingent evolutionary pathways where concerted evolution emerges promptly after lineages split.
Keywords: Cytogenomics; Library Hypothesis; Satellite DNA; Satellitome Evolution.
© 2021. The Author(s).
Conflict of interest statement
The authors declare that they have no competing interests.
Figures
Similar articles
-
Differential amplification and contraction of satellite DNAs in the distinct lineages of the beetle Euchroma gigantea.Gene. 2024 Nov 15;927:148723. doi: 10.1016/j.gene.2024.148723. Epub 2024 Jun 22. Gene. 2024. PMID: 38914242
-
Eight Million Years of Satellite DNA Evolution in Grasshoppers of the Genus Schistocerca Illuminate the Ins and Outs of the Library Hypothesis.Genome Biol Evol. 2020 Mar 1;12(3):88-102. doi: 10.1093/gbe/evaa018. Genome Biol Evol. 2020. PMID: 32211863 Free PMC article.
-
Satellitome analyses in nematodes illuminate complex species history and show conserved features in satellite DNAs.BMC Biol. 2022 Nov 18;20(1):259. doi: 10.1186/s12915-022-01460-7. BMC Biol. 2022. PMID: 36397071 Free PMC article.
-
The Genomics of Plant Satellite DNA.Prog Mol Subcell Biol. 2021;60:103-143. doi: 10.1007/978-3-030-74889-0_5. Prog Mol Subcell Biol. 2021. PMID: 34386874 Review.
-
Satellite DNA in insects: a review.Heredity (Edinb). 2008 Jun;100(6):564-73. doi: 10.1038/hdy.2008.24. Epub 2008 Apr 16. Heredity (Edinb). 2008. PMID: 18414505 Review.
Cited by
-
Tandem Repeat DNA Provides Many Cytological Markers for Hybrid Zone Analysis in Two Subspecies of the Grasshopper Chorthippus parallelus.Genes (Basel). 2023 Feb 3;14(2):397. doi: 10.3390/genes14020397. Genes (Basel). 2023. PMID: 36833324 Free PMC article.
-
Satellite DNAs-From Localized to Highly Dispersed Genome Components.Genes (Basel). 2023 Mar 17;14(3):742. doi: 10.3390/genes14030742. Genes (Basel). 2023. PMID: 36981013 Free PMC article. Review.
-
Dominance of transposable element-related satDNAs results in great complexity of "satDNA library" and invokes the extension towards "repetitive DNA library".Mar Life Sci Technol. 2024 Apr 11;6(2):236-251. doi: 10.1007/s42995-024-00218-0. eCollection 2024 May. Mar Life Sci Technol. 2024. PMID: 38827134 Free PMC article.
-
Satellite DNAs and the evolution of the multiple X1X2Y sex chromosomes in the wolf fish Hoplias malabaricus (Teleostei; Characiformes).Sci Rep. 2024 Sep 2;14(1):20402. doi: 10.1038/s41598-024-70920-7. Sci Rep. 2024. PMID: 39223262 Free PMC article.
-
Investigating the diversification of holocentromeric satellite DNA Tyba in Rhynchospora (Cyperaceae).Ann Bot. 2023 May 15;131(5):813-825. doi: 10.1093/aob/mcad036. Ann Bot. 2023. PMID: 36815646 Free PMC article.
References
Publication types
MeSH terms
Substances
LinkOut - more resources
Full Text Sources
