. 2022 Feb 8:11:e73926.
doi: 10.7554/eLife.73926.

Reversing chemorefraction in colorectal cancer cells by controlling mucin secretion

Affiliations

Reversing chemorefraction in colorectal cancer cells by controlling mucin secretion

Gerard Cantero-Recasens et al. Elife. .

Abstract

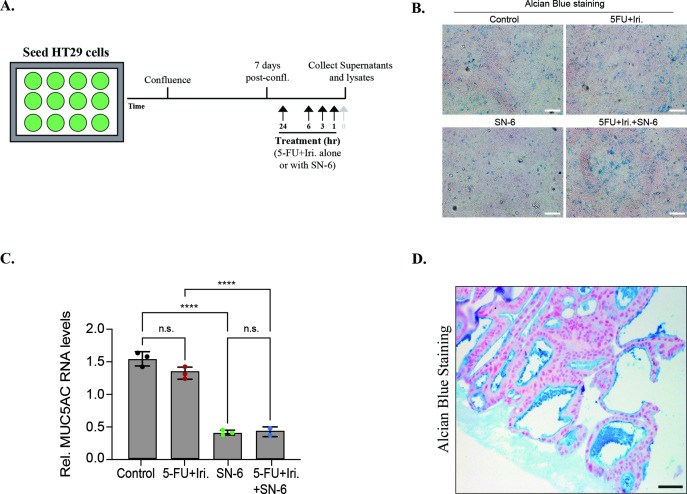
Fifteen percent of colorectal cancer (CRC) cells exhibit a mucin hypersecretory phenotype, which is suggested to provide resistance to immune surveillance and chemotherapy. We now formally show that CRC cells build a barrier to chemotherapeutics by increasing mucins' secretion. We show that low levels of KChIP3, a negative regulator of mucin secretion (Cantero-Recasens et al., 2018), is a risk factor for CRC patients' relapse in a subset of untreated tumours. Our results also reveal that cells depleted of KChIP3 are four times more resistant (measured as cell viability and DNA damage) to chemotherapeutics 5-fluorouracil + irinotecan (5-FU+iri.) compared to control cells, whereas KChIP3-overexpressing cells are 10 times more sensitive to killing by chemotherapeutics. A similar increase in tumour cell death is observed upon chemical inhibition of mucin secretion by the sodium/calcium exchanger (NCX) blockers (Mitrovic et al., 2013). Finally, sensitivity of CRC patient-derived organoids to 5-FU+iri. increases 40-fold upon mucin secretion inhibition. Reducing mucin secretion thus provides a means to control chemoresistance of mucinous CRC cells and other mucinous tumours.

Keywords: 5-FU+iri.; KChIP3; cell biology; chemoresistance; chemotherapy; colorectal cancer; human; mucins.


Conflict of interest statement

GC, JA, TL, MG, MI, LE No competing interests declared, VM Senior editor, eLife

Figures

Figure 1.
Figure 1.. Mucins in colorectal cancer.
(A) Cell lysates from differentiated HT29-M6 cells treated with 5-fluorouracil + irinotecan (5-FU + iri.) (50 µg/mL 5-FU + 20 µg/mL iri.) for 24 hr were analysed by Western blot with an anti-MUC5AC to test expression levels. Tubulin was used as a loading control. (B) Immunofluorescence Z-stack projections of differentiated HT29-M6 cells treated with vehicle (control) or 5-FU + iri. (50 µg/mL 5-FU + 20 µg/mL irinotecan) for 24 hr. Cells were stained with anti-MUC5AC (red) and DAPI (blue). Scale bar = 50 µm. (C) Differentiated HT29 cells were treated with 100 µM ATP for 30 min, washed extensively (upper panel) or smoothly (lower panel), and incubated with Alexa Fluor 488-labelled albumin for 1 hr. Cells were stained with anti-MUC5AC antibody (red) and DAPI (blue). In the orthogonal view, dotted lines across the images demarcate the top surface of the cell. Scale bars correspond to 5 µm. (D) Colocalization between MUC5AC and albumin was calculated from immunofluorescence images by Manders’ coefficient using Fiji. Average values ± SEM are plotted as scatter plot with bar graph. The y-axis represents Manders’ coefficient of the fraction of albumin overlapping with MUC5AC (N ≥ 3). (E) Consensus molecular subtype (CMS) distribution of high and low MUC5AC-expressing colorectal tumours (Jorissen cohort). (F) Disease-free survival (DFS) of colorectal cancer patients with high (n = 73) or low (n = 153) MUC5AC levels (Jorissen cohort). NOLBL: samples without a defined CMS subtype (tumours with no label). *p<0.05, **p<0.01.
Figure 1—figure supplement 1.
Figure 1—figure supplement 1.. Experimental design for measuring mucin production after treatment.
(A) Schematic diagram of the experimental set-up to measure mucin production after 5-fluorouracil + irinotecan (5-FU + iri.) treatment.
Figure 2.
Figure 2.. KChIP3 is a prognostic marker of colorectal cancer (CRC).
(A–C) Disease-free survival (DFS) according to KChIP3 levels of CRC patients (low KChIP3 levels, n = 120; high KChIP3 levels, n = 106) (A), CRC patients with high MUC5AC levels (low KChIP3 levels, n = 39; high KChIP3 levels, n = 34) (B), or CRC with low MUC5AC levels (low KChIP3 levels, n = 81; high KChIP3 levels, n = 72) (C). (D) Differentiated control (black), KChIP3-overexpressing cells (KCNIP3-OV, blue) and KChIP3-depleted cells (KCNIP3-KD, red) were treated for 72 hr with increasing concentrations of 5-fluorouracil + irinotecan (5-FU + iri.). Average values ± SEM are plotted as scatter plot (N > 3). The y-axis represents the percentage of cell growth relative to the lowest concentration of 5-FU + iri. The IC50 was calculated from the interpolated curve. HR, hazard ratio. *p<0.05, **p<0.01.
Figure 2—figure supplement 1.
Figure 2—figure supplement 1.. Expression of mucins in patients.
(A) Expression levels of secreted mucins MUC2, MUC5AC, MUC5B, MUC6, MUC7, and MUC19. Each dot represents a different patient. Patients GSM358532, GSM358535, and GSM358538 are highlighted in green, blue, and red, respectively. (B) Disease-free survival (DFS) of colorectal cancer patients with high (n = 73) or low (n = 153) MUC2 levels (Jorissen cohort). (C) DFS according to KChIP3 levels of colorectal cancer patients with high MUC2 expression (low KChIP3 levels, n = 27; high KChIP3 levels, n = 30).
Figure 3.
Figure 3.. Inhibition of sodium/calcium exchangers (NCXs) enhances cell death by 5-fluorouracil + irinotecan (5-FU+ iri.).
(A) Comet assay of HT29-M6 cell line treated with 5-FU + iri. (25 µg/mL 5-FU + 10 µg/mL irinotecan) and 20 µM benzamil, alone or in combination. The tail moment was measured after 72 hr of treatment (N > 3). (B) Quantification of cell viability in HT29-M6 cell line after treatment (24 or 72 hr) with 5-FU + iri. (10 µg/mL 5-FU + 4 µg/mL Irinotecan) and 20 µM benzamil, alone or in combination (N ≥ 3). (C) Immunofluorescence Z-stack projections of differentiated HT29-M6 cells treated with vehicle, 20 µM benzamil, or 10 µM SN-6 in the presence or absence of 5-FU + iri. Cells were stained with anti-MUC5AC (green), phalloidin (red), and DAPI (blue). Scale bar = 5 µm. (D) Quantification of the number (upper graph) and volume (lower graph) of MUC5AC granules from immunofluorescence images by confocal microscope. Average values ± SEM are plotted as scatter plot with bar graph (N ≥ 3). Veh., vehicle; Benz., benzamil. *p<0.05, **p<0.01.
Figure 4.
Figure 4.. SN-6 treatment increases sensitivity of colorectal cancer (CRC)-derived cells and organoids to 5-fluorouracil + irinotecan (5-FU + iri.).
(A) Cell lysates and secreted medium of differentiated HT29-M6 cells pre-treated with a vehicle or 10 µM SN-6 inhibitor for 24 hr and then exposed to 5-FU + iri. (50 µg/mL 5-FU + 20 µg/mL iri.) for 0, 1, 3, 6, and 24 hr were analysed by Western blot with an anti-MUC5AC, anti-γH2A.X, and H3 to test their levels. Tubulin was used as a loading control. Quantification of MUC5AC and γH2A.X is included (N ≥ 3). (B) Immunofluorescence images of differentiated HT29-M6 cells treated with vehicle (control) or 10 µM SN-6 in the presence or absence of 5-FU + iri. (50 µg/mL 5-FU + 20 µg/mL irinotecan) for 24 hr. Cells were stained with anti-MUC5AC (red), anti-γH2A.X (green), and DAPI (blue). Scale bar = 50 µm. (C) Quantification of the number of γH2A.X-positive cells in the different conditions relative to the total number of cells from the immunofluorescence images (N ≥ 3). (D) CRC patient-derived organoids (PDOs) were treated for 72 hr with increasing concentrations of 5-FU + iri. with vehicle or 10 µM SN-6. Average values ± SEM are plotted as scatter plot. The y-axis represents the percentage of cell growth relative to the lowest concentration of 5-FU + iri. The IC50 was calculated from the interpolated curve (N ≥ 3). *p<0.05, **p<0.01.
Figure 4—figure supplement 1.
Figure 4—figure supplement 1.. Mucins’ levels in HT29 cells and in a patient-derived organoid.
(A) Schematic diagram of the experimental set-up to measure mucin secretion and production. (B) Representative images of HT29-M6 differentiated cell (vehicle [control], 5-fluorouracil + irinotecan [5-FU+ iri.], SN-6, and 5-FU + iri. + SN-6) stained with Alcian blue. Scale bar = 50 µm. (C) Relative MUC5AC RNA levels in HT29-M6 treated with vehicle (control), 5-FU + iri., SN-6, and 5-FU + iri. + SN-6 (N = 3). (D) Alcian blue-stained patient-derived organoid to visualize external mucins (in blue). Scale bar = 50 µm.

References

    1. Abdullah LH, Conway JD, Cohn JA, Davis CW. Protein kinase C and Ca2+ activation of mucin secretion in airway goblet cells. The American Journal of Physiology. 1997;273:L201–L210. doi: 10.1152/ajplung.1997.273.1.L201. - DOI - PubMed
    1. Adler KB, Tuvim MJ, Dickey BF. Regulated mucin secretion from airway epithelial cells. Frontiers in Endocrinology. 2013;4:129. doi: 10.3389/fendo.2013.00129. - DOI - PMC - PubMed
    1. Bolte S, Cordelières FP. A guided tour into subcellular colocalization analysis in light microscopy. Journal of Microscopy. 2006;224:213–232. doi: 10.1111/j.1365-2818.2006.01706.x. - DOI - PubMed
    1. Cantero-Recasens G, Butnaru CM, Valverde MA, Naranjo JR, Brouwers N, Malhotra V. KChIP3 coupled to Ca2+ oscillations exerts a tonic brake on baseline mucin release in the colon. eLife. 2018;7:e39729. doi: 10.7554/eLife.39729. - DOI - PMC - PubMed
    1. Cantero-Recasens G, Butnaru CM, Brouwers N, Mitrovic S, Valverde MA, Malhotra V. Sodium channel TRPM4 and sodium/calcium exchangers (NCX) cooperate in the control of Ca2+-induced mucin secretion from goblet cells. The Journal of Biological Chemistry. 2019;294:816–826. doi: 10.1074/jbc.RA117.000848. - DOI - PMC - PubMed

Publication types

Associated data