. 2022 Apr 15:488:44-59.
doi: 10.1016/j.neuroscience.2022.01.029. Epub 2022 Feb 4.

Structural and Functional Plasticity in the Dorsolateral Geniculate Nucleus of Mice following Bilateral Enucleation

Affiliations

Structural and Functional Plasticity in the Dorsolateral Geniculate Nucleus of Mice following Bilateral Enucleation

Ashish Bhandari et al. Neuroscience. .

Abstract

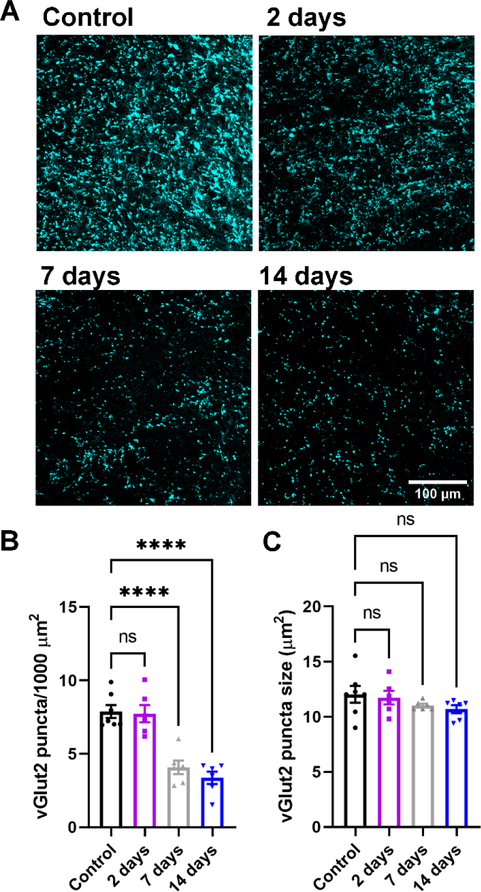
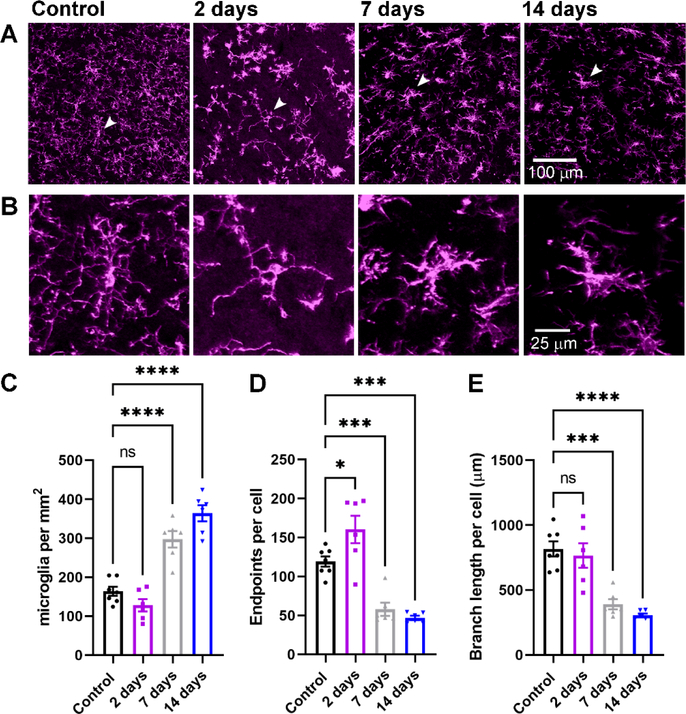
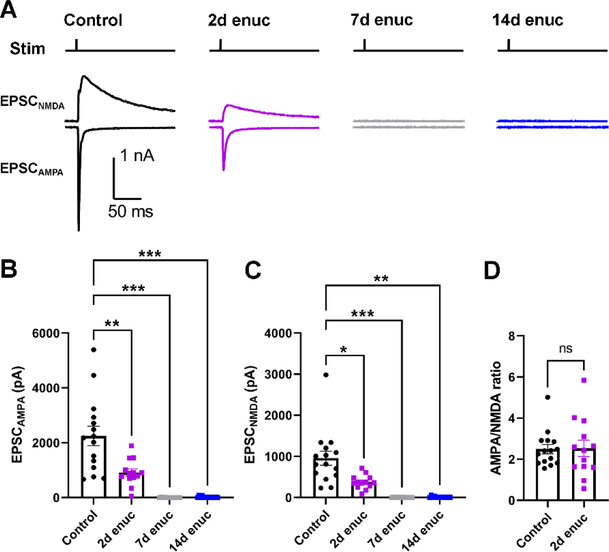
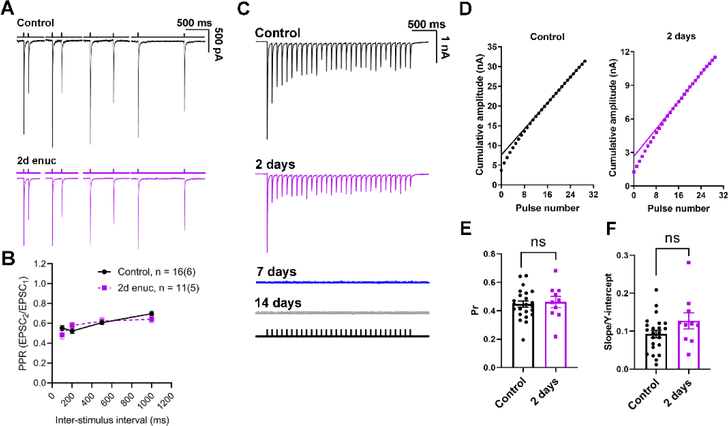
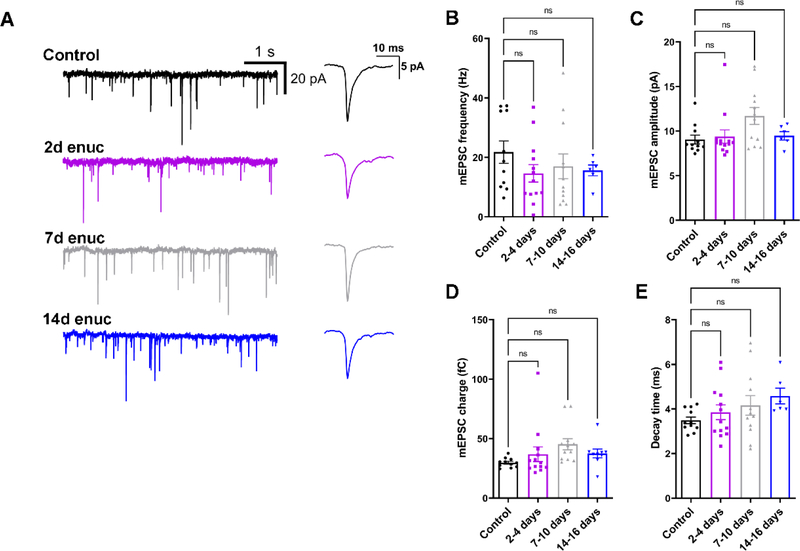
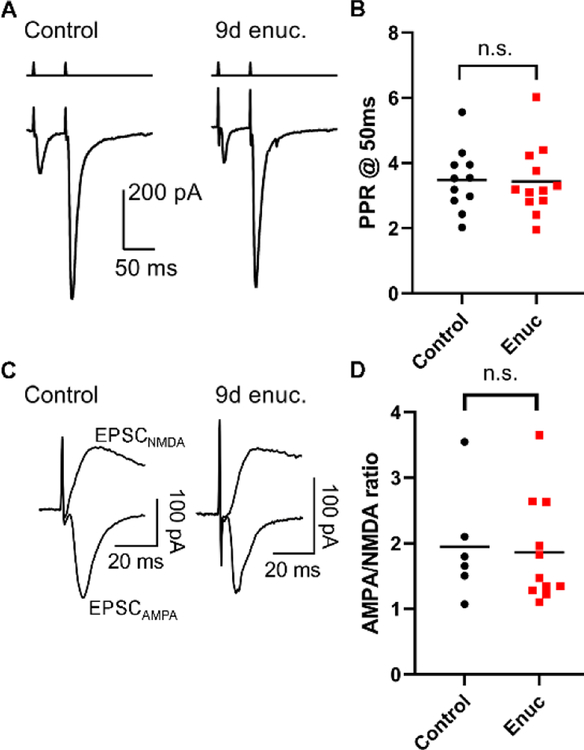
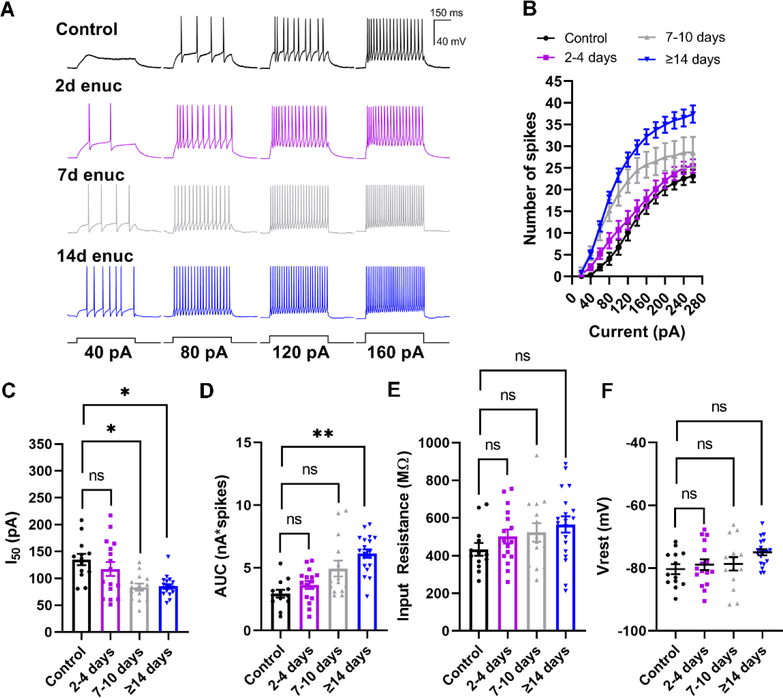
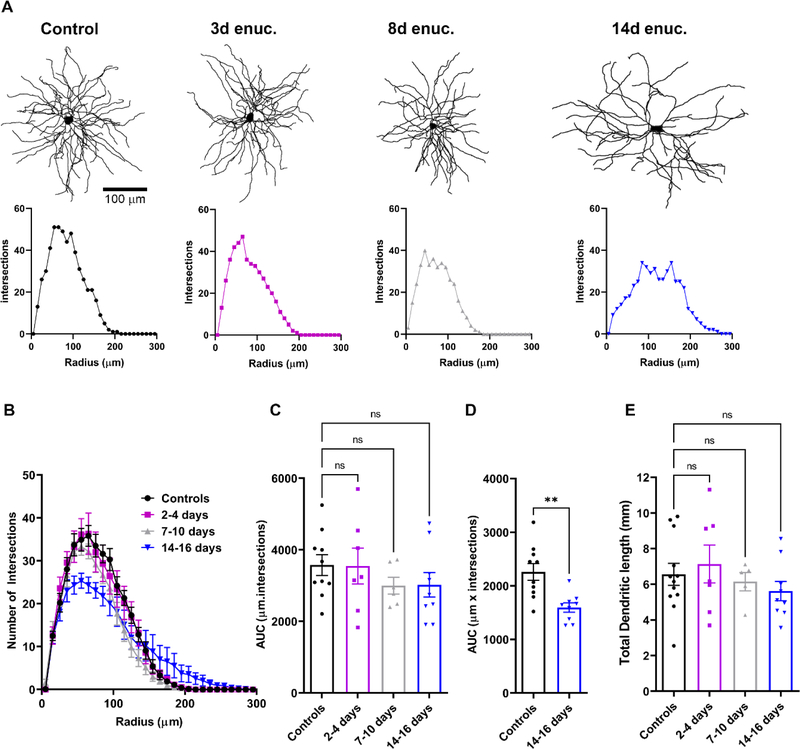
Within the nervous system, plasticity mechanisms attempt to stabilize network activity following disruption by injury, disease, or degeneration. Optic nerve injury and age-related diseases can induce homeostatic-like responses in adulthood. We tested this possibility in the thalamocortical (TC) neurons in the dorsolateral geniculate nucleus (dLGN) using patch-clamp electrophysiology, optogenetics, immunostaining, and single-cell dendritic analysis following loss of visual input via bilateral enucleation. We observed progressive loss of vGlut2-positive retinal terminals in the dLGN indicating degeneration post-enucleation that was coincident with changes in microglial morphology indicative of microglial activation. Consistent with the decline of vGlut2 puncta, we also observed loss of retinogeniculate (RG) synaptic function assessed using optogenetic activation of RG axons while performing whole-cell voltage clamp recordings from TC neurons in brain slices. Surprisingly, we did not detect any significant changes in the frequency of miniature post-synaptic currents (mEPSCs) or corticothalamic feedback synapses. Analysis of TC neuron dendritic structure from single-cell dye fills revealed a gradual loss of dendrites proximal to the soma, where TC neurons receive the bulk of RG inputs. Finally, analysis of action potential firing demonstrated that TC neurons have increased excitability following enucleation, firing more action potentials in response to depolarizing current injections. Our findings show that degeneration of the retinal axons/optic nerve and loss of RG synaptic inputs induces structural and functional changes in TC neurons, consistent with neuronal attempts at compensatory plasticity in the dLGN.

Keywords: bilateral enucleation; dLGN; excitability; intrinsic plasticity; retinogeniculate synapse; thalamocortical.


Conflict of interest statement

Declaration of interest: none.

Figures

Figure 1.
Figure 1.. Loss of vGlut2-positive RGC terminals in the dLGN following enucleation.
A) Single 2-photon optical sections of vGlut2 immunofluorescence staining from the dLGN following enucleation. B&C) Quantification of vGlut2 puncta density (B) and size (C). Each data point in C represents the median vGlut2 punctum size from an individual mouse. ****p<0.0001, Dunnett’s multiple comparison test. ns, not significant (p>0.05).
Figure 2.
Figure 2.. Evidence for microglia activation following bilateral enucleation.
A) Maximum intensity projection of the dLGN stained with an anti-Iba1 antibody to label microglia. B) Higher magnification images of the individual microglia identified by arrows in the images in A. C) Quantification of microglia cell body density in the dLGN. D) Quantification of microglia endpoints per cell. E) Quantification of microglia branch length per cell. *p<0.05, ***p<0.005, ****p<0.0001, Dunnett’s multiple comparison test. Control n = 7 mice; 2 days n = 6 mice; 7 days n = 6 mice; 14 days n = 6 mice.
Figure 3.
Figure 3.. Loss of retinogeniculate synaptic function following enucleation.
A) Representative traces of EPSCs recorded from the TC neurons in response to optogenetic stimulation of RGC axons from Chx10-Cre;Ai32 mice. AMPA receptor-mediated excitatory post-synaptic currents (EPSCAMPA) were recorded at −70 mV while NMDA receptor-mediated EPSCs (EPSCNMDA) were recorded at +40 mV. The stimulus timing is marked above the traces (“Stim”). B) Quantification of EPSCAMPA amplitudes measured at the EPSC peak. C) Quantification of EPSCNMDA, measured 20 ms post-stimulus. Control n = 21 cells from 7 mice; 2d enuc n = 13 cells from 4 mice; 7 d enuc n = 10 cell 4 mice; 14d enuc n = 9 cells 3 mice. *p<0.05, **p<0.01, ***p<0.005, nested one-way ANOVA with Dunnett’s multiple comparison test. D) AMPA/NMDA ratio for control and 2-day post-enucleation recordings. (n.s., p>0.05, nested t-test).
Figure 4.
Figure 4.. Presynaptic vesicle release probability at the retinogeniculate synapse does not change in response to bilateral enucleation.
A) Example traces of EPSCs recorded in TC neurons in response to pairs of stimuli applied to stimulate the RGC axons spaced at different time intervals (100 ms, 200 ms, 500 ms, and 1000 ms). The bathing solution was supplemented with γDGG (200 μM) and cyclothiazide (100 μM). B) Plot of paired pulse ratio at different stimulus intervals. Sample sizes are number of cells and (mice). There was no significant difference between control and enucleated at any time interval (nested t-test). C) Representative examples of excitatory post-synaptic current responses of TC neurons to a 10 Hz stimulus train at different time points following bilateral enucleation. The stimulus marker is shown below the traces. D) Cumulative EPSC amplitudes plotted against stimulus number with a linear fit of 15th to 30th data points extrapolated to the Y-axis. There was no detectable response at 7- or 14-day time points E) Quantification of release probability (Pr), measured as the ratio of the first EPSC to the Y-intercept. No significant difference was observed in the presynaptic vesicle release probability between the control (n = 23 cells from 7 mice) and the enucleated cohort at 2-days post enucleation (n = 10 cells from 4 mice, nested t-test). F) Slope of the linear fit, taken as a measure of vesicle pool replenishment rate and normalized to account for relative changes in EPSC size, was not significantly different between control and 2d post-enucleation (p>0.05, nested t-test).
Figure 5.
Figure 5.. Bilateral enucleation does not alter single-vesicle post-synaptic current properties in the dLGN.
A) Representative traces of mEPSCs recorded from dLGN TC neurons in control and enucleated animals in the absence of stimulation. Waveforms of average detected events are shown to the right. B) mEPSC frequency was not significantly altered following bilateral enucleation (nested ANOVA and Dunnett’s multiple comparison test). C) Quantification of mEPSC amplitude following enucleation. D) mEPSC charge was not significantly affected following enucleation. E) mEPSC decay kinetics were not significantly changed following enucleation. Control n = 11 cells from 5 mice; 2d enuc n = 13 cells from 8 mice; 7d enuc n = 12 cells 7 mice; 14d enuc n = 6 cells 4 mice.
Figure 6.
Figure 6.. Bilateral enucleation does not alter short term plasticity or post-synaptic receptor complement at corticothalamic feedback synapses.
A) Representative traces of excitatory post-synaptic currents (EPSCs) recorded in dLGN TC neurons in response to corticothalamic tract stimulation in parasagittal slices. Paired stimuli were separated by 50 ms. B) Quantification of paired pulse ratio (PPR) in recordings from control mice (n = 11 cells, 3 mice) and 8–9 days post-enucleation (n = 12 cell, 4 mice) shows that PPR was not significantly different between groups (p>0.05, nested t-test). C) Representative AMPA receptor- and NMDA receptor-mediated EPSCs recorded at −70 mV and +40 mV in response to corticothalamic tract stimulation. D) The AMPA/NMDA ratio at corticothalamic synapses was not significantly altered in mice at 8–9d post-enucleation (p>0.05, nested t-test).
Figure 7.
Figure 7.. Bilateral enucleation increases the excitability of TC neurons.
A) Whole-cell current-clamp recordings from TC neurons in response to 500-ms depolarizing current stimuli. B) Analysis of spiking data from TC neurons demonstrating enhanced excitability following enucleation. The number of evoked spikes were counted during the 500-ms stimulus and plotted against stimulus strength (Current). C and D) Analysis of the half-maximal current (I50) area under the curve (AUC) obtained from individual sigmoid fits. C) There was a significant reduction (leftward shift) in the I50 at 7–10-days and 14–16-days. D) There was significant increase in area under the curve at 7–10-days and 14–16-days post-enucleation. E) Input resistance, measured using the voltage deflection to a −20 pA current stimulus, was not significantly different between groups. F) Measurement of resting membrane potential (Vrest) from the TC neurons showed no significant change in the Vrest between TC neurons from control animals and the enucleated cohort. *p<0.05, **p<0.01, Dunnett’s multiple comparison post-hoc test. Control n = 13 cells 7 mice; 2–4d enuc. n = 14 cells 7 mice; 7–10d enuc. n = 14 cells 8 mice; 14d enuc. n = 19 cells 9 mice.
Figure 8.
Figure 8.. Reduction in dendritic complexity of TC neurons following bilateral enucleation.
A) Examples of dendritic reconstructions of Neurobiotin-filled TC neurons (upper panels) from control animals and enucleated cohorts and corresponding individual Sholl analysis plots (lower panels). B) Sholl analysis plot showing the number of dendritic intersections with distance from the soma. Analysis of area under the curve (AUC) obtained from the Sholl plot did not reveal any statistically significant differences between the dendritic structure (C, n.s. p>0.05 Dunnett’s multiple comparison). However, when the area under the curve for the dendritic structure between 35–105 μm away from the TC neuron somata (D), there was a notable decrease in the dendritic complexity at 14–16 days compared to controls (**p<0.01, unpaired t-test). E) There was no significant change in the total dendritic length of TC neurons in all animals (n.s. p>0.05 Dunnett’s multiple comparison).

References

    1. Abbott LF, Nelson SB (2000) Synaptic plasticity: taming the beast. Nat Neurosci 3:1178–1183. - PubMed
    1. Araújo SES, Mendonça HR, Wheeler NA, Campello-Costa P, Jacobs KM, Gomes FCA, Fox MA, Fuss B (2017) Inflammatory demyelination alters subcortical visual circuits. J Neuroinflammation 14:162. - PMC - PubMed
    1. Arganda-Carreras I, Fernández-González R, Muñoz-Barrutia A, Ortiz-De-Solorzano C (2010) 3D reconstruction of histological sections: Application to mammary gland tissue. Microscopy Research and Technique 73:1019–1029. - PubMed
    1. Beck H, Yaari Y (2008) Plasticity of intrinsic neuronal properties in CNS disorders. Nat Rev Neurosci 9:357–369. - PubMed
    1. Bhandari A, Smith JC, Zhang Y, Jensen AA, Reid L, Goeser T, Fan S, Ghate D, Van Hook MJ (2019) Early-Stage Ocular Hypertension Alters Retinal Ganglion Cell Synaptic Transmission in the Visual Thalamus. Front Cell Neurosci 13:426. - PMC - PubMed

Publication types