. 2022 Jul;77(1):71-83.
doi: 10.1016/j.jhep.2022.01.020. Epub 2022 Feb 5.

Interruption of bile acid uptake by hepatocytes after acetaminophen overdose ameliorates hepatotoxicity

Affiliations

Interruption of bile acid uptake by hepatocytes after acetaminophen overdose ameliorates hepatotoxicity

Ahmed Ghallab et al. J Hepatol. 2022 Jul.

Abstract

Background & aims: Acetaminophen (APAP) overdose remains a frequent cause of acute liver failure, which is generally accompanied by increased levels of serum bile acids (BAs). However, the pathophysiological role of BAs remains elusive. Herein, we investigated the role of BAs in APAP-induced hepatotoxicity.

Methods: We performed intravital imaging to investigate BA transport in mice, quantified endogenous BA concentrations in the serum of mice and patients with APAP overdose, analyzed liver tissue and bile by mass spectrometry and MALDI-mass spectrometry imaging, assessed the integrity of the blood-bile barrier and the role of oxidative stress by immunostaining of tight junction proteins and intravital imaging of fluorescent markers, identified the intracellular cytotoxic concentrations of BAs, and performed interventions to block BA uptake from blood into hepatocytes.

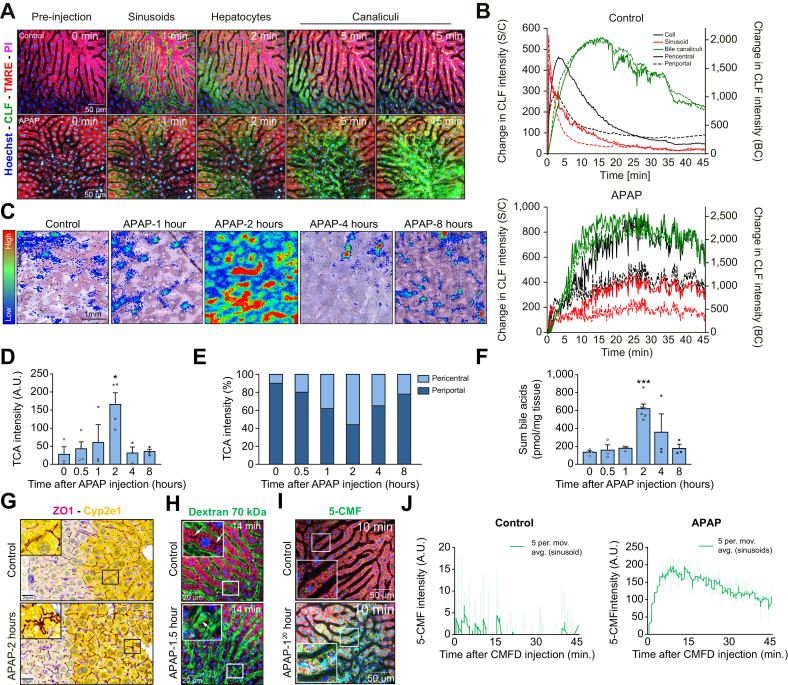
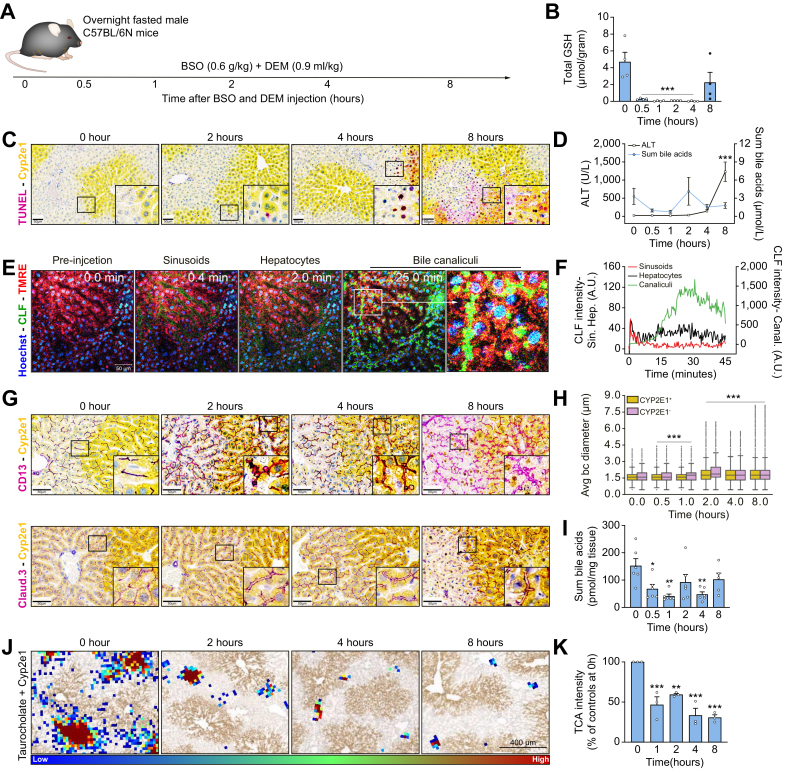
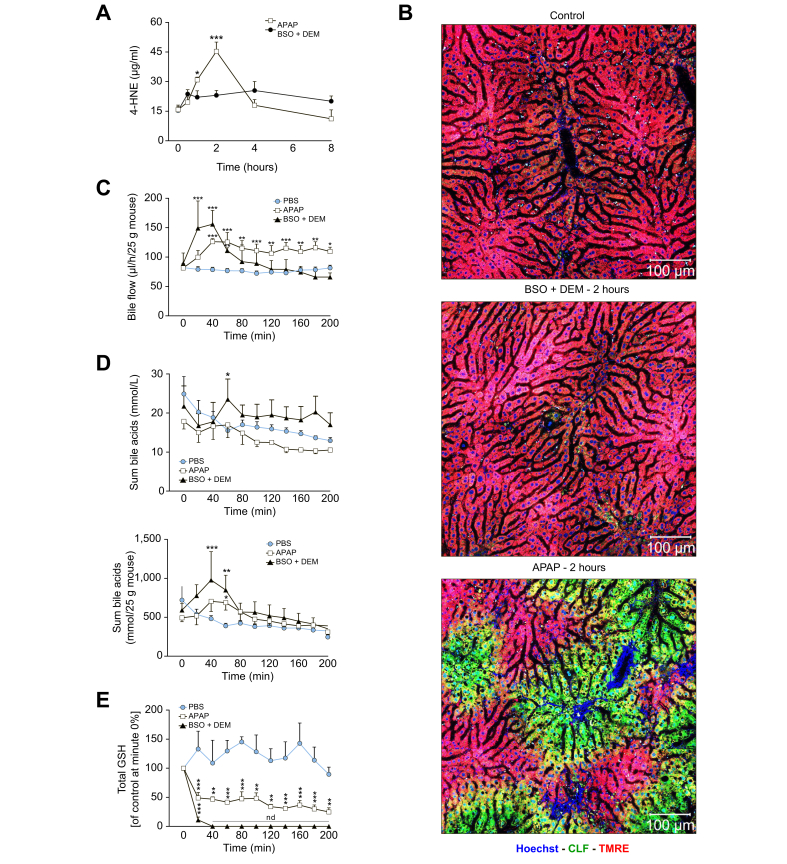
Results: Prior to the onset of cell death, APAP overdose causes massive oxidative stress in the pericentral lobular zone, which coincided with a breach of the blood-bile barrier. Consequently, BAs leak from the bile canaliculi into the sinusoidal blood, which is then followed by their uptake into hepatocytes via the basolateral membrane, their secretion into canaliculi and repeated cycling. This, what we termed 'futile cycling' of BAs, led to increased intracellular BA concentrations that were high enough to cause hepatocyte death. Importantly, however, the interruption of BA re-uptake by pharmacological NTCP blockage using Myrcludex B and Oatp knockout strongly reduced APAP-induced hepatotoxicity.

Conclusions: APAP overdose induces a breach of the blood-bile barrier which leads to futile BA cycling that causes hepatocyte death. Prevention of BA cycling may represent a therapeutic option after APAP intoxication.

Lay summary: Only one drug, N-acetylcysteine, is approved for the treatment of acetaminophen overdose and it is only effective when given within ∼8 hours after ingestion. We identified a mechanism by which acetaminophen overdose causes an increase in bile acid concentrations (to above toxic thresholds) in hepatocytes. Blocking this mechanism prevented acetaminophen-induced hepatotoxicity in mice and evidence from patients suggests that this therapy may be effective for longer periods after ingestion compared to N-acetylcysteine.

Keywords: APAP; acute liver failure; blood-bile barrier; intravital imaging; tight junctions.


Conflict of interest statement

Conflict of interest S.U. is holder and inventor on patents protecting Myrcludex B (Hepcludex/bulevirtide). All other authors declare that they have no conflict of interest. Please refer to the accompanying ICMJE disclosure forms for further details.

Figures

None
Graphical abstract
Fig. 1
Fig. 1
Blood BA concentrations and transaminase activities in relation to APAP-induced hepatotoxicity. (A,B) ALT activity and sum of BA concentrations in plasma of APAP-intoxicated patients in whom the period between overdose and blood sampling was unkown. Patients were grouped by their combination of ALT and BA levels. (C) Time-resolved analysis of the sum of blood BA concentrations and ALT activity of a 19-year-old woman after APAP overdose. Dashed baselines: reference values in healthy individuals. (D) Experimental design. (E) Sum of BA concentrations and ALT in heart blood after APAP overdose in mice (mean and SE of 4 mice per time point). (F,G) Staining of Cyp2e1 plus TUNEL as well as cleaved caspase-3 in liver tissue after APAP overdose. ∗∗p <0.01, Dunnett's multiple comparisons test. ALT, alanine transaminase; Cl. Caspase-3, cleaved caspase-3; TUNEL, Terminal deoxynucleotidyl transferase dUTP nick end labeling. (This figure appears in color on the web.)
Fig. 2
Fig. 2
Dilatation and blebbing of BC after APAP overdose. (A) Intravital imaging after APAP intoxication. Red: mitochondrial activity (TMRE); green: bile acid analogue (CLF); blue: nuclear staining (Hoechst). (B) Quantification of the BC diameter in relation to its zonation in controls and mice 2 h after APAP overdose. (C) Stills from an intravital video that begins 85 min after APAP overdose to visualize the formation of BC blebs (corresponding to Video S1); (D) Quantification of number and area of active blebs; (E) CLF-associated intensity in pericentral and periportal hepatocytes. (F) Co-immunostaining of Cyp2e1 and CD13 before and after APAP overdose. (G) Quantification of the average BC diameter from immunostained sections (F) in the Cyp2e1 positive and negative lobular zones; ∗∗∗p <0.001, unpaired t test. (H) Canalicular blebs after APAP overdose visualized by immunostaining of CD13 of a mouse liver 2 h after APAP overdose. bc, bile canaliculi; CLF, Cholyl-Lysyl-Fluorescein; PI, propidium iodide; TMRE, Tetramethylrhodamine ethyl ester. (This figure appears in color on the web.)
Fig. 3
Fig. 3
Enrichment of BAs in the pericentral lobular zone after APAP intoxication. (A) Intravital imaging of CLF transport after bolus intravenous injection in healthy and in APAP-intoxicated (85 min after overdose corresponds to 0 min on the stills) mice (corresponding to Video S2). (B) Quantification of the CLF-associated signal in BC, hepatocytes, and sinusoids. Continuous lines indicate the pericentral and dashed lines the periportal lobular zones. (C) MALDI-MSI analysis of TCA superimposed onto Cyp2e1-immunostained adjacent liver tissue sections. (D) Quantification of the TCA intensity in the MALDI-MSI images. (E) TCA intensity in the periportal and pericentral lobular zones analyzed by MALDI-MSI. (F) Sum of BA concentrations in liver tissue at different intervals after APAP overdose. (G) Co-immunostaining of ZO1 and Cyp2e1. (H) Intravital imaging of livers of control and APAP-intoxicated mice after tail vein injection of fluorescein-coupled Dextran 70 kDa (green). The arrows indicate BC that appear green after APAP overdose but not in controls (corresponding to Video S3). (I) Intravital imaging of livers of control and APAP-intoxicated mice after bolus tail vein injection of CMFDA (corresponding to Video S4). (J) Quantification of the 5-CMF-associated signal in the sinusoids. ∗p <0.05, ∗∗∗p <0.001, Dunnett's multiple comparisons test (D, F). bc, bile canaliculi; CLF, Cholyl-Lysyl-Fluorescein; 5-CMF, 5-Chlormethylfluorescein; PI, propidium iodide; TCA, taurocholic acid; TMRE, Tetramethylrhodamine ethyl ester. (This figure appears in color on the web.)
Fig. 4
Fig. 4
Zonation of APAP-induced canalicular alterations and BA accumulation. (A) Experimental schedule. (B) Total GSH in homogenized liver tissue. (C) MALDI-MSI signals of GSH, APAP-GSH, and TCA superimposed onto an adjacent Cyp2e1-immunostained section at different periods after APAP overdose. (D-F) Quantification of MALDI-MSI signals in relation to the pericentral or periportal zone as evidenced by Cyp2e1 staining. Bar plots in B, D-F: mean and SE; dots indicate individual mice. ∗p <0.05, ∗∗p <0.01, ∗∗∗p <0.001, unpaired t test. GSH, glutathione; TCA, taurocholic acid. (This figure appears in color on the web.)
Fig. 5
Fig. 5
GSH depletion and canalicular dilatation after administration of BSO/DEM. (A) Experimental schedule. (B) Depletion of GSH in homogenized liver tissue. (C) Co-staining of Cyp2e1 and cell death by TUNEL. (D) ALT and sum of BA levels in blood. (E) Stills from an intravital video (Video S5) beginning 3 hours after BSO/DEM administration and quantification of the CLF signal (F) in sinusoids, hepatocytes, and canaliculi. (G) Co-staining of Cyp2e1, CD13 and the tight junction marker Claudin-3. (H) Quantification of the BC diameter in relation to the Cyp2e1-positive zone; p <0.001 (∗∗∗), unpaired t test. (I) Sum of BAs in liver tissue (mean and SE; dots indicate individual mice). (J) TCA signal of MALDI-MSI superimposed onto an adjacent Cyp2e1-stained section and quantification (K). ∗p <0.05, ∗∗p <0.01, ∗∗∗p <0.001, Dunnett's multiple comparisons test (I, K). ALT, alanine transaminase; bc, bile canaliculi; CLF, Cholyl-Lysyl-Fluorescein; GSH, glutathione; TCA, taurocholic acid; TMRE, Tetramethylrhodamine ethyl ester; TUNEL, Terminal deoxynucleotidyl transferase dUTP nick end labeling. (This figure appears in color on the web.)
Fig. 6
Fig. 6
Oxidative stress in liver tissue and extrahepatic bile after intoxication with APAP or BSO/DEM in mice. (A) 4-HNE in liver tissue homogenate. (B) Intravital images visualizing oxidative stress in liver tissue based on green fluorescence of oxidized DCF. (C) Bile volume sampled by a catheter fixed in the extrahepatic bile duct. (D) BA concentration in the sampled bile and total excreted BA. (E) Total GSH concentrations of extrahepatic bile. Means and SE of 4 mice are given. ∗p <0.05, ∗∗p <0.01, ∗∗∗p <0.001, Dunnett's multiple comparisons test. 4-HNE, 4-hydroxynonenal; BSO, buthionine sulfoximine; DEM, diethyl maleate; GSH, glutathione. (This figure appears in color on the web.)
Fig. 7
Fig. 7
Intracellular BA concentrations in relation to cytotoxicity. (A) Experimental design of cultivated mouse hepatocytes incubated with APAP and/or mouse bile. (B) Concentration-dependent cytotoxicity of BA in the presence of 0, 1 and 4 mM APAP. The inlay gives the EC10 and EC50 values of the fitted curves, the horizontal lines show the EC10 values and 95% confidence values. The open circles are data of 3 independent experiments obtained with hepatocytes from different mice, the closed circles represent mean values of the independent experiments. (C) Sum of intracellular BA concentrations in mouse hepatocytes incubated with extrahepatic mouse bile. (D) Sum of BA concentrations in homogenized liver tissue before and 2 h after APAP overdose. (E) Sum of BA concentrations in homogenized hepatocytes isolated from the same livers analyzed in D; the bar plots in C-E show mean values and SE; ∗p <0.05, ∗∗p <0.01, ∗∗∗p <0.001, unpaired t test. CTB, CellTiter-Blue, FCS, fetal calf serum. (This figure appears in color on the web.)
Fig. 8
Fig. 8
Interruption of futile BA cycling by Oatp knockout and Myrcludex B ameliorates APAP-induced hepatotoxicity. (A-D) Gross pathology, histopathology, quantification of the dead cell area, and Liver enzymes. The bar plots in C and D show mean values and SE; ∗∗p <0.01, ∗∗∗p <0.001, unpaired t test. (E) Cyp2e1 immunostaining in wild-type and Oatp knockout mice. (F) Similar glutathione levels in wild-type and Myrcludex B-treated Oatp knockout mice before and after APAP administration; data are mean values and SE; p <0.001 (∗∗∗), Tukey's multiple comparisons test. (G,H) Co-staining of Cyp2e1 and CD13 (upper panel) or Cyp2e1 and ZO1 (lower panel) in wild-type and Myrcludex B-treated mice before and 2 h after APAP administration. (I) MALDI-MSI showing reduced TCA signal in Myrcludex B-treated Oatp knockout mice 2 h after APAP overdose. (J,K) Sum of BA concentrations in liver tissues (J) and plasma (K) of wild-type and Myrcludex B-treated Oatp knockout mice with and without APAP overdose. Data in J and K are means and SE; ∗∗∗p <0.001, Sidak's multiple comparisons test and Tukey's multiple comparisons test, respectively. ALT, alanine transaminase; AST, aspartate transaminase; GSH, glutathione; KO, knockout; Myrcl. B, Myrcludex B; WT, wild-type. (This figure appears in color on the web.)

References

    1. Woolbright B.L., Jaeschke H. Role of the inflammasome in acetaminophen-induced liver injury and acute liver failure. J Hepatol. 2017;66:836–848. - PMC - PubMed
    1. Ramachandran A., Jaeschke H. Acetaminophen hepatotoxicity. Semin Liver Dis. 2019;39:221–234. - PMC - PubMed
    1. Akakpo J.Y., Ramachandran A., Jaeschke H. Novel strategies for the treatment of acetaminophen hepatotoxicity. Expert Opin Drug Metab Toxicol. 2020;16:1039–1050. - PMC - PubMed
    1. Bateman D.N. In: Critical Care Toxicology. Brent J., Burkhart K., Dargan P., Hatten B., Megarbane B., Palmer R., editors. Springer International Publishing; Cham: 2016. Acetaminophen (Paracetamol) pp. 1–25.
    1. Woolbright B.L., McGill M.R., Staggs V.S., Winefield R.D., Gholami P., Olyaee M., et al. Glycodeoxycholic acid levels as prognostic biomarker in acetaminophen-induced acute liver failure patients. Toxicol Sci. 2014;142:436–444. - PMC - PubMed

Publication types

MeSH terms

LinkOut - more resources