. 2022 Apr 15:250:118972.
doi: 10.1016/j.neuroimage.2022.118972. Epub 2022 Feb 4.

Dynamic variations of resting-state BOLD signal spectra in white matter

Affiliations

Dynamic variations of resting-state BOLD signal spectra in white matter

Muwei Li et al. Neuroimage. .

Abstract

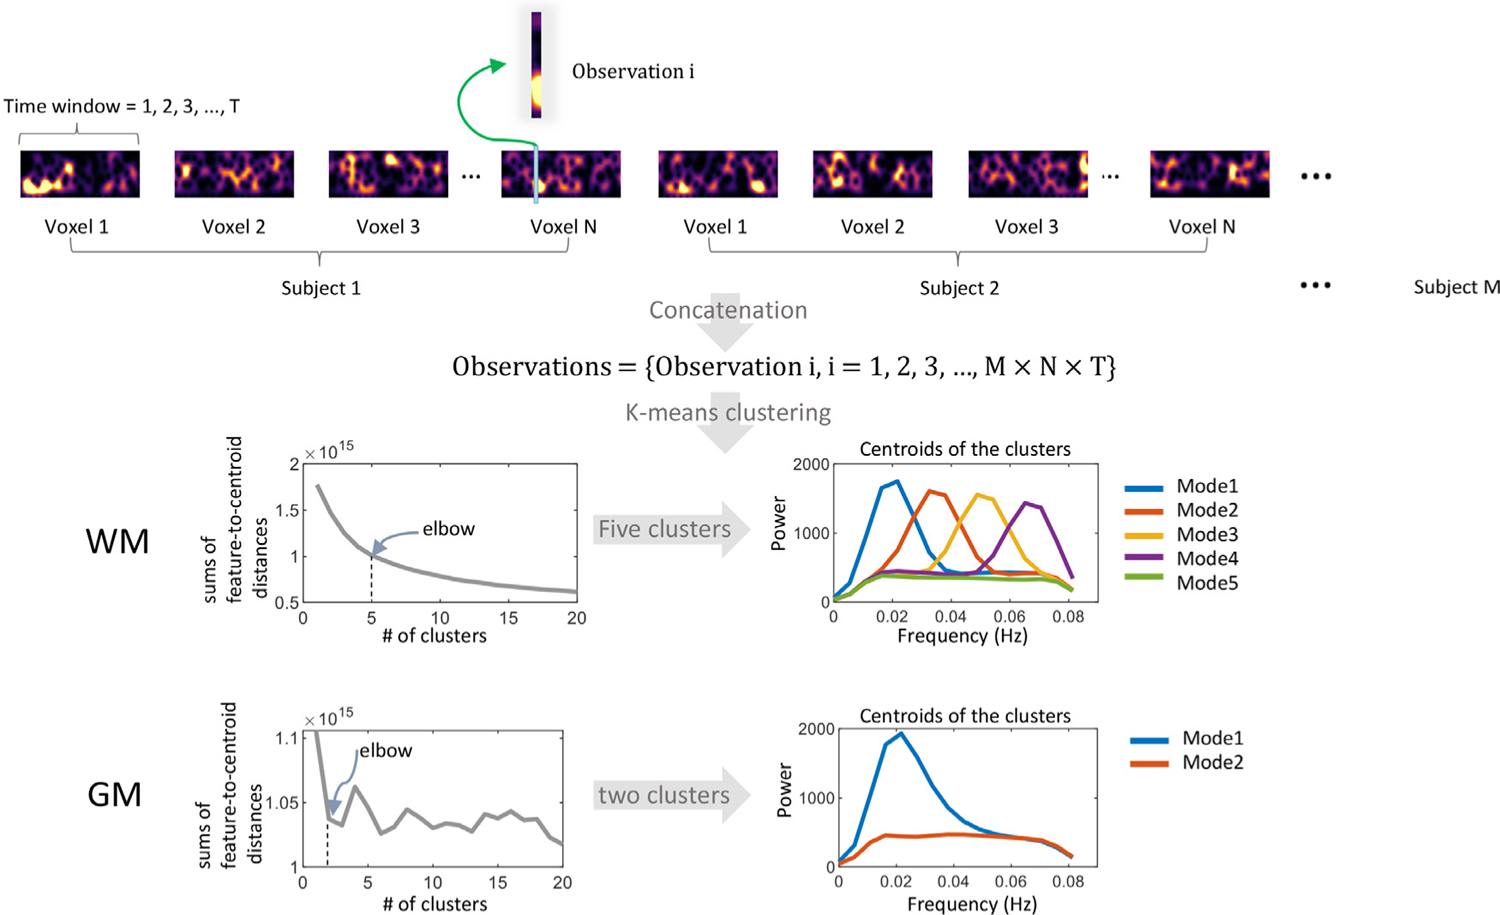
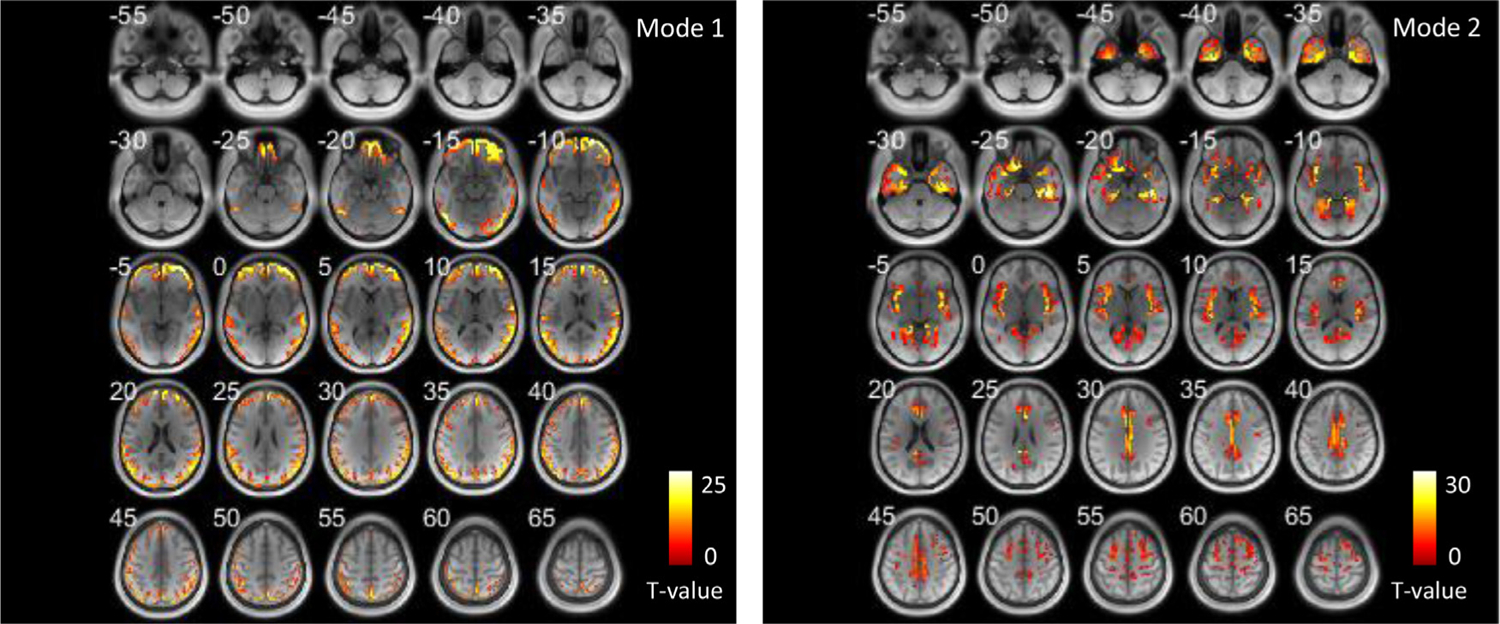
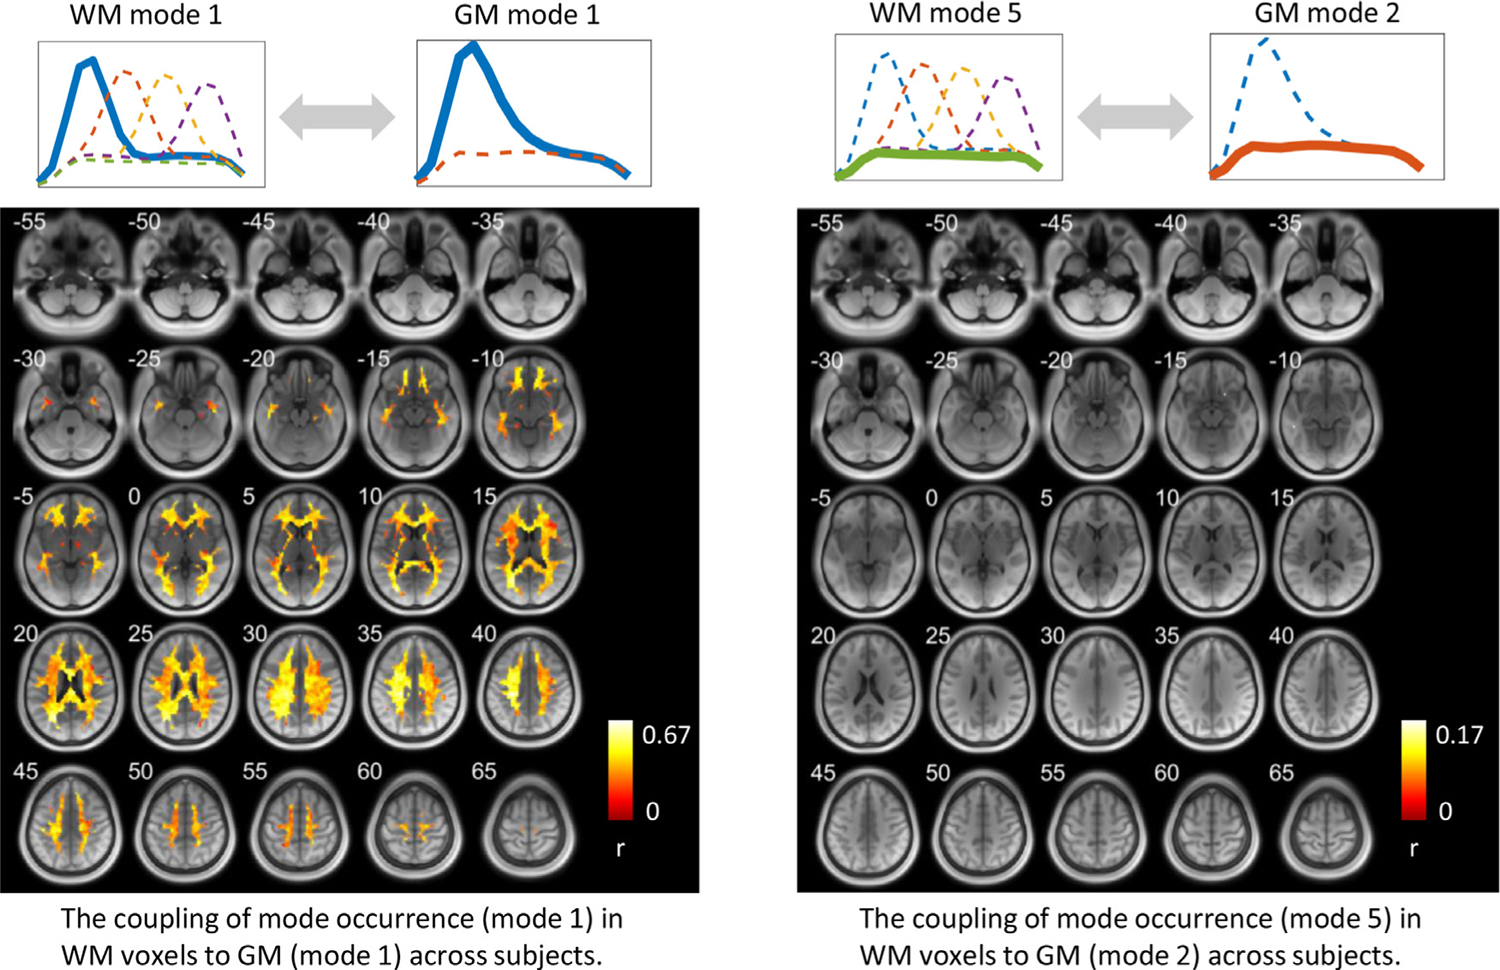
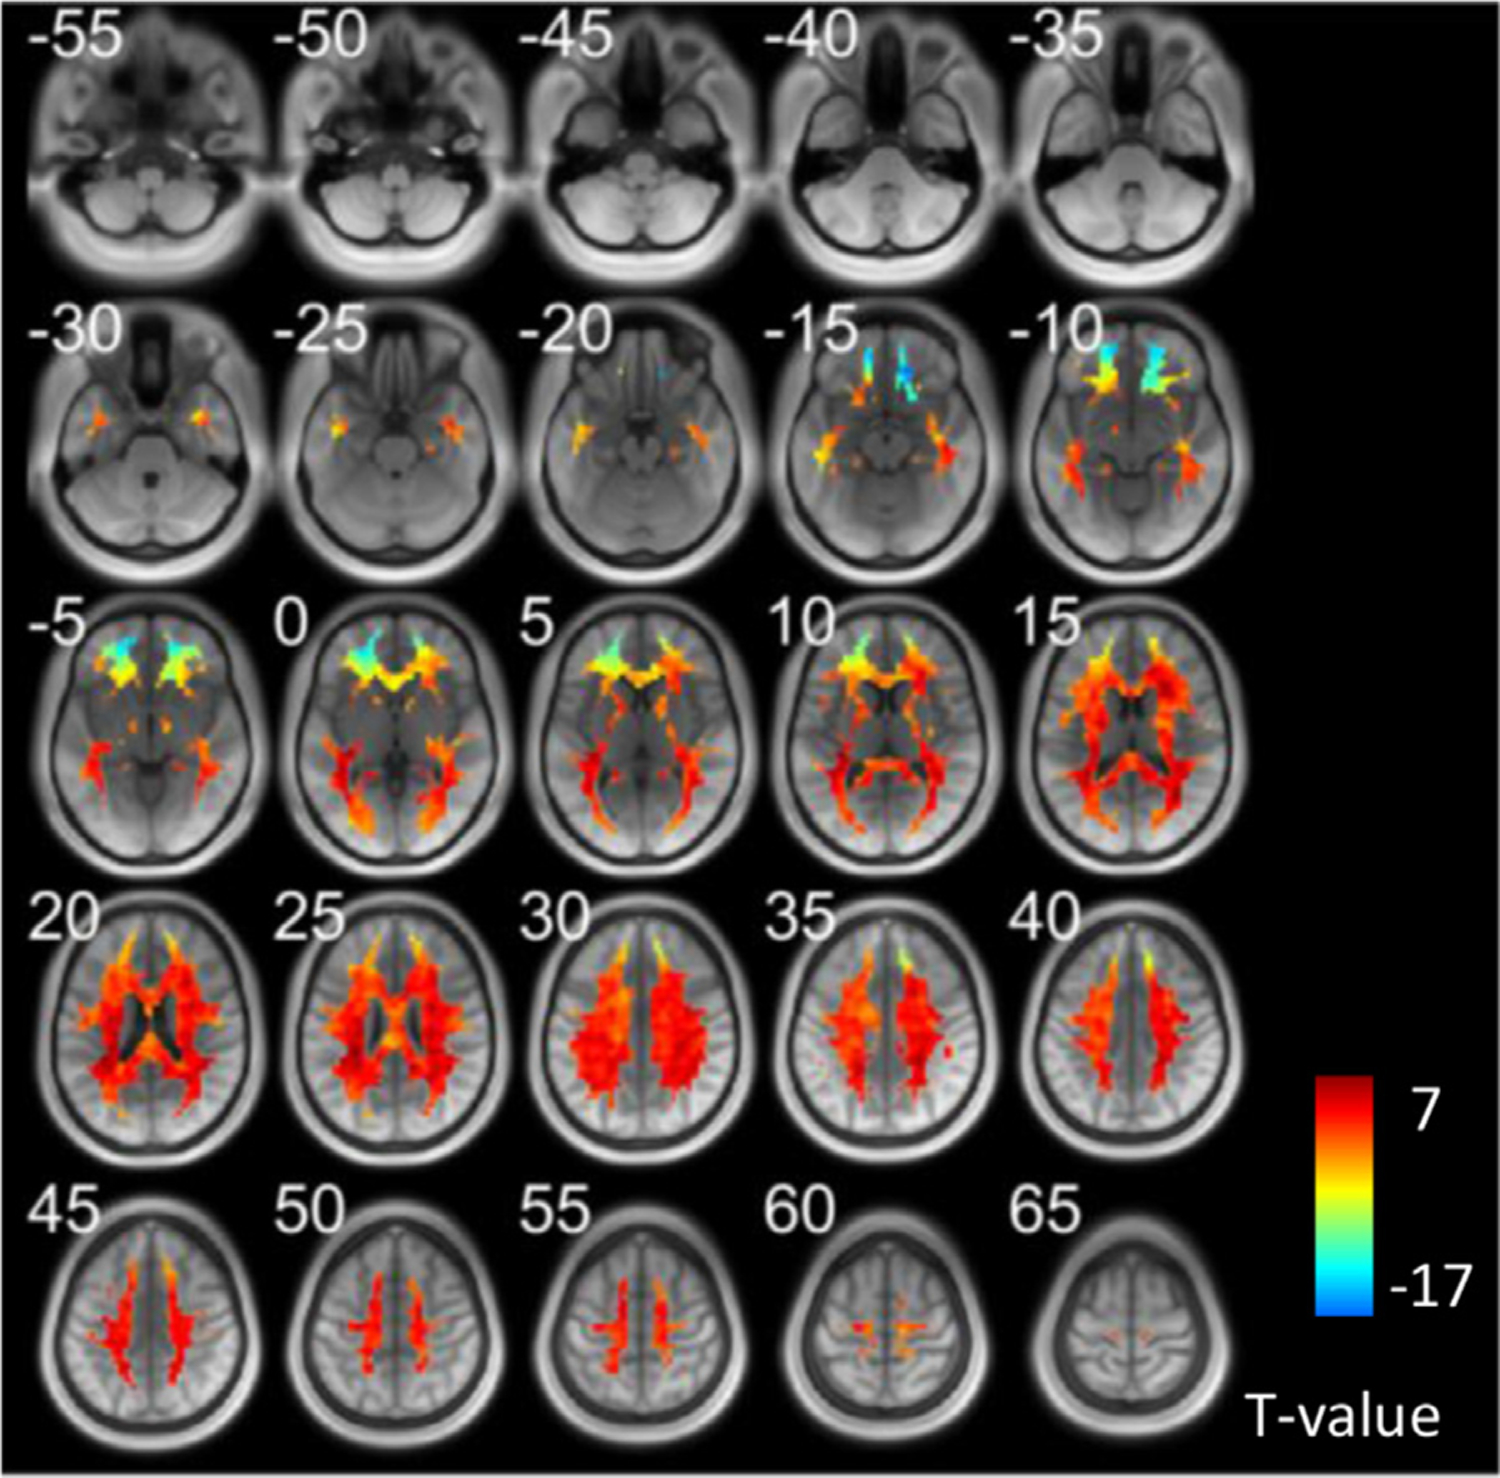
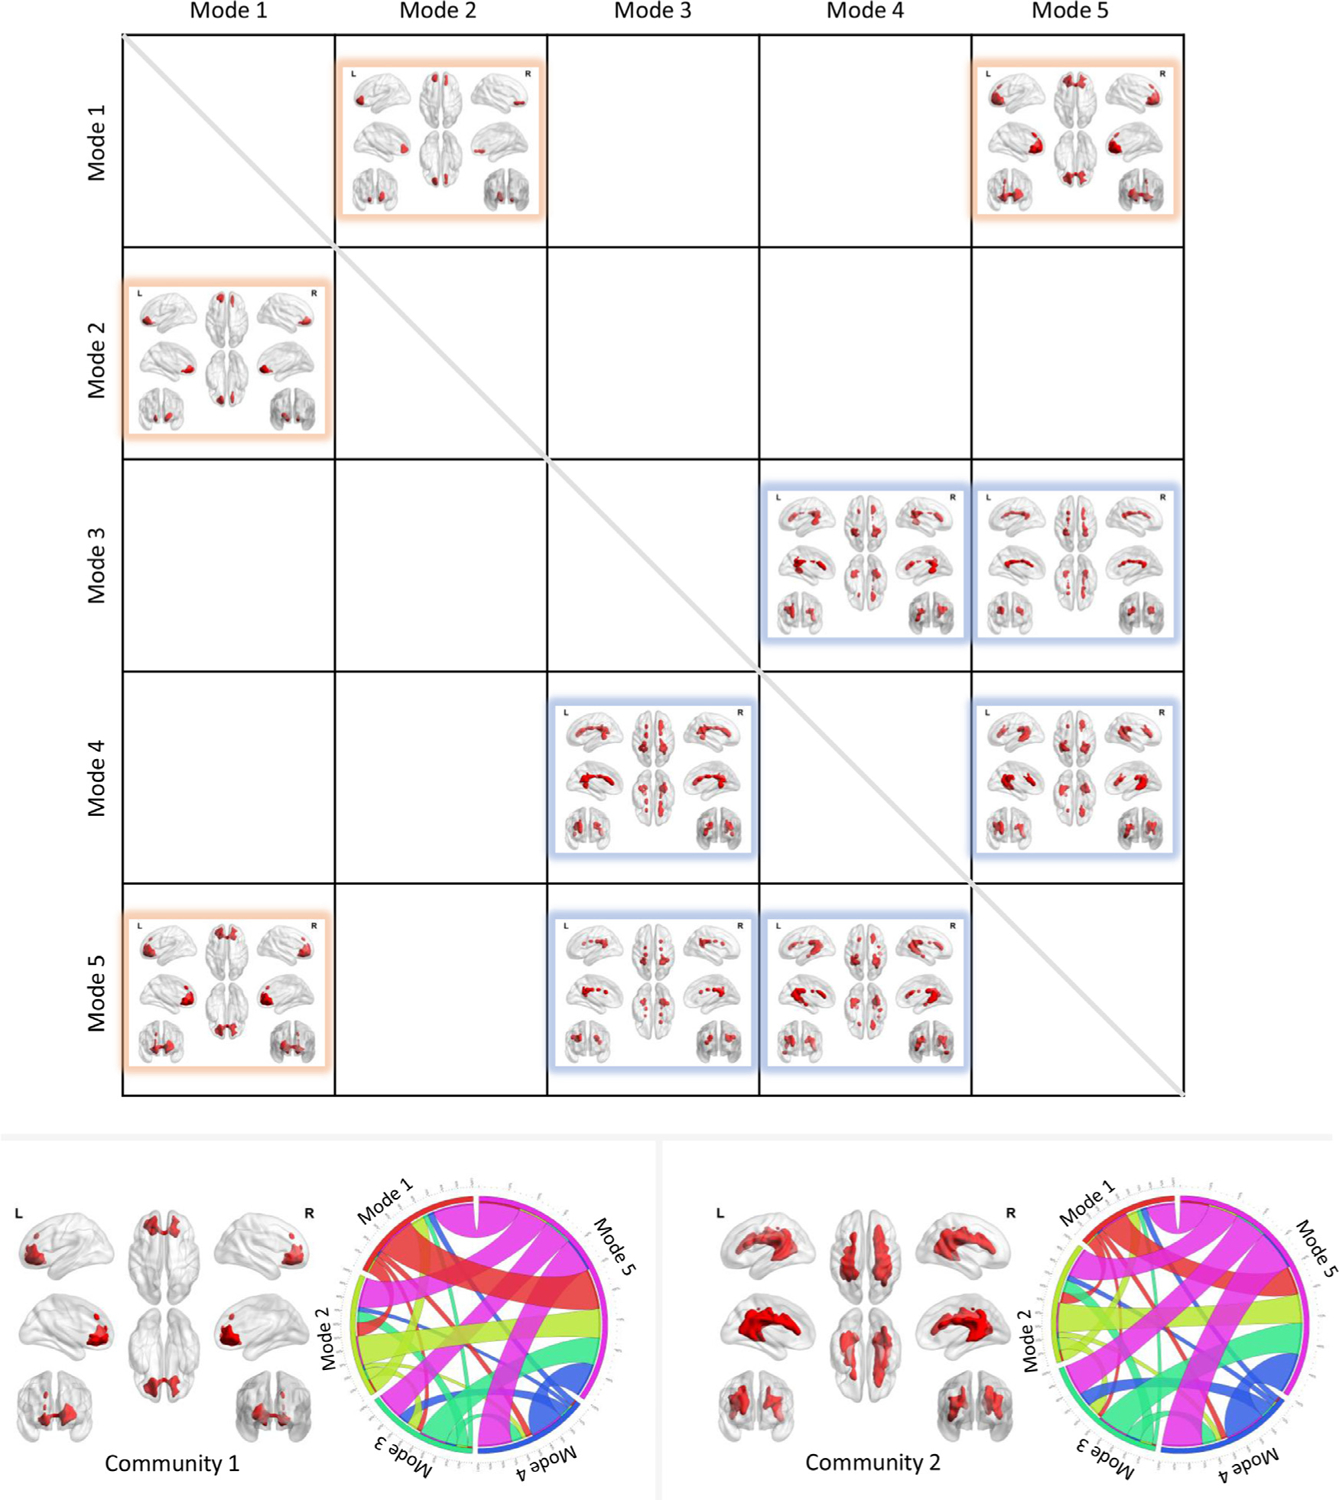
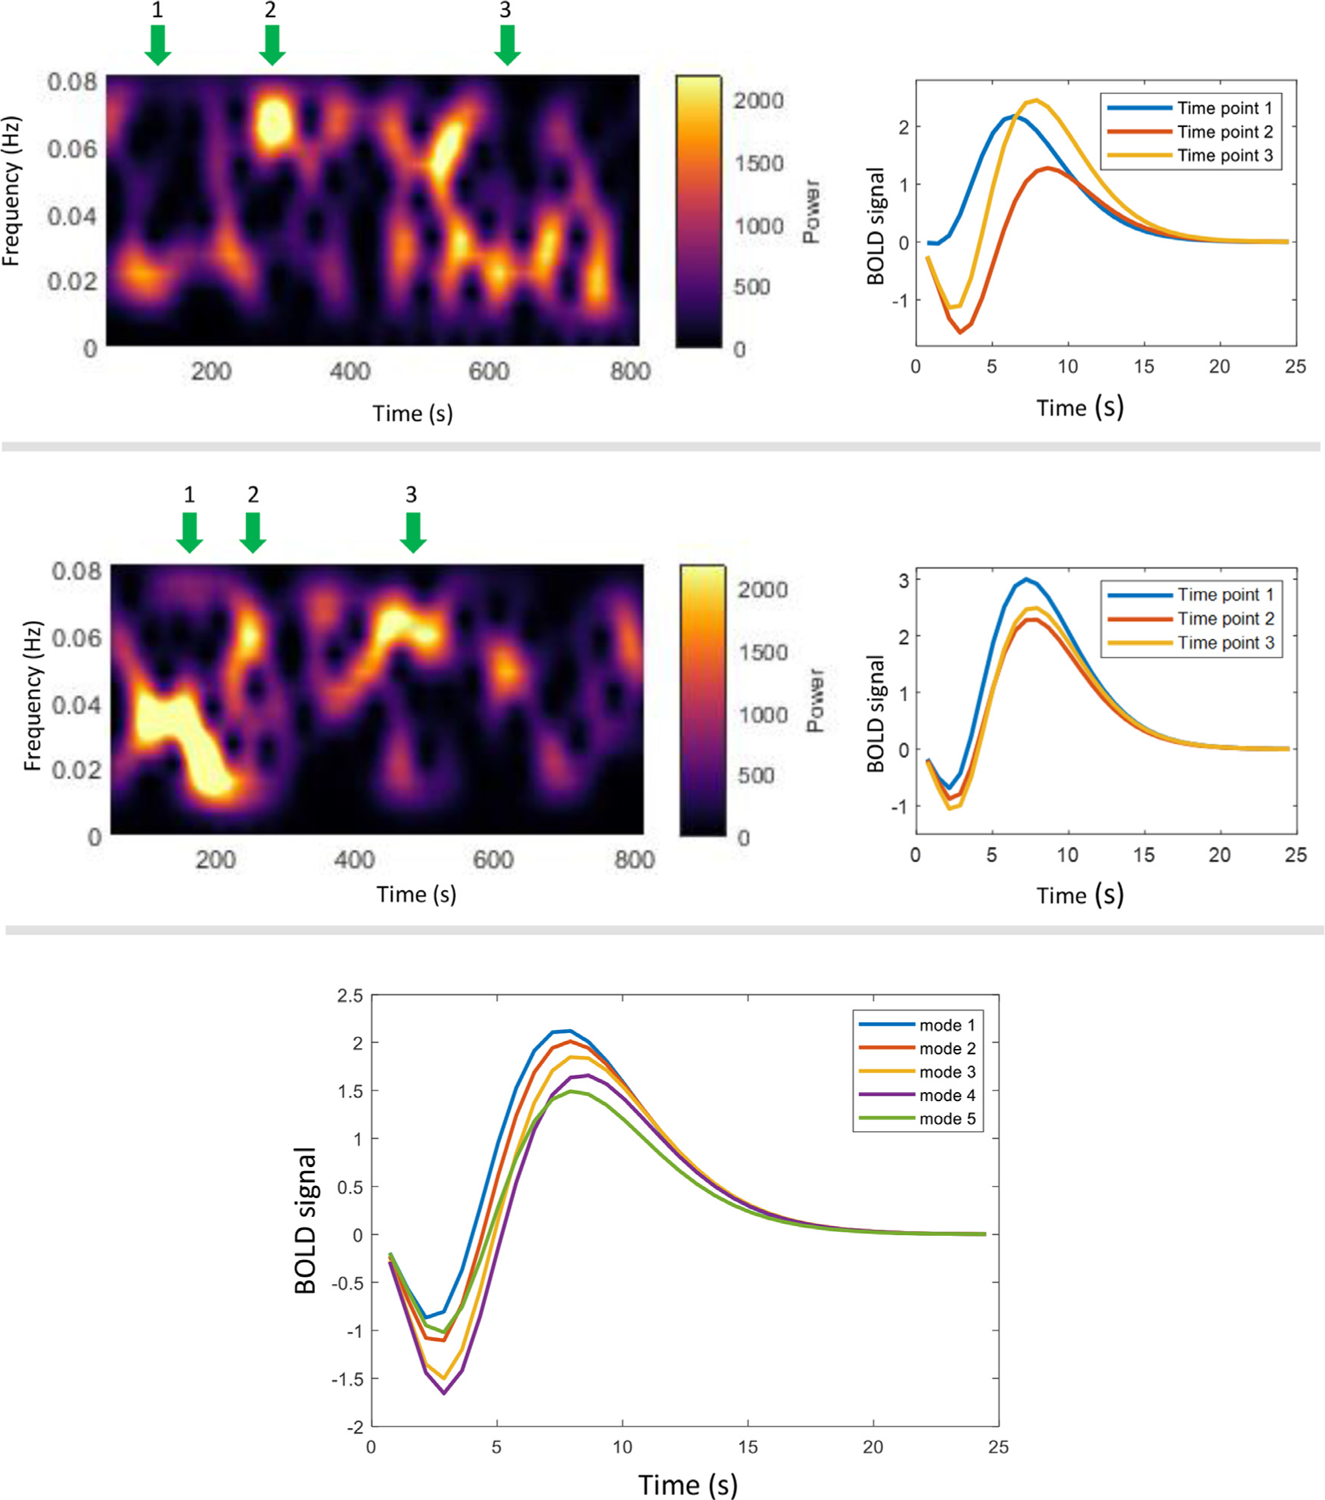
Recent studies have demonstrated that the mathematical model used for analyzing and interpreting fMRI data in gray matter (GM) is inappropriate for detecting or describing blood-oxygenation-level-dependent (BOLD) signals in white matter (WM). In particular the hemodynamic response function (HRF) which serves as the regressor in general linear models is different in WM compared to GM. We recently reported measurements of the frequency contents of resting-state signal time courses in WM that showed distinct power spectra which depended on local structural-vascular-functional associations. In addition, multiple studies of GM have revealed how functional connectivity between regions, as measured by the correlation between BOLD time series, varies dynamically over time. We therefore investigated whether and how BOLD signals from WM in a resting state varied over time. We measured voxel-wise spectrograms, which reflect the time-varying spectral patterns of WM time courses. The results suggest that the spectral patterns are non-stationary but could be categorized into five modes that recurred over time. These modes showed distinct spatial distributions of their occurrences and durations, and the distributions were highly consistent across individuals. In addition, one of the modes exhibited a strong coupling of its occurrence between GM and WM across individuals, and two communities of WM voxels were identified according to the hierarchical structures of transitions among modes. Moreover, these modes are coupled to the shape of instantaneous HRFs. Our findings extend previous studies and reveal the non-stationary nature of spectral patterns of BOLD signals over time, providing a spatial-temporal-frequency characterization of resting-state signals in WM.

Keywords: Dynamic; Hemodynamic response function; Power spectra; Resting state; White matter; fMRI.


Conflict of interest statement

Declaration of Competing Interest We declare no conflict of interest

Figures

Fig. 1.
Fig. 1.
The workflow of calculating the spectral modes. A set of observations were generated by concatenating the spectrogram over voxels and subjects. Each observation is a vector, recording the spectra pattern of the signal corresponding to a specific time window. Observations were grouped into five clusters for WM and two clusters for GM using the K-means method. The elbow criterion was used to determine the optimal value of the # of clusters.
Fig. 2.
Fig. 2.
Voxels that exhibit significantly high occurrence of each mode across all subjects. In each of the four panels, the figure on the left visualizes the voxels that exhibit significantly higher occurrence of a certain mode than the rest of the WM voxels across all subjects (one-sample t-test, p<0.05 FWE corrected). The figure on the upper right of each panel shows the number of occurrences of the five modes within the area shown on the left figure. The figure on the lower right of each panel shows the average duration of the five modes within the area shown on the left figure. Each box visualizes the distribution of the measurements from all subjects. Note that the data for mode 2 is not shown because only a few voxels were found showing the significantly higher occurrence of mode 2 comparing to the rest of the WM voxels across subjects.
Fig. 3.
Fig. 3.
Areas that exhibit significantly high occurrence of the two modes in GM across all subjects shown in axial slices. (one-sample t-test, p < 0.05 FWE corrected).
Fig. 4.
Fig. 4.
The coupling of mode occurrence in WM voxels to GM across subjects. The intensity of a voxel in the left figure indicates the Pearson’s correlation coefficient (r) between the occurrence of mode 1 at this WM voxel and the occurrence of mode 1 in the GM area shown in Fig. 3 (left) across subjects. The intensity of a voxel in the right figure indicates the Pearson’s correlation coefficient (r) between the occurrence of mode 5 at this WM voxel and the occurrence of mode 1 in the GM area shown in Fig. 3 (right) across subjects. Note that only significant (p<0.05) correlations are shown here.
Fig. 5.
Fig. 5.
The number of transitions at each WM voxel across all subjects. T value was generated by a one-sample t-test across all subjects. Voxels that exabit significantly high/low values can be found in supplementary file.
Fig. 6.
Fig. 6.
The transitions among modes. The upper figure visualizes the voxels that exhibit significantly higher transitions from mode i to mode j than the rest of WM voxels across subjects (one-sample t-test, p<0.05, FWE corrected). Two communities were identified and coded by different colors. The lower left panel shows the voxels that exhibit significantly higher transitions among modes 1, 2 and 5 (community 1), along with its transition probability among five modes shown on the right. The lower right panel shows the voxels that exhibit significantly higher transitions among modes 3, 4 and 5 (community 2), along with its transition probability among the five modes shown on the right.
Fig. 7.
Fig. 7.
Relationship between instantaneous HRFs and spectral patterns. The upper and middle panel shows the HRFs (right) calculated in selected time windows where the spectral patterns (left) show peaks at different frequencies. Note that these two panels correspond to two voxels randomly selected from one subject. The lower panel shows the HRF corresponding to the five WM modes. Each line is the average HRF estimated from all time windows that have been assigned to a mode across time and voxels of the selected subject.

Similar articles

Cited by

References

    1. Bertrand O, Tallon-Baudry C, 2000. Oscillatory gamma activity in humans: a possible role for object representation. Int. J. Psychophysiol 38, 211–223. doi:10.1016/S0167-8760(00)00166-5. - DOI - PubMed
    1. Biswal BB, 2012. Resting state fMRI: a personal history. Neuroimage 62, 938–944. doi:10.1016/j.neuroimage.2012.01.090. - DOI - PubMed
    1. Chang C, Glover GH, 2010. Time-frequency dynamics of resting-state brain connectivity measured with fMRI. Neuroimage 50, 81–98. doi:10.1016/j.neuroimage.2009.12.011. - DOI - PMC - PubMed
    1. Courtemanche MJ, Sparrey CJ, Song X, MacKay A, D’Arcy RCN, 2018. Detecting white matter activity using conventional 3 Tesla fMRI: an evaluation of standard field strength and hemodynamic response function. Neuroimage 169, 145–150. doi:10.1016/j.neuroimage.2017.12.008. - DOI - PubMed
    1. D’Arcy RCN, Hamilton A, Jarmasz M, Sullivan S, Stroink G, 2006. Exploratory data analysis reveals visuovisual interhemispheric transfer in functional magnetic resonance imaging. Magn. Reson. Med 55, 952–958. doi:10.1002/mrm.20839. - DOI - PubMed

Publication types