

Thrombospondin-1, Platelet Factor 4, and Galectin-1 Are Associated with Engraftment in Patients with Sickle Cell Disease who Underwent Haploidentical Hematopoietic Stem Cell Transplantation
- PMID: 35131485
- PMCID: PMC9176382
- DOI: 10.1016/j.jtct.2022.01.027
Thrombospondin-1, Platelet Factor 4, and Galectin-1 Are Associated with Engraftment in Patients with Sickle Cell Disease who Underwent Haploidentical Hematopoietic Stem Cell Transplantation
Abstract
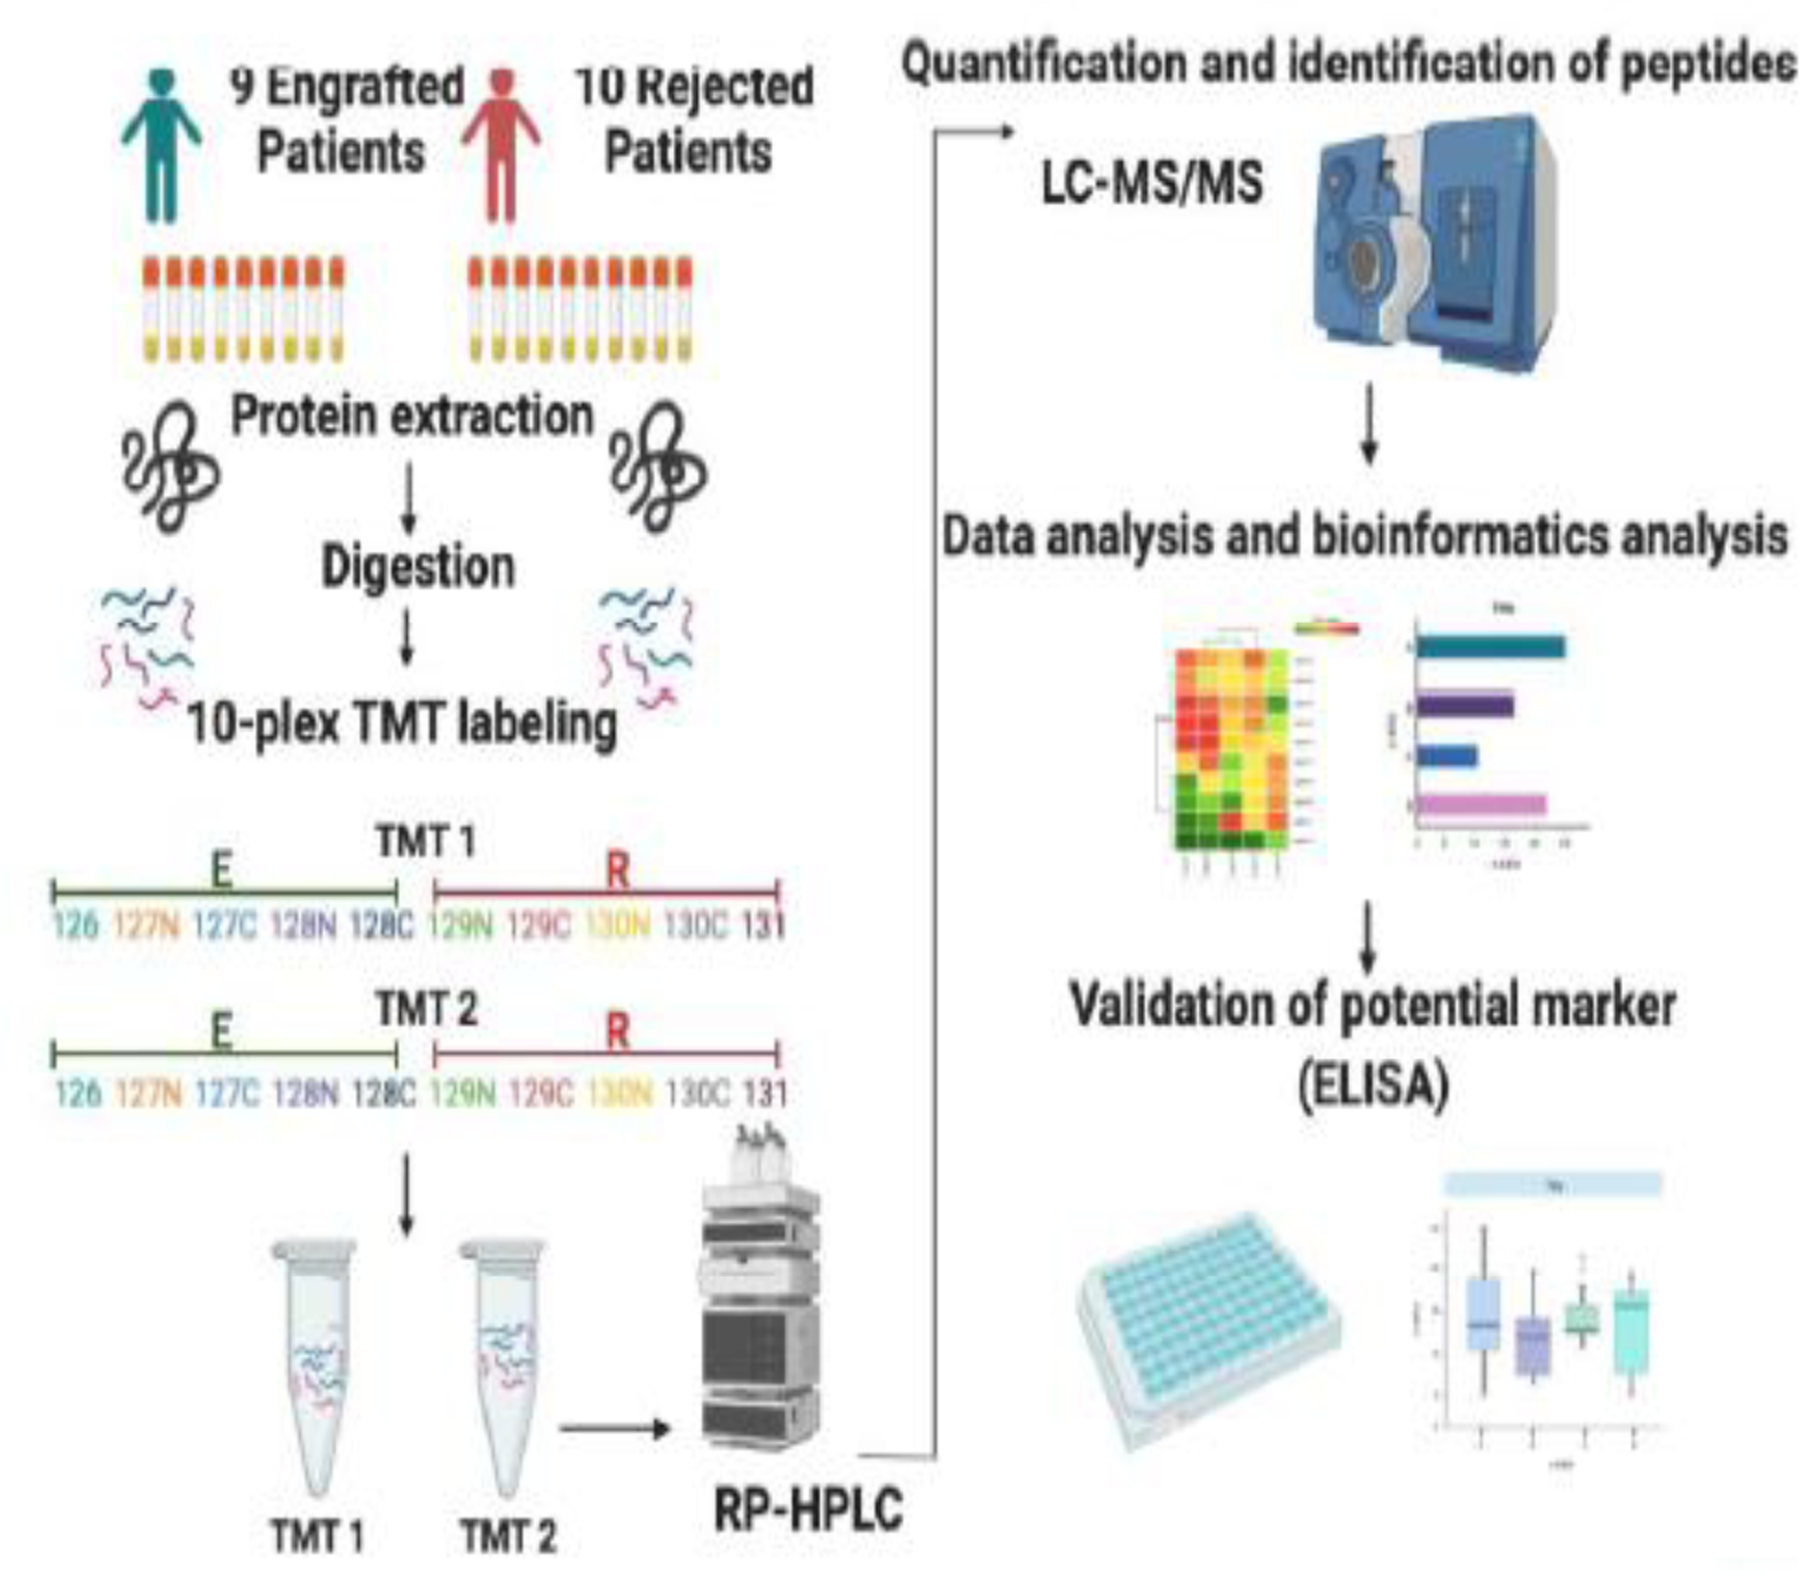
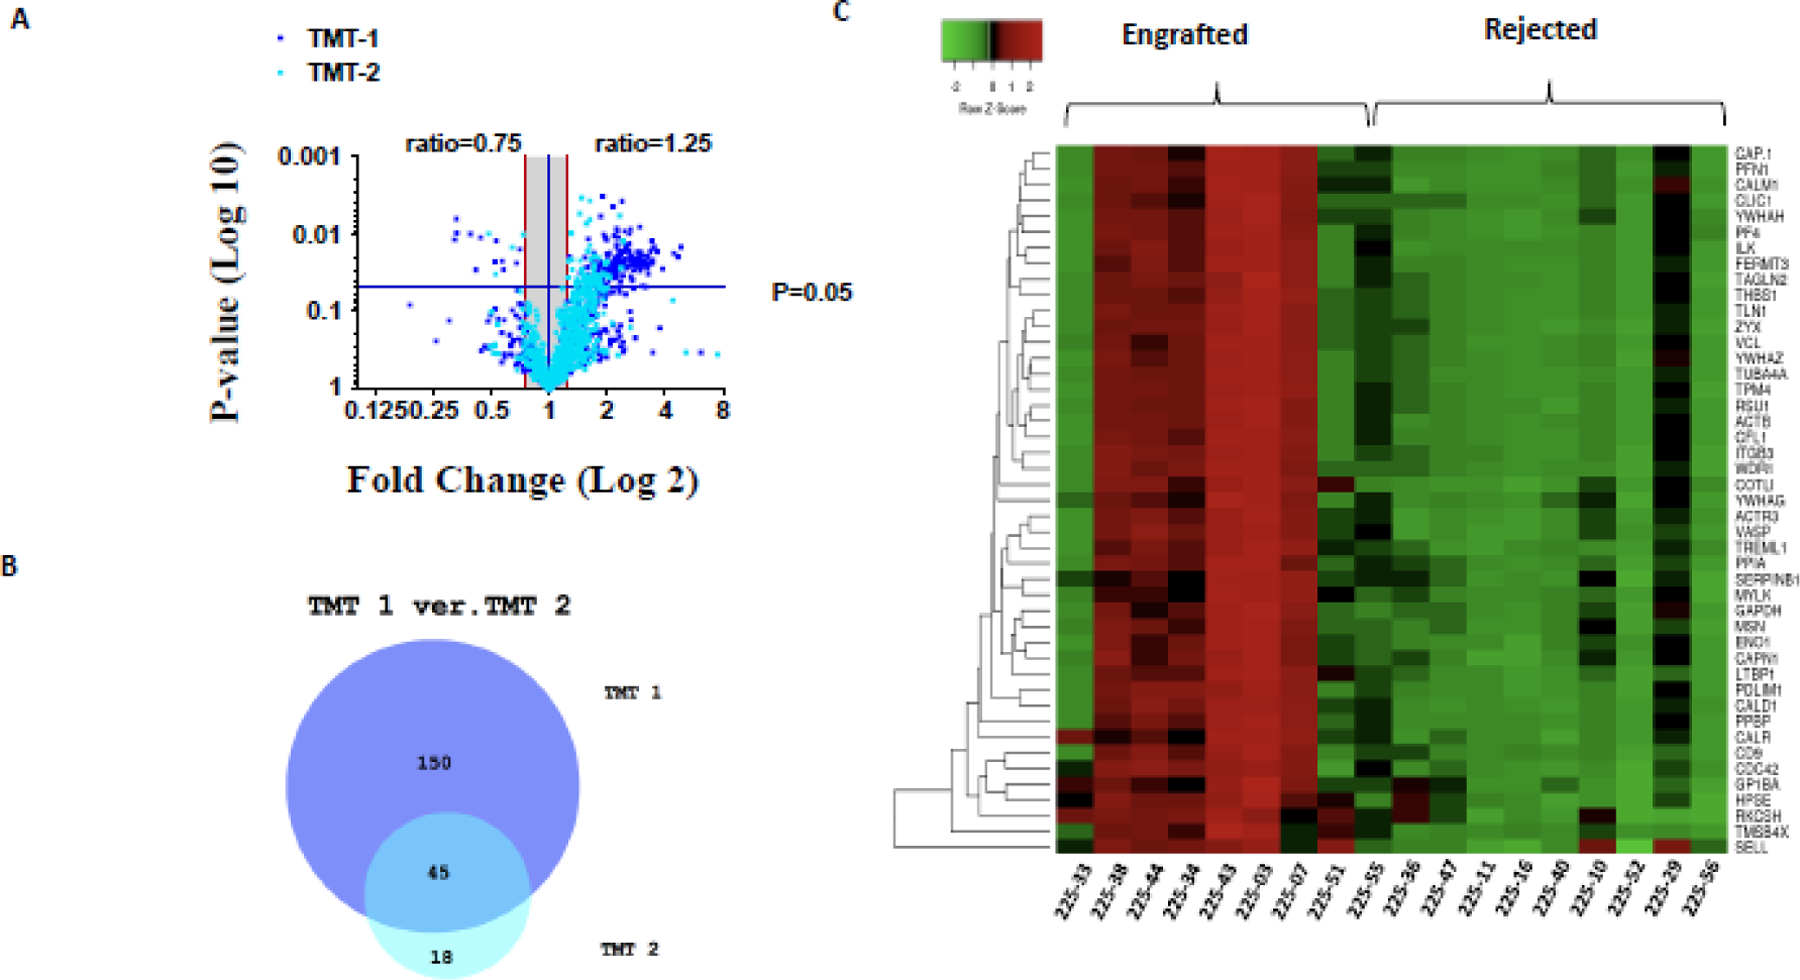
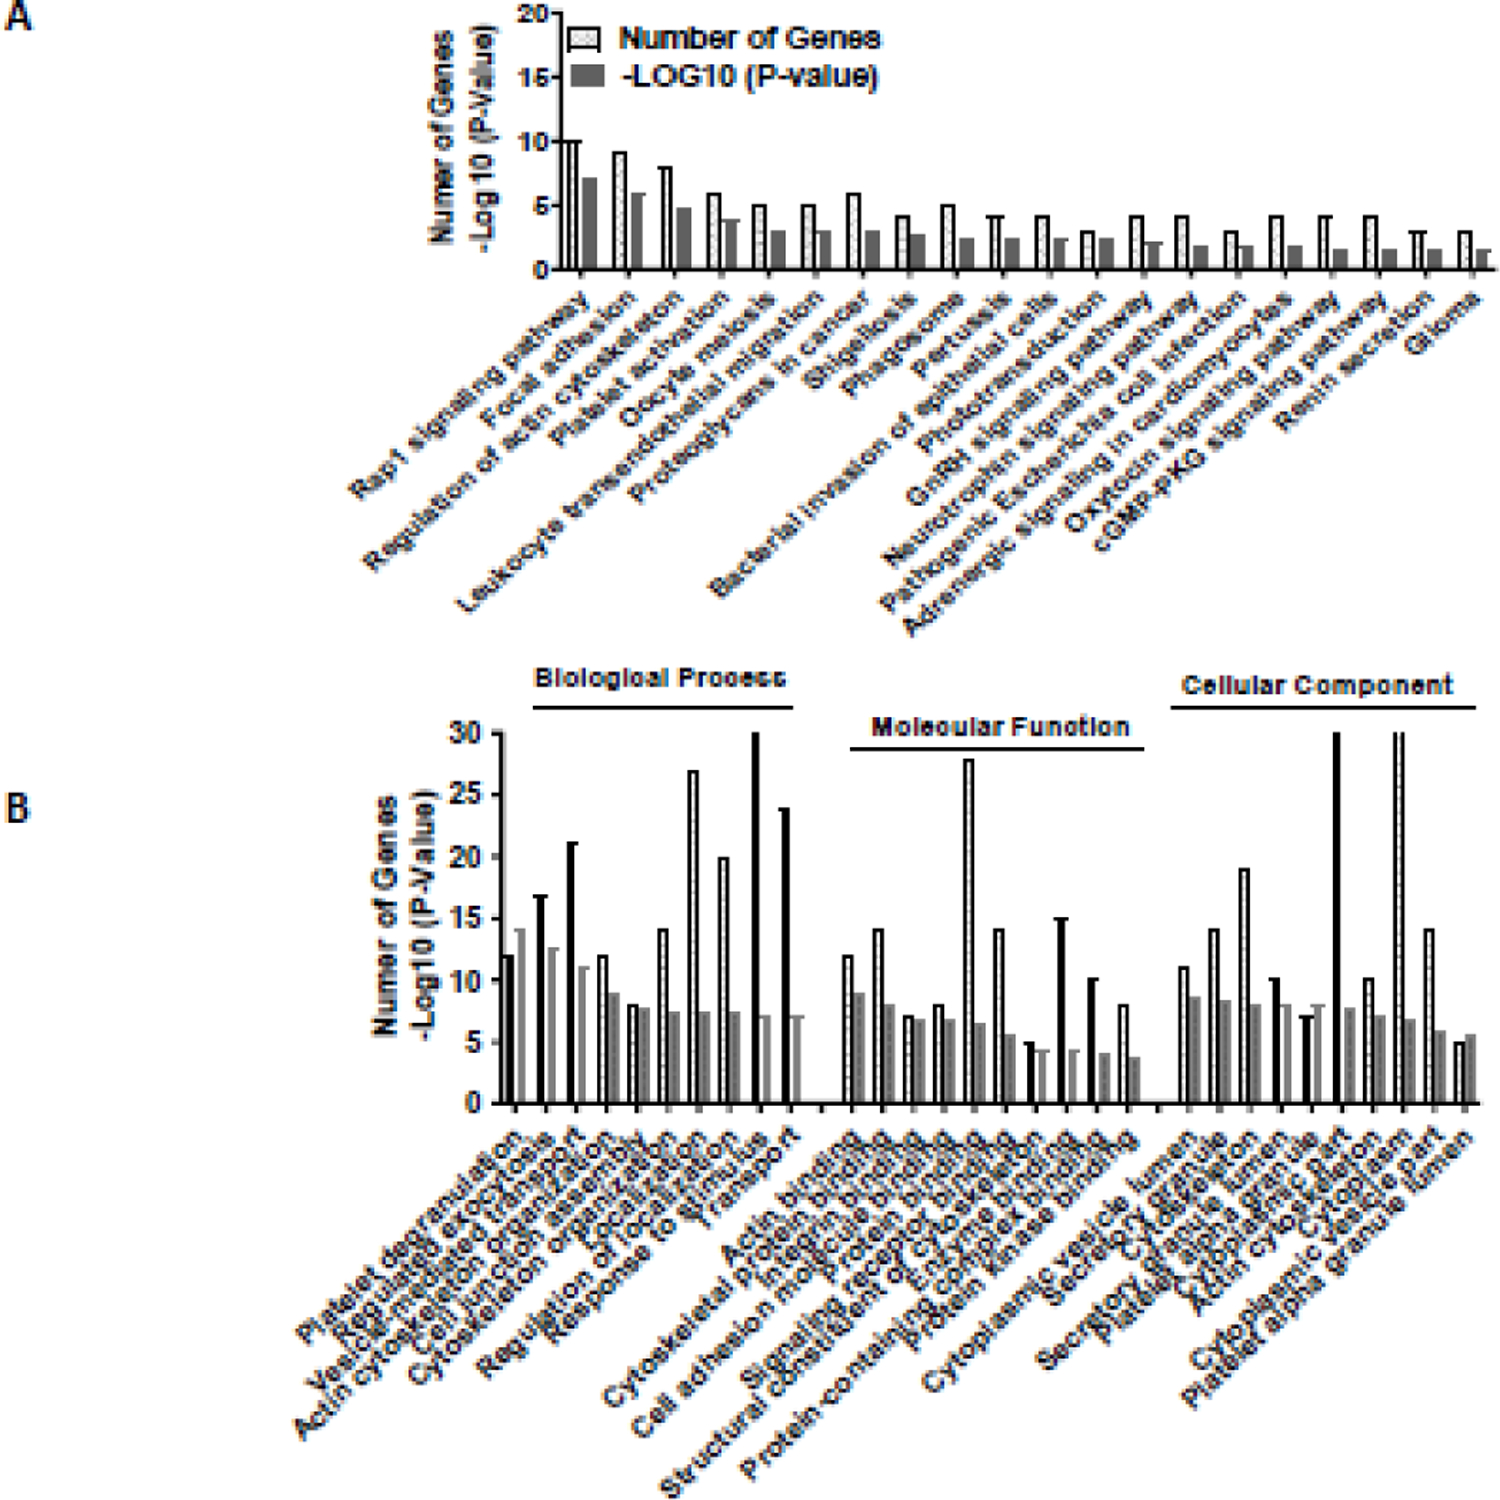
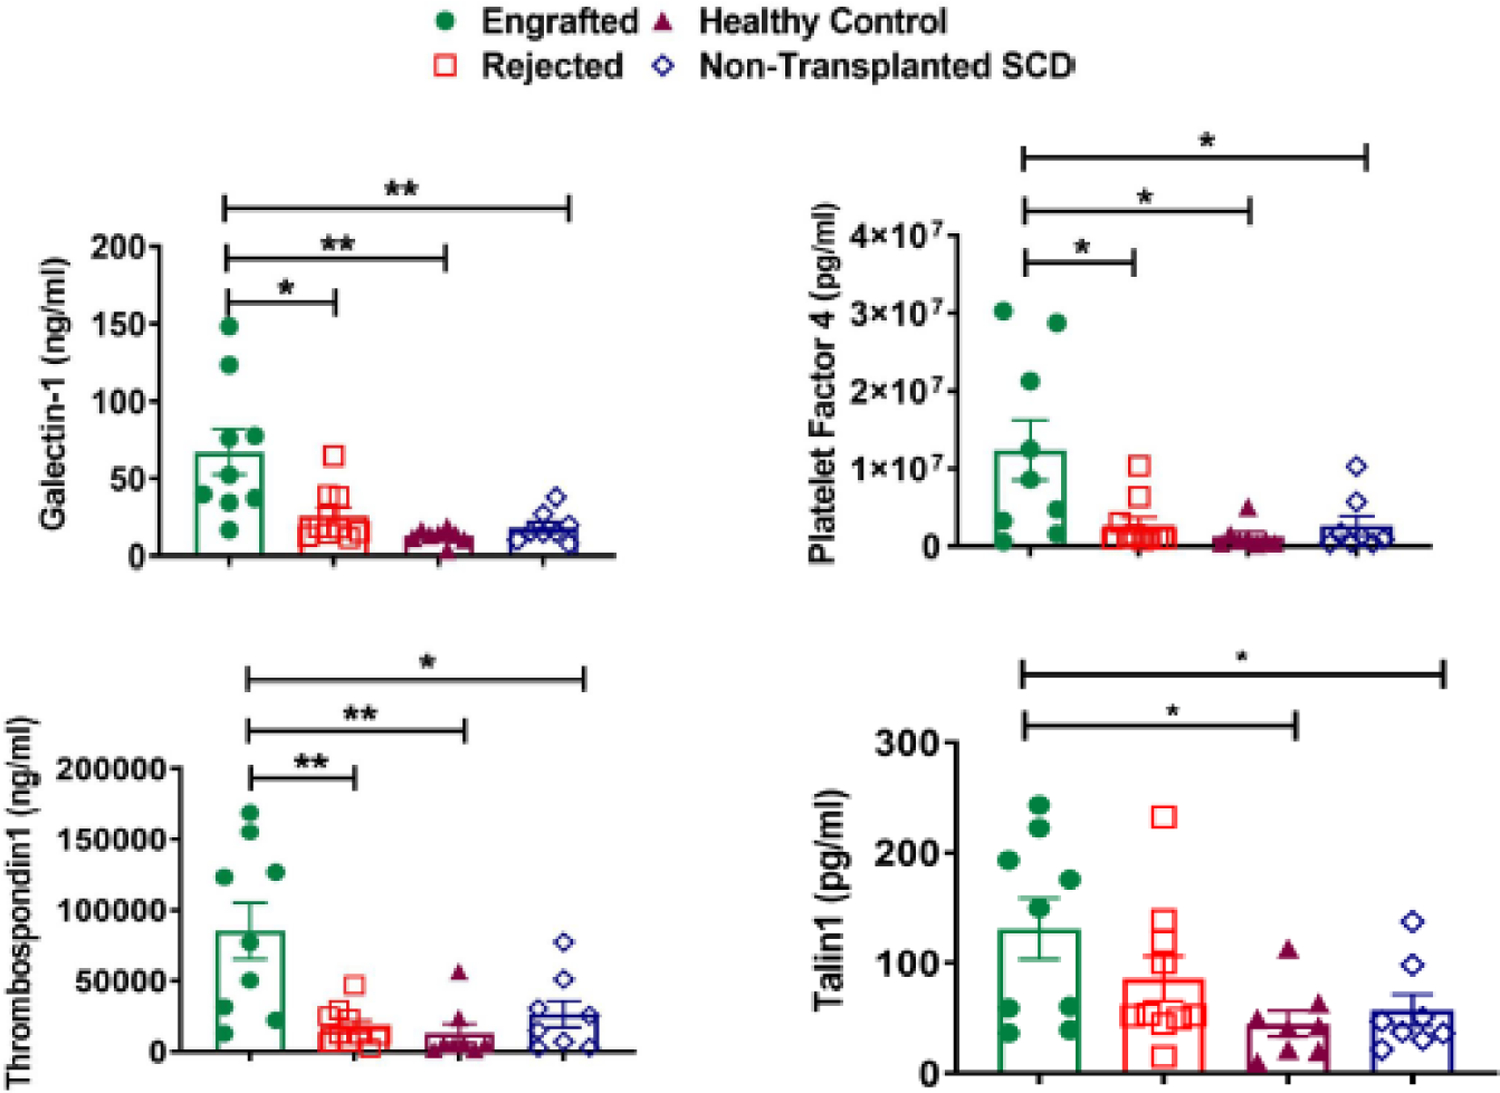
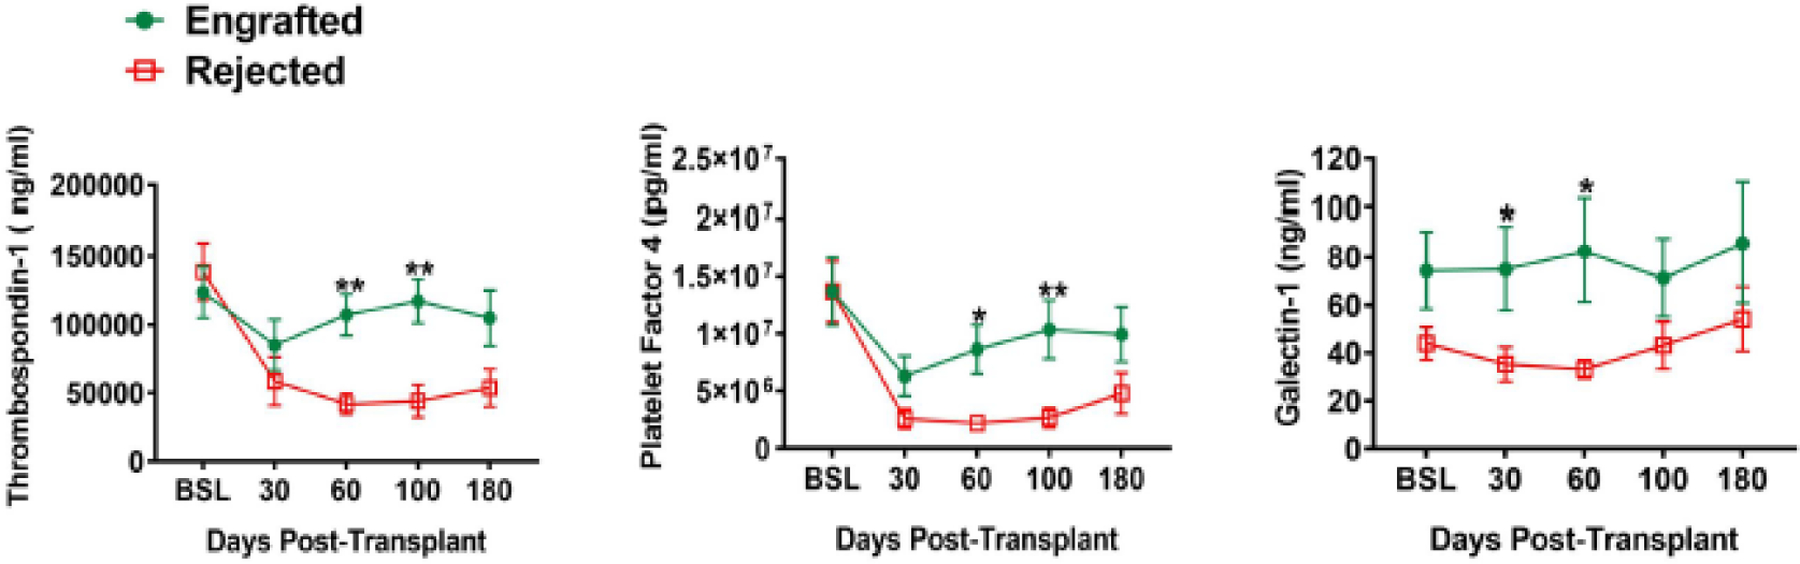
Sickle cell disease (SCD) is an inherited red blood cell disorder that leads to significant morbidity and early mortality. The most widely available curative approach remains allogeneic hematopoietic stem cell transplantation (HSCT). HLA-haploidentical (haplo) HSCT expands the donor pool considerably and is a practical alternative for these patients, but traditionally with an increased risk of allograft rejection. Biomarkers in patient plasma could potentially help predict HSCT outcome and allow treatment at an early stage to reverse or prevent graft rejection. Reliable, noninvasive methods to predict engraftment or rejection early after HSCT are needed. We sought to detect variations in the plasma proteomes of patients who engrafted compared with those who rejected their grafts. We used a mass spectrometry-based proteomics approach to identify candidate biomarkers associated with engraftment and rejection by comparing plasma samples obtained from 9 engrafted patients and 10 patients who experienced graft rejection. A total of 1378 proteins were identified, 45 of which were differentially expressed in the engrafted group compared with the rejected group. Based on bioinformatics analysis results, information from the literature, and immunoassay availability, 7 proteins-thrombospondin-1 (Tsp-1), platelet factor 4 (Pf-4), talin-1, moesin, cell division control protein 42 homolog (CDC42), galectin-1 (Gal-1), and CD9-were selected for further analysis. We compared these protein concentrations among 35 plasma samples (engrafted, n = 9; rejected, n = 10; healthy volunteers, n = 8; nontransplanted SCD, n = 8). ELISA analysis confirmed the significant up-regulation of Tsp-1, Pf-4, and Gal-1 in plasma samples from engrafted patients compared with rejected patients, healthy African American volunteers, and the nontransplanted SCD group (P < .01). By receiver operating characteristic analysis, these 3 proteins distinguished engrafted patients from the other groups (area under the curve, >0.8; P < .05). We then evaluated the concentration of these 3 proteins in samples collected pre-HSCT and at days +30, +60, +100, and +180 post-HSCT. The results demonstrate that Tsp-1 and Pf-4 stratified engrafted patients as early as day 60 post-HSCT (P < .01), and that Gal-1 was significantly higher in engrafted patients as early as day 30 post-HSCT (P < .01). We also divided the rejected group into those who experienced primary (n = 5) and secondary graft rejection (n = 5) and found that engrafted patients had significantly higher Tsp-1 levels compared with patients who developed primary graft rejection at days +60 and +100 (P < .05), as well as higher Pf-4 levels compared with patients who developed primary graft rejection at post-transplantation (PT) day 100. Furthermore, Tsp-1 levels were significantly higher at PT days 60 and 100 and Pf-4 levels were higher at PT day 100 in engrafted patients compared with those who experienced secondary graft rejection. Increased concentrations of plasma Gal-1, Tsp-1, and Pf-4 could reflect increased T regulatory cells, IL-10, and TGF-β, which are essential players in the initiation of immunologic tolerance. These biomarkers may provide opportunities for preemptive intervention to minimize the incidence of graft rejection.
Keywords: Biomarkers; Engraftment; Haplo-HSCT; Proteomics; Rejection; Sickle cell disease.
Published by Elsevier Inc.
Conflict of interest statement
Financial Disclosure Statement
The authors have no conflicts of interest to disclose
Figures
Similar articles
-
Early Myeloid Derived Suppressor Cells (eMDSCs) Are Associated With High Donor Myeloid Chimerism Following Haploidentical HSCT for Sickle Cell Disease.Front Immunol. 2021 Nov 30;12:757279. doi: 10.3389/fimmu.2021.757279. eCollection 2021. Front Immunol. 2021. PMID: 34917079 Free PMC article.
-
Alternative donor: αß/CD19 T-cell-depleted haploidentical hematopoietic stem cell transplantation for sickle cell disease.Hematol Oncol Stem Cell Ther. 2020 Jun;13(2):98-105. doi: 10.1016/j.hemonc.2019.12.006. Epub 2020 Mar 12. Hematol Oncol Stem Cell Ther. 2020. PMID: 32202248 Review.
-
Reduced toxicity, myeloablative HLA-haploidentical hematopoietic stem cell transplantation with post-transplantation cyclophosphamide for sickle cell disease.Ann Hematol. 2017 Aug;96(8):1373-1377. doi: 10.1007/s00277-017-3030-x. Epub 2017 Jun 1. Ann Hematol. 2017. PMID: 28573314
-
Nonmyeloablative HLA-matched sibling allogeneic hematopoietic stem cell transplantation for severe sickle cell phenotype.JAMA. 2014 Jul 2;312(1):48-56. doi: 10.1001/jama.2014.7192. JAMA. 2014. PMID: 25058217 Free PMC article. Clinical Trial.
-
Alternative donor hematopoietic stem cell transplantation for sickle cell disease in Europe.Hematol Oncol Stem Cell Ther. 2020 Dec;13(4):181-188. doi: 10.1016/j.hemonc.2019.12.011. Epub 2020 Mar 16. Hematol Oncol Stem Cell Ther. 2020. PMID: 32201153 Review.
Cited by
-
Galectin-1 is associated with hematopoietic cell engraftment in murine MHC-mismatched allotransplantation.Front Immunol. 2024 Sep 16;15:1411392. doi: 10.3389/fimmu.2024.1411392. eCollection 2024. Front Immunol. 2024. PMID: 39351218 Free PMC article.
References
Publication types
MeSH terms
Substances
Grants and funding
LinkOut - more resources
Full Text Sources
Medical
Research Materials
Miscellaneous
