

Inhibition of integrin αvβ6 sparks T-cell antitumor response and enhances immune checkpoint blockade therapy in colorectal cancer
- PMID: 35131862
- PMCID: PMC8823245
- DOI: 10.1136/jitc-2021-003465
Inhibition of integrin αvβ6 sparks T-cell antitumor response and enhances immune checkpoint blockade therapy in colorectal cancer
Abstract
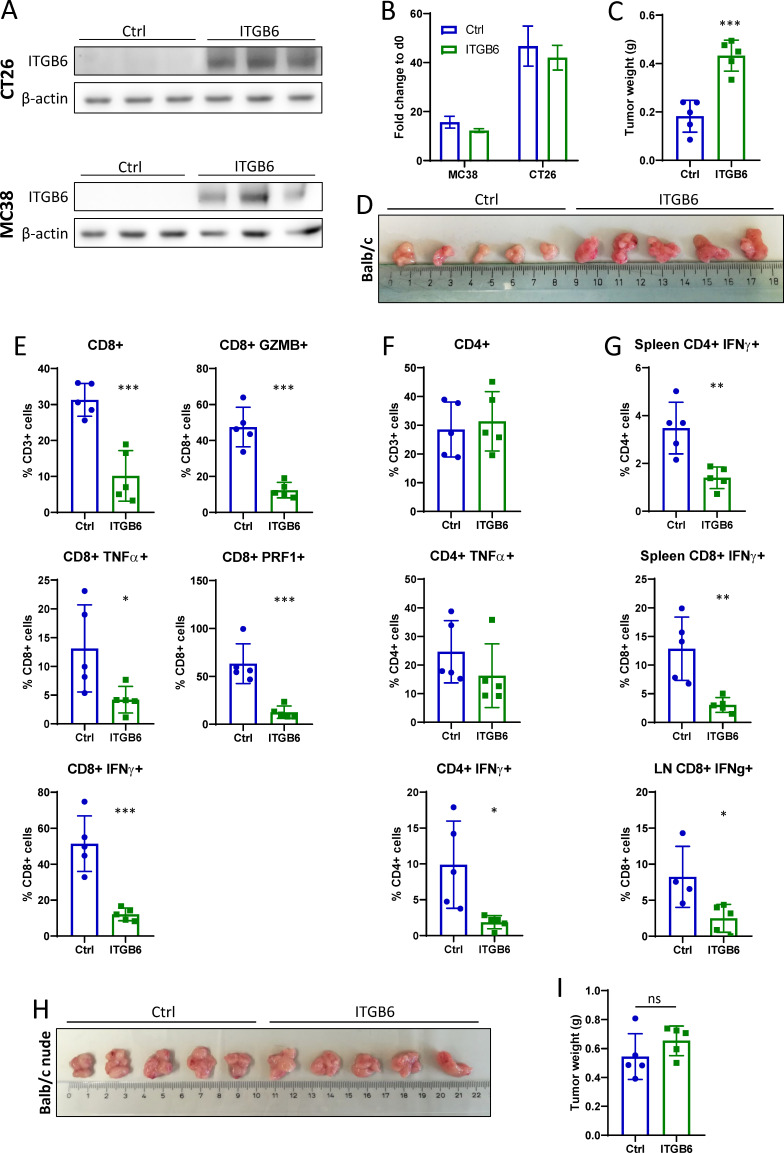
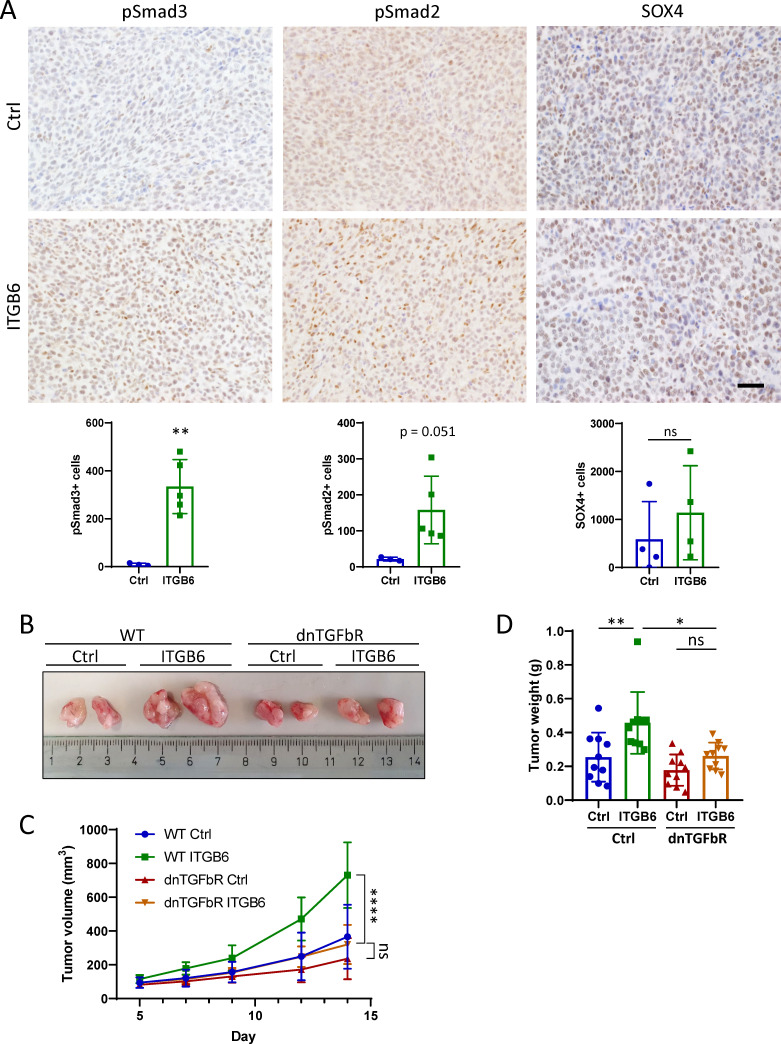
Background: Integrin αvβ6 is a heterodimeric cell surface protein whose cellular expression is determined by the availability of the integrin β6 subunit (ITGB6). It is expressed at very low levels in most organs during tissue homeostasis but shows highly upregulated expression during the process of tumorigenesis in many cancers of epithelial origin. Notably, enhanced expression of integrin αvβ6 is associated with aggressive disease and poor prognosis in numerous carcinoma entities. Integrin αvβ6 is one of the major physiological activators of transforming growth factor-β (TGF-β), which has been shown to inhibit the antitumor T-cell response and cause resistance to immunotherapy in mouse models of colorectal and mammary cancer. In this study, we investigated the effect of ITGB6 expression and antibody-mediated integrin αvβ6 inhibition on the tumor immune response in colorectal cancer.
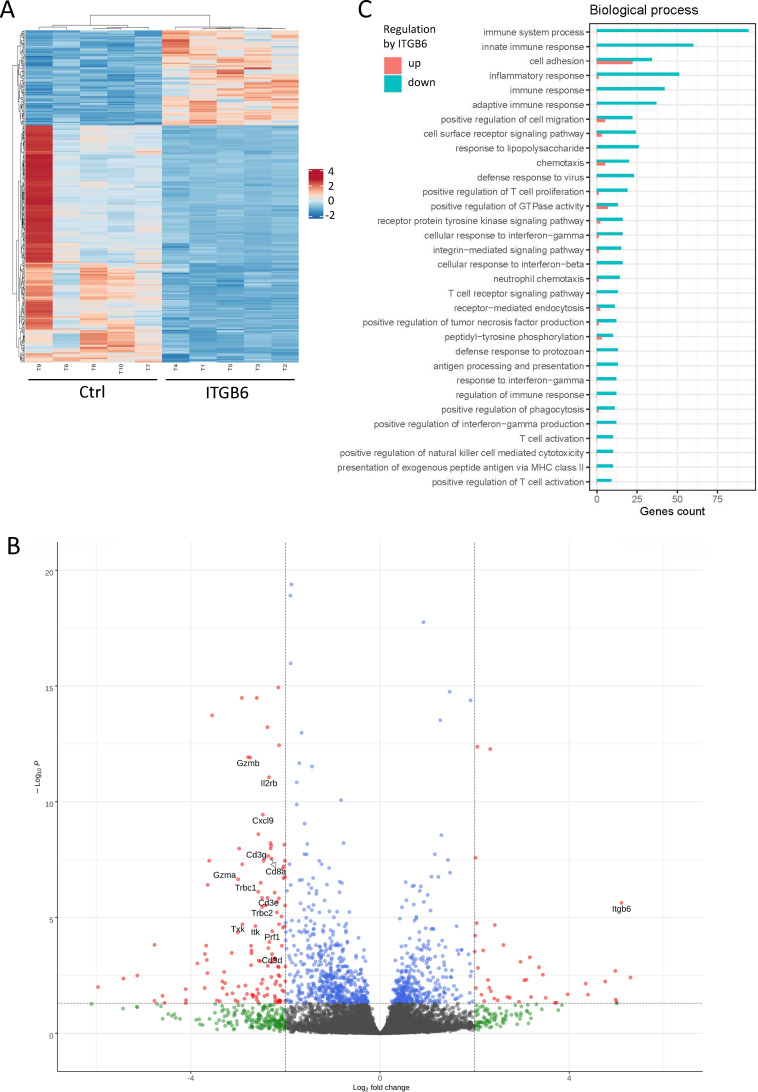
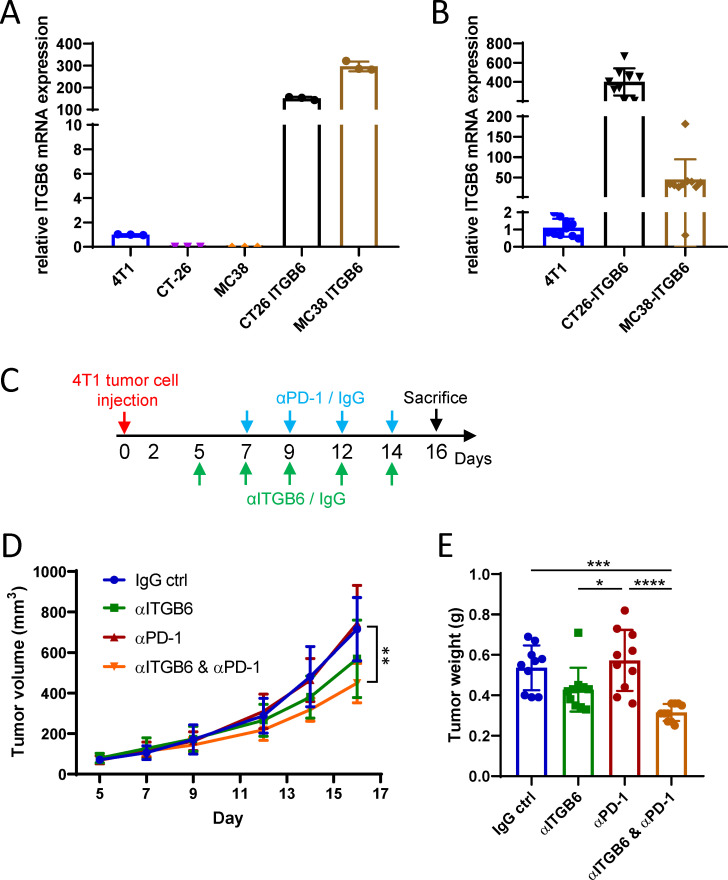
Methods: Using orthotopic and heterotopic tumor cell injection, we assessed the effect of ITGB6 on tumor growth and tumor immune response in wild type mice, mice with defective TGF-β signaling, and mice treated with anti-integrin αvβ6 antibodies. To examine the effect of ITGB6 in human colorectal cancer, we analyzed RNAseq data from the colon adenocarcinoma dataset of The Cancer Genome Atlas (TCGA-COAD).
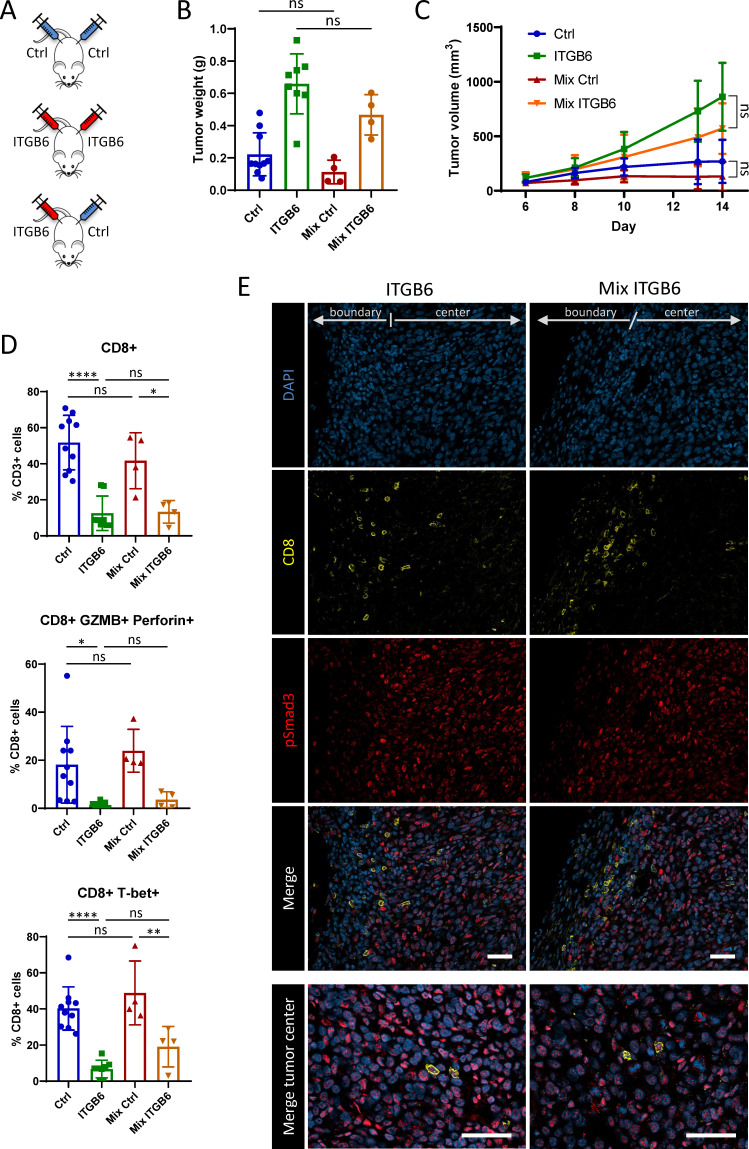
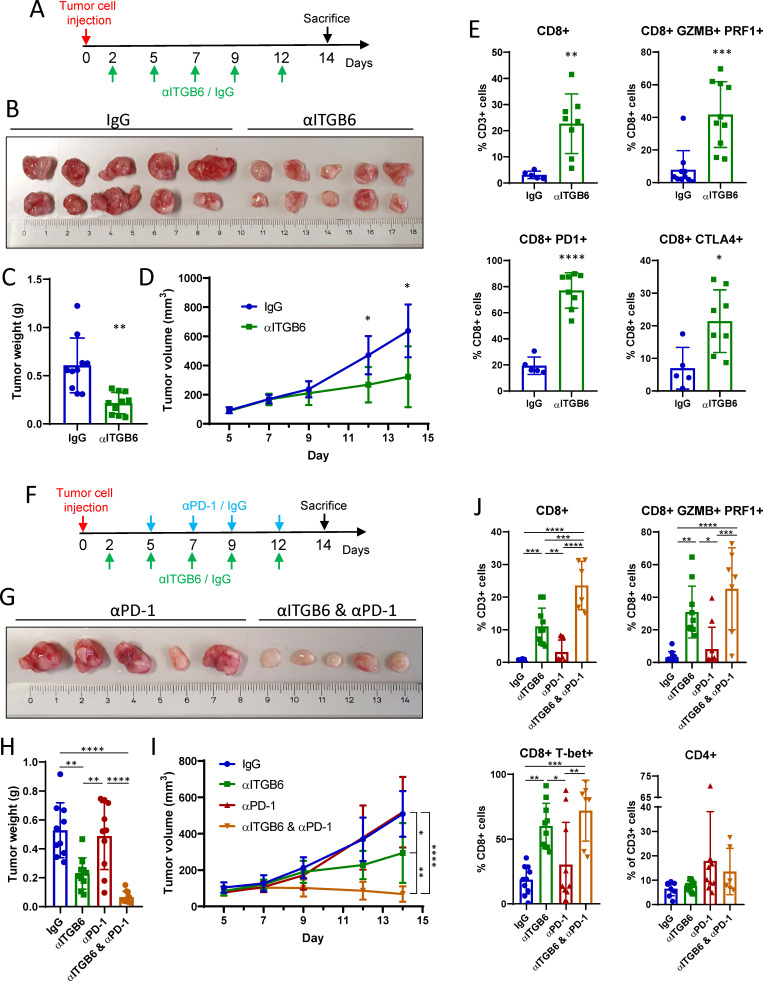
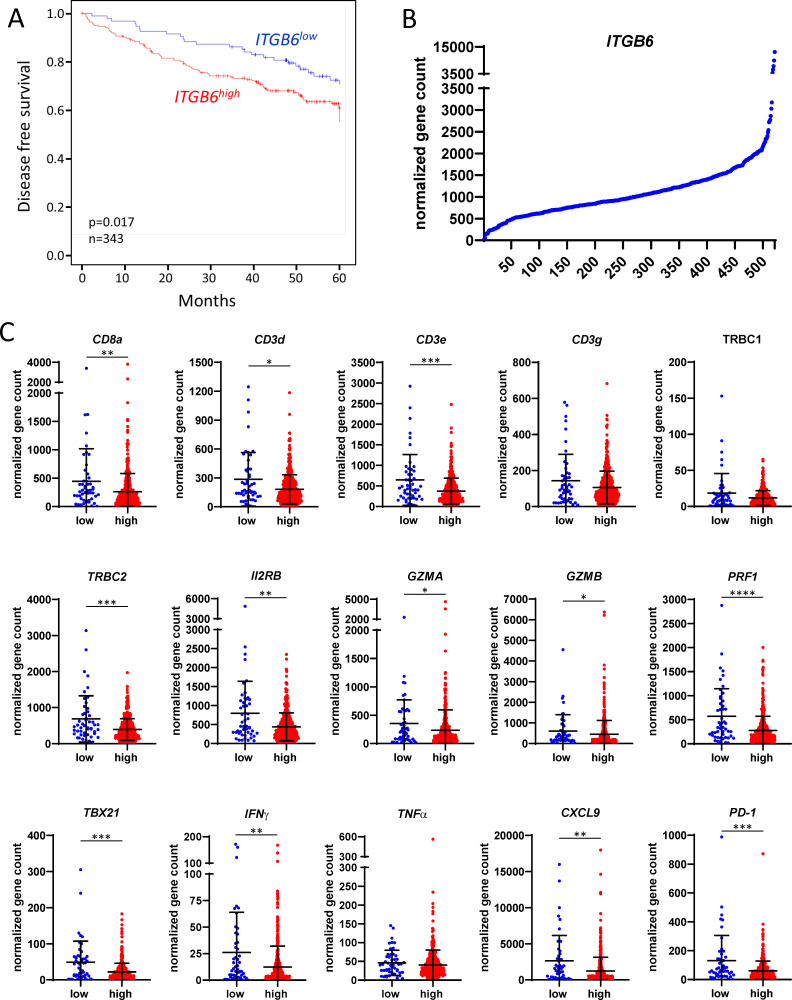
Results: We demonstrate that expression of ITGB6 is an immune evasion strategy in colorectal cancer, causing inhibition of the antitumor immune response and resistance to immune checkpoint blockade therapy by activating latent TGF-β. Antibody-mediated inhibition of integrin αvβ6 sparked a potent cytotoxic T-cell response and overcame resistance to programmed cell death protein 1 (PD-1) blockade therapy in ITGB6 expressing tumors, provoking a drastic increase in anti-PD-1 treatment efficacy. Further, we show that the majority of tumors in patients with colorectal cancer express sufficient ITGB6 to provoke inhibition of the cytotoxic T-cell response, indicating that most patients could benefit from integrin αvβ6 blockade therapy.
Conclusions: These findings propose inhibition of integrin αvβ6 as a promising new therapy for colorectal cancer, which blocks tumor-promoting TGF-β activation, prevents tumor exclusion of cytotoxic T-cells and enhances the efficacy of immune checkpoint blockade therapy.
Keywords: CD8-positive T-lymphocytes; cytotoxicity; drug evaluation; immunologic; immunotherapy; preclinical; tumor microenvironment.
© Author(s) (or their employer(s)) 2022. Re-use permitted under CC BY-NC. No commercial re-use. See rights and permissions. Published by BMJ.
Conflict of interest statement
Competing interests: None declared.
Figures
Similar articles
-
Inhibition of integrin alpha(v)beta6, an activator of latent transforming growth factor-beta, prevents radiation-induced lung fibrosis.Am J Respir Crit Care Med. 2008 Jan 1;177(1):82-90. doi: 10.1164/rccm.200706-806OC. Epub 2007 Oct 4. Am J Respir Crit Care Med. 2008. PMID: 17916808 Free PMC article.
-
Amplification of TGFβ Induced ITGB6 Gene Transcription May Promote Pulmonary Fibrosis.PLoS One. 2016 Aug 5;11(8):e0158047. doi: 10.1371/journal.pone.0158047. eCollection 2016. PLoS One. 2016. PMID: 27494713 Free PMC article.
-
Small extracellular vesicle-mediated ITGB6 siRNA delivery downregulates the αVβ6 integrin and inhibits adhesion and migration of recipient prostate cancer cells.Cancer Biol Ther. 2022 Dec 31;23(1):173-185. doi: 10.1080/15384047.2022.2030622. Cancer Biol Ther. 2022. PMID: 35188070 Free PMC article.
-
T-cell immunoglobulin and ITIM domain, as a potential immune checkpoint target for immunotherapy of colorectal cancer.IUBMB Life. 2021 May;73(5):726-738. doi: 10.1002/iub.2461. Epub 2021 Mar 30. IUBMB Life. 2021. PMID: 33686787 Review.
-
Exploring the role of ITGB6: fibrosis, cancer, and other diseases.Apoptosis. 2024 Jun;29(5-6):570-585. doi: 10.1007/s10495-023-01921-6. Epub 2023 Dec 21. Apoptosis. 2024. PMID: 38127283 Review.
Cited by
-
68Ga-Trivehexin PET/CT: a promising novel tracer for primary hyperparathyroidism.Eur J Nucl Med Mol Imaging. 2024 Nov;51(13):3912-3923. doi: 10.1007/s00259-024-06846-z. Epub 2024 Jul 19. Eur J Nucl Med Mol Imaging. 2024. PMID: 39028425 Free PMC article.
-
Effect of colorectal cancer stem cells on the development and metastasis of colorectal cancer.World J Gastrointest Oncol. 2024 Nov 15;16(11):4354-4368. doi: 10.4251/wjgo.v16.i11.4354. World J Gastrointest Oncol. 2024. PMID: 39554751 Free PMC article. Review.
-
DEPDC1B: A novel tumor suppressor gene associated with immune infiltration in colon adenocarcinoma.Cancer Med. 2024 Aug;13(15):e70043. doi: 10.1002/cam4.70043. Cancer Med. 2024. PMID: 39087856 Free PMC article.
-
Genome-wide associations with longevity and reproductive traits in U.S. rangeland ewes.Front Genet. 2024 May 27;15:1398123. doi: 10.3389/fgene.2024.1398123. eCollection 2024. Front Genet. 2024. PMID: 38859938 Free PMC article.
-
Exosomal ITGB6 from dormant lung adenocarcinoma cells activates cancer-associated fibroblasts by KLF10 positive feedback loop and the TGF-β pathway.Transl Lung Cancer Res. 2023 Dec 26;12(12):2520-2537. doi: 10.21037/tlcr-23-707. Epub 2023 Dec 14. Transl Lung Cancer Res. 2023. PMID: 38205211 Free PMC article.
References
Publication types
MeSH terms
Substances
LinkOut - more resources
Full Text Sources
Medical
Research Materials