. 2022 Apr 1;82(7):1283-1297.
doi: 10.1158/0008-5472.CAN-21-2161.

Chaperone-Mediated Autophagy Controls Proteomic and Transcriptomic Pathways to Maintain Glioma Stem Cell Activity

Affiliations

Chaperone-Mediated Autophagy Controls Proteomic and Transcriptomic Pathways to Maintain Glioma Stem Cell Activity

Jaione Auzmendi-Iriarte et al. Cancer Res. .

Abstract

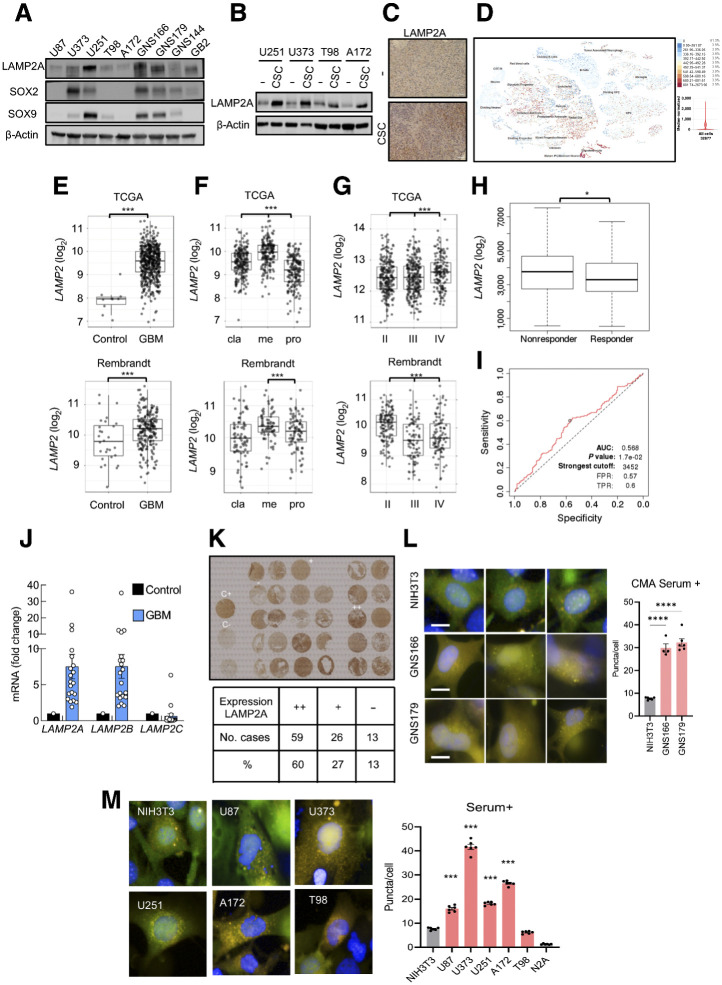
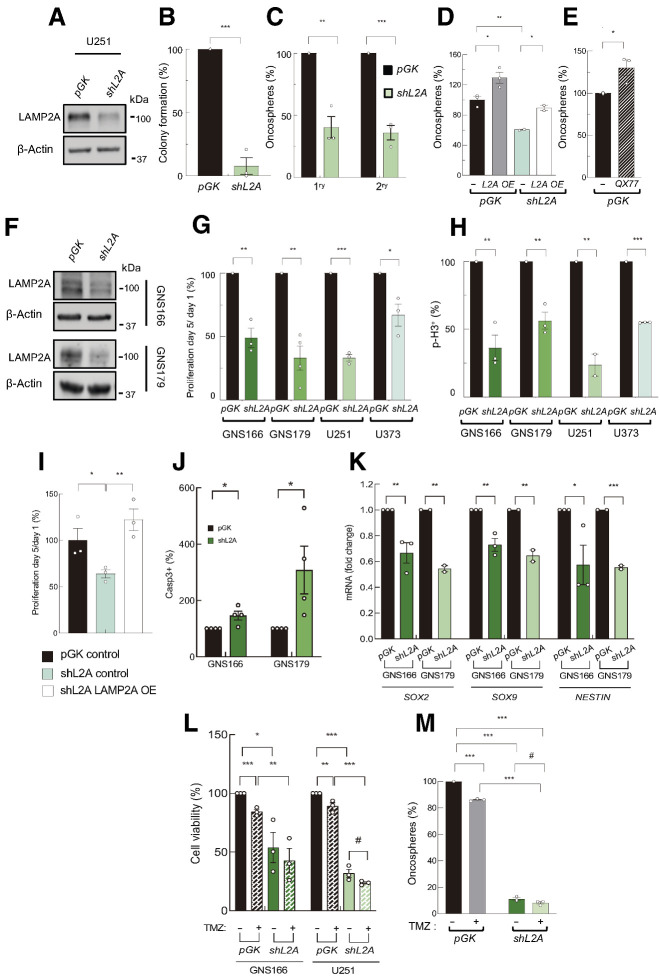
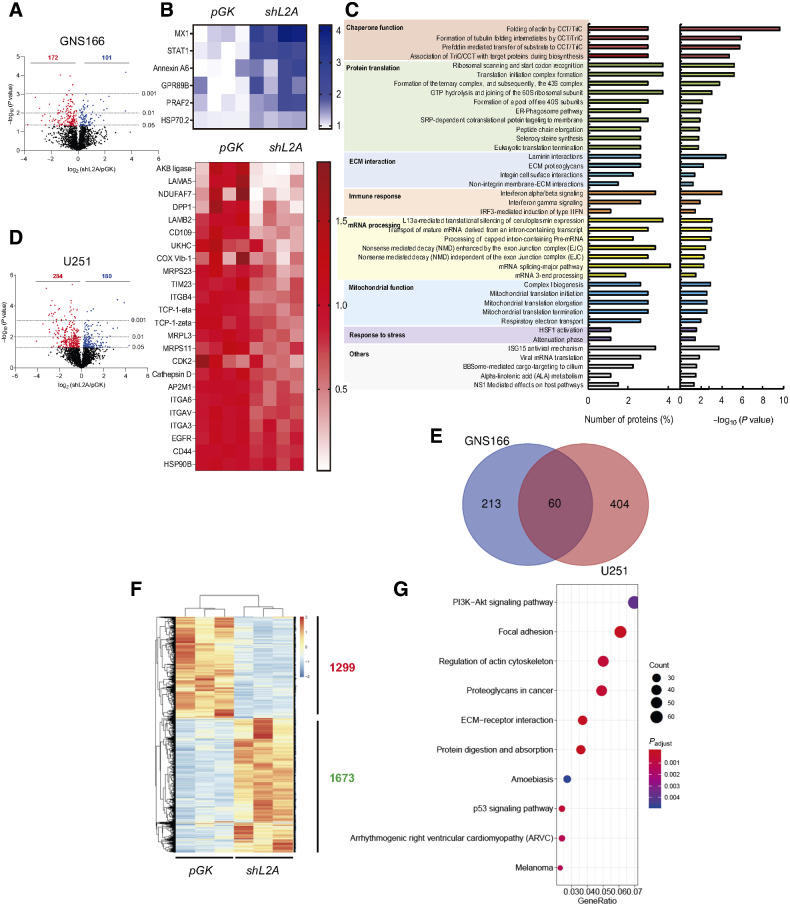
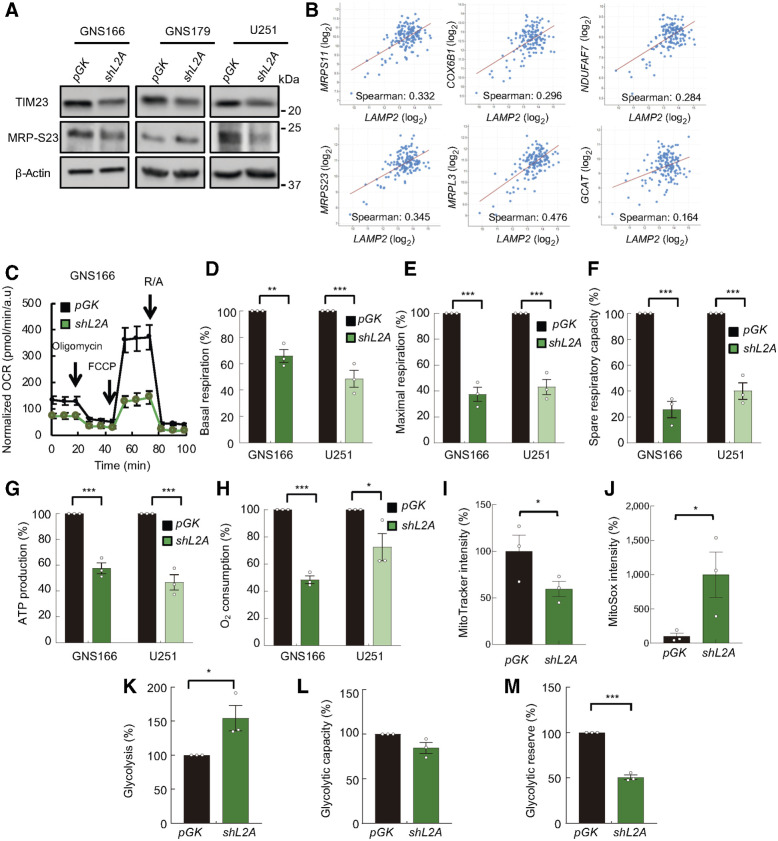
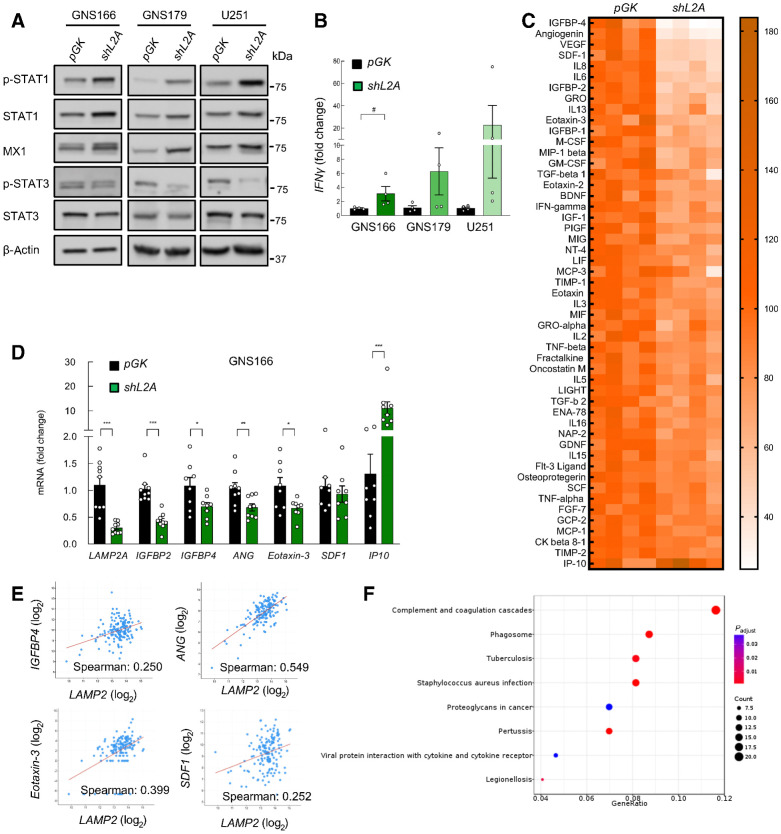
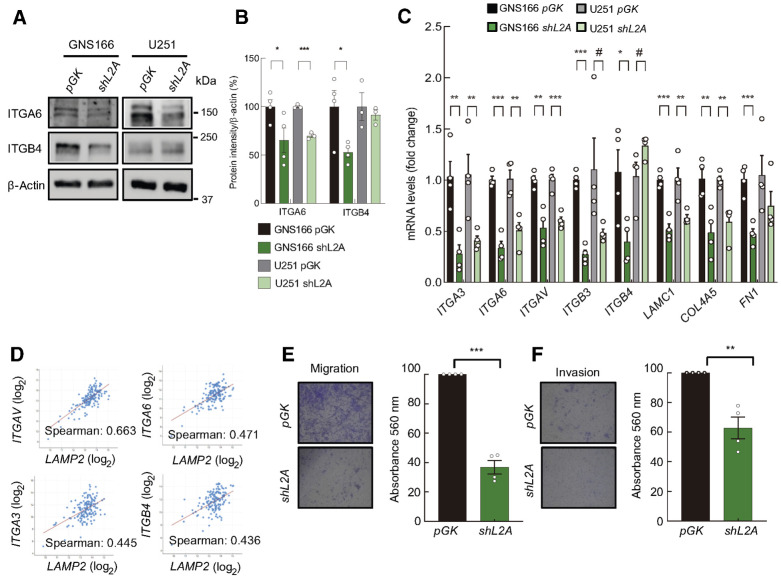
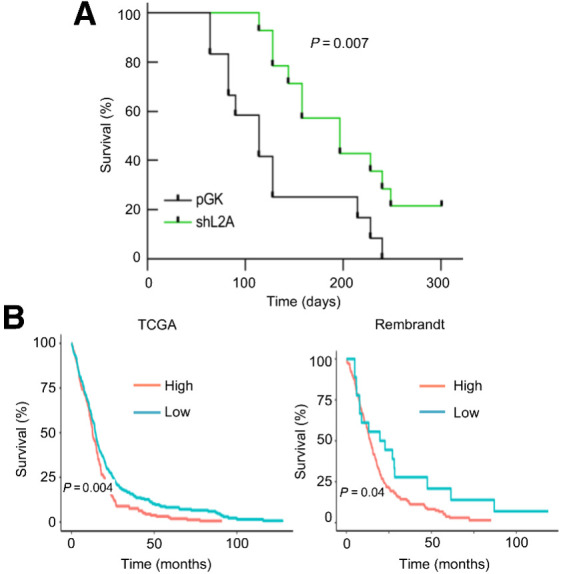
Chaperone-mediated autophagy (CMA) is a homeostatic process essential for the lysosomal degradation of a selected subset of the proteome. CMA activity directly depends on the levels of LAMP2A, a critical receptor for CMA substrate proteins at the lysosomal membrane. In glioblastoma (GBM), the most common and aggressive brain cancer in adulthood, high levels of LAMP2A in the tumor and tumor-associated pericytes have been linked to temozolomide resistance and tumor progression. However, the role of LAMP2A, and hence CMA, in any cancer stem cell type or in glioblastoma stem cells (GSC) remains unknown. In this work, we show that LAMP2A expression is enriched in patient-derived GSCs, and its depletion diminishes GSC-mediated tumorigenic activities. Conversely, overexpression of LAMP2A facilitates the acquisition of GSC properties. Proteomic and transcriptomic analysis of LAMP2A-depleted GSCs revealed reduced extracellular matrix interaction effectors in both analyses. Moreover, pathways related to mitochondrial metabolism and the immune system were differentially deregulated at the proteome level. Furthermore, clinical samples of GBM tissue presented overexpression of LAMP2, which correlated with advanced glioma grade and poor overall survival. In conclusion, we identified a novel role of CMA in directly regulating GSCs activity via multiple pathways at the proteome and transcriptome levels.

Significance: A receptor of chaperone-mediated autophagy regulates glioblastoma stem cells and may serve as a potential biomarker for advanced tumor grade and poor survival in this disease.


Figures

Figure 1. LAMP2 is overexpressed in human GBM and GSCs. A, Representative immunoblot of LAMP2A, SOX2, SOX9, and β-actin in a set of glioma (U87, U373, U251, T98, A172) and patient-derived glioma stem (GNS166, GNS179, GNS144, GB2) cell lines (n = 4). B, Representative image of Western blot analysis for LAMP2A and β-actin in parental and 2ry oncospheres of glioma cell lines (n = 3). C, Representative images of the IHC staining of LAMP2A in subcutaneous tumors from parental U373 and respective oncospheres (n = 2). Scale bar, 100 μm. D, Single-cell RNA-seq results for the expression of LAMP2 among different cell types in glioblastoma samples (https://cells.ucsc.edu/?ds=gbm). E, LAMP2 mRNA expression in control and GBM samples in TCGA (P = 2.4e−13) and Rembrandt (P = 4.5E−03) cohorts. F, mRNA expression of LAMP2 in classical (cla), mesenchymal (me), and proneural (pro) subtypes of GBM from TCGA cohort (Pcla-me = 2.9e−09, Pcla-pro = 2.9e–08, Pme-pro = 4.5e−27) and Rembrandt cohort (Pcla-me = 4.8E−02, Pcla-pro = n.s., Pme-pro = 6.3E−04). G, LAMP2 mRNA expression in grade II–IV of glioma in TCGA (PII–III = n.s., PII–IV = 1.3e−02, PIII–IV = 7.5e−03) and Rembrandt (PII–III = n.s, PII–IV = 3.5e−05, PIII–IV = 3.1e−08) cohorts. H, LAMP2 expression in TMZ treatment of nonresponder (n = 154) and responder (n = 165) patients with GBM (http://www.rocplot.org/). Mann–Whitney test P value: 0.036. I, ROC curve of LAMP2 gene expression in patients with GBM treated with TMZ (n = 319; http://www.rocplot.org/). J, mRNA expression of LAMP2A, LAMP2B, and LAMP2C in GBM samples (n = 20) compared with a mix of healthy brain tissues. K, Representative tissue microarray and overall quantification for LAMP2A protein expression in GBM samples (n = 98). L and M, Representative image and quantification of CMA activity as the average number of puncta per cell (n > 1,500 cells per well in 4–6 independent wells) after transducing control (NIH3T3, N2A), GSCs (GNS166 and 179), and indicated GBM cell lines with photo switchable KFERQ-Dendra CMA reporter. Scale bar, 10 mm. Differences with NIH3T3 cells are compared. *, P ≤ 0.05; ***, P ≤ 0.001; ****, P < 0.0001.
Figure 1.
LAMP2 is overexpressed in human GBM and GSCs. A, Representative immunoblot of LAMP2A, SOX2, SOX9, and β-actin in a set of glioma (U87, U373, U251, T98, A172) and patient-derived glioma stem (GNS166, GNS179, GNS144, GB2) cell lines (n = 4). B, Representative image of Western blot analysis for LAMP2A and β-actin in parental and 2ry oncospheres of glioma cell lines (n = 3). C, Representative images of the IHC staining of LAMP2A in subcutaneous tumors from parental U373 and respective oncospheres (n = 2). Scale bar, 100 μm. D, Single-cell RNA-seq results for the expression of LAMP2 among different cell types in glioblastoma samples (https://cells.ucsc.edu/?ds=gbm). E,LAMP2 mRNA expression in control and GBM samples in TCGA (P = 2.4e−13) and Rembrandt (P = 4.5E−03) cohorts. F, mRNA expression of LAMP2 in classical (cla), mesenchymal (me), and proneural (pro) subtypes of GBM from TCGA cohort (Pcla-me = 2.9e−09, Pcla-pro = 2.9e–08, Pme-pro = 4.5e−27) and Rembrandt cohort (Pcla-me = 4.8E−02, Pcla-pro = n.s., Pme-pro = 6.3E−04). G,LAMP2 mRNA expression in grade II–IV of glioma in TCGA (PII–III = n.s., PII–IV = 1.3e−02, PIII–IV = 7.5e−03) and Rembrandt (PII–III = n.s, PII–IV = 3.5e−05, PIII–IV = 3.1e−08) cohorts. H,LAMP2 expression in TMZ treatment of nonresponder (n = 154) and responder (n = 165) patients with GBM (http://www.rocplot.org/). Mann–Whitney test P value: 0.036. I, ROC curve of LAMP2 gene expression in patients with GBM treated with TMZ (n = 319; http://www.rocplot.org/). J, mRNA expression of LAMP2A, LAMP2B, and LAMP2C in GBM samples (n = 20) compared with a mix of healthy brain tissues. K, Representative tissue microarray and overall quantification for LAMP2A protein expression in GBM samples (n = 98). L and M, Representative image and quantification of CMA activity as the average number of puncta per cell (n > 1,500 cells per well in 4–6 independent wells) after transducing control (NIH3T3, N2A), GSCs (GNS166 and 179), and indicated GBM cell lines with photo switchable KFERQ-Dendra CMA reporter. Scale bar, 10 mm. Differences with NIH3T3 cells are compared. *, P ≤ 0.05; ***, P ≤ 0.001; ****, P < 0.0001.
Figure 2. LAMP2A silencing reduces GSC proliferation and tumorigenicity. A, Representative Western blot analysis for LAMP2A and β-actin in pGK and shL2A U251 cells (n = 3). B, Relative number of colonies formed by pGK and shL2A U251 cells (n = 3). C, Relative number of primary and secondary oncospheres generated by pGK and shL2A U251 cells at 10 and 20 days, respectively (n = 3). D, Relative number of primary oncospheres generated by control and LAMP2A overexpressing cells in pGK or shL2A U251 (n = 3). E, Relative number of oncospheres generated by control or after 20 μmol/L QX77 treatment (n = 3). F, Immunoblot of LAMP2A in pGK and shL2A GNS166 and GNS179 cells (n = 3). G, Number of proliferating cells at day 5 relative to day 1 in pGK and shL2A indicated cells (n ≥ 3). H, Quantification of immunofluorescence of p-H3 in pGK and shL2A GNS166 (n = 3), GNS179 (n = 4), U251 (n = 2), and U373 (n = 3) cells. I, Number of proliferating cells at day 5 relative to day 1 after LAMP2A expression rescue (n = 3). J, Quantification of immunofluorescence of caspase-3 in pGK and shL2A GNS166 and GNS179 cells (n = 4). K, Relative mRNA expression of GSC markers SOX2, SOX9, and NESTIN in pGK and shL2A GNS166 (n = 3) and GNS179 cells (n = 2). L, Relative cell viability of pGK and shL2A GNS166 and U251 cells after 72 hours with control and 2 mmol/L or 250 μmol/LTMZ treatment, respectively (n = 3). M, Relative primary oncospheres generated by pGK and shL2A U251 cells, after 50 μmol/L TMZ treatment (n = 3). #, P ≤ 0.1; *, P ≤ 0.05; **, P ≤ 0.01; ***, P ≤ 0.001.
Figure 2.
LAMP2A silencing reduces GSC proliferation and tumorigenicity. A, Representative Western blot analysis for LAMP2A and β-actin in pGK and shL2A U251 cells (n = 3). B, Relative number of colonies formed by pGK and shL2A U251 cells (n = 3). C, Relative number of primary and secondary oncospheres generated by pGK and shL2A U251 cells at 10 and 20 days, respectively (n = 3). D, Relative number of primary oncospheres generated by control and LAMP2A overexpressing cells in pGK or shL2A U251 (n = 3). E, Relative number of oncospheres generated by control or after 20 μmol/L QX77 treatment (n = 3). F, Immunoblot of LAMP2A in pGK and shL2A GNS166 and GNS179 cells (n = 3). G, Number of proliferating cells at day 5 relative to day 1 in pGK and shL2A indicated cells (n ≥ 3). H, Quantification of immunofluorescence of p-H3 in pGK and shL2A GNS166 (n = 3), GNS179 (n = 4), U251 (n = 2), and U373 (n = 3) cells. I, Number of proliferating cells at day 5 relative to day 1 after LAMP2A expression rescue (n = 3). J, Quantification of immunofluorescence of caspase-3 in pGK and shL2A GNS166 and GNS179 cells (n = 4). K, Relative mRNA expression of GSC markers SOX2, SOX9, and NESTIN in pGK and shL2A GNS166 (n = 3) and GNS179 cells (n = 2). L, Relative cell viability of pGK and shL2A GNS166 and U251 cells after 72 hours with control and 2 mmol/L or 250 μmol/LTMZ treatment, respectively (n = 3). M, Relative primary oncospheres generated by pGK and shL2A U251 cells, after 50 μmol/L TMZ treatment (n = 3). #, P ≤ 0.1; *, P ≤ 0.05; **, P ≤ 0.01; ***, P ≤ 0.001.
Figure 3. LAMP2A silencing in GSCs alters crucial proteomic and transcriptomic pathways. A, Volcano plot of upregulated and downregulated proteins in proteome study of GNS166 pGK versus shL2A cells (n = 4). B, Representative heat maps of upregulated and downregulated proteins in the proteome study. C, Ontology analysis based on Reactome database of altered proteome. D, Volcano plot of upregulated and downregulated proteins in U251 pGK versus shL2A proteomics (n = 4). E, Venn diagram representing the comparison of proteins altered in GNS166 and U251 proteomic studies. F, Representative heatmap of upregulated and downregulated transcripts in RNA-seq study of pGK vs. shL2A GNS166 cells (n = 3). G, Dot plot representation of the main altered biological processes after gene ontology analysis of RNA-seq study in F.
Figure 3.
LAMP2A silencing in GSCs alters crucial proteomic and transcriptomic pathways. A, Volcano plot of upregulated and downregulated proteins in proteome study of GNS166 pGK versus shL2A cells (n = 4). B, Representative heat maps of upregulated and downregulated proteins in the proteome study. C, Ontology analysis based on Reactome database of altered proteome. D, Volcano plot of upregulated and downregulated proteins in U251 pGK versus shL2A proteomics (n = 4). E, Venn diagram representing the comparison of proteins altered in GNS166 and U251 proteomic studies. F, Representative heatmap of upregulated and downregulated transcripts in RNA-seq study of pGK vs. shL2A GNS166 cells (n = 3). G, Dot plot representation of the main altered biological processes after gene ontology analysis of RNA-seq study in F.
Figure 4. LAMP2A silencing diminishes mitochondrial metabolism and induces glycolysis in GSCs. A, Immunoblot of mitochondrial markers TIM23 and MRP-S23, and β-actin in pGK and shL2A GNS166, GNS179, and U251 (n ≥ 3) cells; β-actin blots in U251 and GNS179 were shared with Fig. 5A. B, Association study of LAMP2 with metabolism genes MRPS23 (P = 1.336e−05), MRPS11 (P = 2.972e−05), MRPL3 (P = 5.80e−10), COX6B1 (P = 2.086e−04), NDUFAF7 (P = 3.970e−04), and GCAT (AKB ligase; P = 0.0430) in TCGA cohort (cBioPortal for cancer genomics, https://www.cbioportal.org/). C, Normalized OCR response in pGK (black) and shL2A (green) GNS166 in basal conditions and after consecutive addition of oligomycin 1 μmol/L, FCCP 1 μmol/L, and rotenone/antimycin A 1 μmol/L. A representative experiment is shown from a total of n = 3. D–H, Quantification of mitochondrial respiratory functions of pGK and shL2A GNS166 and U251 (n = 3). I, Quantification of mitochondrial polarization measured by fluorescent intensity of MitoTracker Red FM dye via flow cytometry (n = 3). J, Quantification of mitochondrial ROS analyzed by MitoSox Red via flow cytometry (n = 3). K–M, Quantification of glycolytic functions based on kinetic normalized ECAR response of pGK and shL2A GNS166 in basal conditions and after consecutive addition of glucose 10 mmol/L, oligomycin 1 μmol/L, and 2-D-deoxy-glucose 50 mmol/L (n = 3). *, P ≤ 0.05; **, P ≤ 0.01; ***, P ≤ 0.001.
Figure 4.
LAMP2A silencing diminishes mitochondrial metabolism and induces glycolysis in GSCs. A, Immunoblot of mitochondrial markers TIM23 and MRP-S23, and β-actin in pGK and shL2A GNS166, GNS179, and U251 (n ≥ 3) cells; β-actin blots in U251 and GNS179 were shared with Fig. 5A. B, Association study of LAMP2 with metabolism genes MRPS23 (P = 1.336e−05), MRPS11 (P = 2.972e−05), MRPL3 (P = 5.80e−10), COX6B1 (P = 2.086e−04), NDUFAF7 (P = 3.970e−04), and GCAT (AKB ligase; P = 0.0430) in TCGA cohort (cBioPortal for cancer genomics, https://www.cbioportal.org/). C, Normalized OCR response in pGK (black) and shL2A (green) GNS166 in basal conditions and after consecutive addition of oligomycin 1 μmol/L, FCCP 1 μmol/L, and rotenone/antimycin A 1 μmol/L. A representative experiment is shown from a total of n = 3. D–H, Quantification of mitochondrial respiratory functions of pGK and shL2A GNS166 and U251 (n = 3). I, Quantification of mitochondrial polarization measured by fluorescent intensity of MitoTracker Red FM dye via flow cytometry (n = 3). J, Quantification of mitochondrial ROS analyzed by MitoSox Red via flow cytometry (n = 3). K–M, Quantification of glycolytic functions based on kinetic normalized ECAR response of pGK and shL2A GNS166 in basal conditions and after consecutive addition of glucose 10 mmol/L, oligomycin 1 μmol/L, and 2-D-deoxy-glucose 50 mmol/L (n = 3). *, P ≤ 0.05; **, P ≤ 0.01; ***, P ≤ 0.001.
Figure 5. LAMP2A downregulation reduces cytokine secretion of GSCs. A, Representative immunoblot of indicated proteins in pGK versus shL2A GNS166, GNS179, and U251 (n ≥ 3). β-Actin blots in this figure and Fig. 4A in GNS179 and U251 are the same as they derive from the same samples. B, Relative mRNA expression of IFNγ in pGK and shL2A GNS166, GNS179, and U251 cells (n = 4). C, Representative heatmap of the altered secretion of cytokines from supernatants of GNS166 pGK and shL2A (P < 0.05, n = 4). D, Relative mRNA expression of LAMP2A, IGFBP2, IGFBP4, ANG, Eotaxin-3, SDF-1, and IP10 in pGK and shL2A GNS166 (n = 8). E, Association study of LAMP2 with IGFBP4 (P = 1.904e−03), ANG (P = 2.40e−13), Eotaxin-3 (P = 3.56e−07), and SDF1 (P = 1.701e−03) in the TCGA cohort (cBioPortal for cancer genomics, https://www.cbioportal.org/). F, Dot plot of KEGG enrichment analysis of LAMP2 high versus low in the TCGA cohort (P < 0.05). #, P ≤ 0.1; *, P ≤ 0.05; **, P ≤ 0.01; ***, P ≤ 0.001.
Figure 5.
LAMP2A downregulation reduces cytokine secretion of GSCs. A, Representative immunoblot of indicated proteins in pGK versus shL2A GNS166, GNS179, and U251 (n ≥ 3). β-Actin blots in this figure and Fig. 4A in GNS179 and U251 are the same as they derive from the same samples. B, Relative mRNA expression of IFNγ in pGK and shL2A GNS166, GNS179, and U251 cells (n = 4). C, Representative heatmap of the altered secretion of cytokines from supernatants of GNS166 pGK and shL2A (P < 0.05, n = 4). D, Relative mRNA expression of LAMP2A, IGFBP2, IGFBP4, ANG, Eotaxin-3, SDF-1, and IP10 in pGK and shL2A GNS166 (n = 8). E, Association study of LAMP2 with IGFBP4 (P = 1.904e−03), ANG (P = 2.40e−13), Eotaxin-3 (P = 3.56e−07), and SDF1 (P = 1.701e−03) in the TCGA cohort (cBioPortal for cancer genomics, https://www.cbioportal.org/). F, Dot plot of KEGG enrichment analysis of LAMP2 high versus low in the TCGA cohort (P < 0.05). #, P ≤ 0.1; *, P ≤ 0.05; **, P ≤ 0.01; ***, P ≤ 0.001.
Figure 6. LAMP2A silencing in GSCs diminishes ECM interaction and content. A and B, Representative immunoblot of ITGA6, ITGB4, and β-actin in GNS166 (n = 4) and U251 (n = 3) cells (A), and respective quantification (B). C, Relative mRNA expression of ECM interaction markers ITGA3, ITGA6, ITGAV, ITGB3, ITGB4, LAMC1, COL4A5, and FN1 in pGK and shL2A GNS166 and U251 cells (n = 3/4). D, Association study of LAMP2 with ITGAV (P = 1.31e−20), ITGA6 (P = 8.90e−10), ITGA3 (P = 8.92e−09), and ITGB4 (P = 1.98e−08) in the TCGA cohort (cBioPortal for cancer genomics, https://www.cbioportal.org/). E and F, Representative images (left; E) and quantification (right) of migration and invasion of pGK and shL2A GNS166 cells (n = 4; F). #, P ≤ 0.1; *, P ≤ 0.05; **, P ≤ 0.01; ***, P ≤ 0.001.
Figure 6.
LAMP2A silencing in GSCs diminishes ECM interaction and content. A and B, Representative immunoblot of ITGA6, ITGB4, and β-actin in GNS166 (n = 4) and U251 (n = 3) cells (A), and respective quantification (B). C, Relative mRNA expression of ECM interaction markers ITGA3, ITGA6, ITGAV, ITGB3, ITGB4, LAMC1, COL4A5, and FN1 in pGK and shL2A GNS166 and U251 cells (n = 3/4). D, Association study of LAMP2 with ITGAV (P = 1.31e−20), ITGA6 (P = 8.90e−10), ITGA3 (P = 8.92e−09), and ITGB4 (P = 1.98e−08) in the TCGA cohort (cBioPortal for cancer genomics, https://www.cbioportal.org/). E and F, Representative images (left; E) and quantification (right) of migration and invasion of pGK and shL2A GNS166 cells (n = 4; F). #, P ≤ 0.1; *, P ≤ 0.05; **, P ≤ 0.01; ***, P ≤ 0.001.
Figure 7. LAMP2A correlates with poor overall survival in GBM. A, Kaplan–Meier survival curve of orthotopic intracranial xenograft of GNS166 pGK and shL2A cells in NOD.SCID immunodeficient mice (n = 12 per condition). B, Kaplan–Meier curves representing survival of patients with low versus high expression of LAMP2 in TCGA (left, n = 340 vs. n = 185, respectively) and Rembrandt (right, n = 18 vs. n = 185, respectively) cohorts. Optimal cutoff points for Kaplan–Meier curves were designated by GlioVis database.
Figure 7.
LAMP2A correlates with poor overall survival in GBM. A, Kaplan–Meier survival curve of orthotopic intracranial xenograft of GNS166 pGK and shL2A cells in NOD.SCID immunodeficient mice (n = 12 per condition). B, Kaplan–Meier curves representing survival of patients with low versus high expression of LAMP2 in TCGA (left, n = 340 vs. n = 185, respectively) and Rembrandt (right, n = 18 vs. n = 185, respectively) cohorts. Optimal cutoff points for Kaplan–Meier curves were designated by GlioVis database.

Comment in

References

    1. Louis DN, Perry A, Reifenberger G, von Deimling A, Figarella-Branger D, Cavenee WK, et al. . The 2016 World Health Organization Classification of Tumors of the Central Nervous System: a summary. Acta Neuropathol 2016;131:803–20. - PubMed
    1. Yang K, Niu L, Bai Y, Le W. Glioblastoma: targeting the autophagy in tumorigenesis. Brain Res Bull 2019;153:334–40. - PubMed
    1. Abdrakhmanov A, Gogvadze V, Zhivotovsky B. To eat or to die: deciphering selective forms of autophagy. Trends Biochem Sci 2020;45:347–64. - PubMed
    1. Kaushik S, Cuervo AM. The coming of age of chaperone-mediated autophagy. Nat Rev Mol Cell Biol 2018;19:365–81. - PMC - PubMed
    1. Cuervo AM, Knecht E, Terlecky SR, Dice JF. Activation of a selective pathway of lysosomal proteolysis in rat liver by prolonged starvation. Am J Physiol 1995;269:C1200–8. - PubMed

Publication types

Substances