. 2022 Mar 15;82(6):1098-1109.
doi: 10.1158/0008-5472.CAN-21-3386.

Transient Inhibition of the JAK/STAT Pathway Prevents B-ALL Development in Genetically Predisposed Mice

Affiliations

Transient Inhibition of the JAK/STAT Pathway Prevents B-ALL Development in Genetically Predisposed Mice

Ana Casado-García et al. Cancer Res. .

Abstract

Preventing development of childhood B-cell acute lymphoblastic leukemia (B-ALL), a disease with devastating effects, is a longstanding and unsolved challenge. Heterozygous germline alterations in the PAX5 gene can lead to B-ALL upon accumulation of secondary mutations affecting the JAK/STAT signaling pathway. Preclinical studies have shown that this malignant transformation occurs only under immune stress such as exposure to infectious pathogens. Here we show in Pax5+/- mice that transient, early-life administration of clinically relevant doses of ruxolitinib, a JAK1/2 inhibitor, significantly mitigates the risk of B-ALL following exposure to infection; 1 of 29 animals treated with ruxolitinib developed B-ALL versus 8 of 34 untreated mice. Ruxolitinib treatment preferentially targeted Pax5+/- versus wild-type B-cell progenitors and exerted unique effects on the Pax5+/- B-cell progenitor transcriptional program. These findings provide the first in vivo evidence for a potential strategy to prevent B-ALL development.

Significance: JAK/STAT inhibition suppresses tumorigenesis in a B-ALL-susceptible mouse model, presenting a novel approach to prevent B-ALL onset.


Figures

Figure 1. Ruxolitinib pilot study. A, Experimental plan for ruxolitinib pilot study. Pax5+/− (gray) mice were born under SPF conditions (green). Two groups of 3-month-old Pax5+/− mice were treated for 14 days with two different doses of ruxolitinib (n = 5; 0.375 g/kg food and n = 5; 0.75 g/kg food) at the time of exposure to infections (orange). Blood samples were collected 2 hours after start of the active dark phase (corresponding to Cmax) and 2 hours prior to the end of the inactive light phase (corresponding to Cmin) three times per week during the treatment period. B, Food consumption per cage was measured daily and back calculated to an average food intake per mouse per day. C, Ruxolitinib concentration in the blood was determined by LC/MS-MS for the different doses of ruxolitinib being examined. Mean blood concentration ± SEM for each day and at the corresponding phase (active: Cmax or inactive: Cmin) is represented in the graph.
Figure 1.
Ruxolitinib pilot study. A, Experimental plan for ruxolitinib pilot study. Pax5+/− (gray) mice were born under SPF conditions (green). Two groups of 3-month-old Pax5+/− mice were treated for 14 days with two different doses of ruxolitinib (n = 5; 0.375 g/kg food and n = 5; 0.75 g/kg food) at the time of exposure to infections (orange). Blood samples were collected 2 hours after start of the active dark phase (corresponding to Cmax) and 2 hours prior to the end of the inactive light phase (corresponding to Cmin) three times per week during the treatment period. B, Food consumption per cage was measured daily and back calculated to an average food intake per mouse per day. C, Ruxolitinib concentration in the blood was determined by LC/MS-MS for the different doses of ruxolitinib being examined. Mean blood concentration ± SEM for each day and at the corresponding phase (active: Cmax or inactive: Cmin) is represented in the graph.
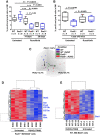
Figure 2. Impact of ruxolitinib in preleukemic cells. A, Flow cytometric analysis of Pax5+/− (n = 4–9) and WT (n = 4–8) mice treated with ruxolitinib (for 14 or 28 days) identified a significant decrease of bone marrow pro-B and pre-B cells (B220lowIgM−) due to the treatment. Box plots horizontal bars represent the mean ± SD. To determine statistical significance, an unpaired t test was used. B, Percentage of BM pro-B and pre-B cells (B220lowIgM−) of 1-year-old Pax5+/− (n = 5) and WT (n = 5) mice that were previously treated with ruxolitinib for 28 days and compared with age-matched untreated Pax5+/− (n = 7) and WT (n = 4) mice. Box plots horizontal bars represent the mean ± SD. To determine statistical significance, an unpaired t test was used. C, Principal component analysis plot showing the differences in gene expression of B220+ BM cells from Pax5+/− mice treated with ruxolitinib (red dots; n = 4), untreated Pax5+/− mice (green dots; n = 4), ruxolitinib-treated WT mice (purple dots; n = 5), and untreated WT mice (blue dots; n = 5). Dotted arrows represent the ruxolitinib treatment effect on gene expression of B220+ BM cells from WT and Pax5+/− mice. RUXO, ruxolitinib. D, Unsupervised heatmap showing the significant differentially expressed genes (1,504 genes-probesets) between B220+ bone marrow cells from Pax5+/− mice treated with ruxolitinib during 2 weeks (n = 4) and Pax5+/− untreated mice (n = 4). E, Unsupervised heatmap showing the significant differentially expressed genes (294 genes-probesets) between B220+ BM cells from control-WT mice treated with ruxolitinib during 2 weeks (n = 5) and control-WT untreated mice (n = 5). The significance analysis of microarrays was defined by an FDR = 0.015%.
Figure 2.
Impact of ruxolitinib in preleukemic cells. A, Flow cytometric analysis of Pax5+/− (n = 4–9) and WT (n = 4–8) mice treated with ruxolitinib (for 14 or 28 days) identified a significant decrease of bone marrow pro-B and pre-B cells (B220lowIgM) due to the treatment. Box plots horizontal bars represent the mean ± SD. To determine statistical significance, an unpaired t test was used. B, Percentage of BM pro-B and pre-B cells (B220lowIgM) of 1-year-old Pax5+/− (n = 5) and WT (n = 5) mice that were previously treated with ruxolitinib for 28 days and compared with age-matched untreated Pax5+/− (n = 7) and WT (n = 4) mice. Box plots horizontal bars represent the mean ± SD. To determine statistical significance, an unpaired t test was used. C, Principal component analysis plot showing the differences in gene expression of B220+ BM cells from Pax5+/− mice treated with ruxolitinib (red dots; n = 4), untreated Pax5+/− mice (green dots; n = 4), ruxolitinib-treated WT mice (purple dots; n = 5), and untreated WT mice (blue dots; n = 5). Dotted arrows represent the ruxolitinib treatment effect on gene expression of B220+ BM cells from WT and Pax5+/− mice. RUXO, ruxolitinib. D, Unsupervised heatmap showing the significant differentially expressed genes (1,504 genes-probesets) between B220+ bone marrow cells from Pax5+/− mice treated with ruxolitinib during 2 weeks (n = 4) and Pax5+/− untreated mice (n = 4). E, Unsupervised heatmap showing the significant differentially expressed genes (294 genes-probesets) between B220+ BM cells from control-WT mice treated with ruxolitinib during 2 weeks (n = 5) and control-WT untreated mice (n = 5). The significance analysis of microarrays was defined by an FDR = 0.015%.
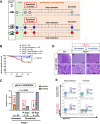
Figure 3. Ruxolitinib treatment prevents infection-driven B-ALL development in Pax5+/− predisposed mice. A, Study design. Pax5+/− (gray; n = 71) and WT (white; n = 42) mice were born under SPF conditions (green). After 1 month of age, the mice were transferred to a conventional facility providing a natural infectious environment (orange). At the time of exposure to infections, a group of Pax5+/− mice (n = 8) was treated with ruxolitinib (0.75 g/kg food) for 14 days (gray circles). Two additional groups of Pax5+/− (n = 29) and WT (n = 19) mice were treated with ruxolitinib (0.75 g/kg food) for 28 days (blue circles) and the remaining Pax5+/− (n = 34) and WT (n = 23) mice were treated with vehicle (red circles). The lifespan of the mice included in the study is indicated by a horizontal blue bar (in months). B, B-ALL–specific survival of mice treated with ruxolitinib for 28 days (Pax5+/−, blue line, n = 29; WT, green line, n = 19), Pax5+/− mice treated with ruxolitinib for 14 days (gray line, n = 8), and nontreated mice (Pax5+/−, red line, n = 34; WT, black line, n = 23) following exposure to common infections. Log-rank (Mantel–Cox) test P = 0.0273 when comparing Pax5+/− mice treated with ruxolitinib for 28 days versus nontreated Pax5+/− mice and P = 0.0154 when comparing Pax5+/− versus WT mice without treatment. ruxo, ruxolitinib. C, Reduction in pB-ALL incidence in Pax5+/− mice treated with ruxolitinib for 4 weeks. Ruxolitinib treatment of Pax5+/− mice for 4 weeks resulted in pB-ALL development in 3.44% of mice compared with a 23.52% of incidence in untreated animals. Fisher exact test, P = 0.0332. D, Hematoxylin and eosin staining of tumor-bearing Pax5+/− mice showing infiltrating blast cells in the LN, compared with an age-matched WT mouse. Loss of normal architecture due to leukemic cell infiltration can be seen. Magnification and the corresponding scale bar are indicated in each case. E, Flow cytometric analysis of PB showing the accumulation of blast B cells (B220low IgM−) in the leukemic Pax5+/− mouse (W471) and compared with a healthy Pax5+/− mouse (W436), both treated with ruxolitinib (120 mg/kg/day) and exposed to common infections.
Figure 3.
Ruxolitinib treatment prevents infection-driven B-ALL development in Pax5+/− predisposed mice. A, Study design. Pax5+/− (gray; n = 71) and WT (white; n = 42) mice were born under SPF conditions (green). After 1 month of age, the mice were transferred to a conventional facility providing a natural infectious environment (orange). At the time of exposure to infections, a group of Pax5+/− mice (n = 8) was treated with ruxolitinib (0.75 g/kg food) for 14 days (gray circles). Two additional groups of Pax5+/− (n = 29) and WT (n = 19) mice were treated with ruxolitinib (0.75 g/kg food) for 28 days (blue circles) and the remaining Pax5+/− (n = 34) and WT (n = 23) mice were treated with vehicle (red circles). The lifespan of the mice included in the study is indicated by a horizontal blue bar (in months). B, B-ALL–specific survival of mice treated with ruxolitinib for 28 days (Pax5+/−, blue line, n = 29; WT, green line, n = 19), Pax5+/− mice treated with ruxolitinib for 14 days (gray line, n = 8), and nontreated mice (Pax5+/−, red line, n = 34; WT, black line, n = 23) following exposure to common infections. Log-rank (Mantel–Cox) test P = 0.0273 when comparing Pax5+/− mice treated with ruxolitinib for 28 days versus nontreated Pax5+/− mice and P = 0.0154 when comparing Pax5+/− versus WT mice without treatment. ruxo, ruxolitinib. C, Reduction in pB-ALL incidence in Pax5+/− mice treated with ruxolitinib for 4 weeks. Ruxolitinib treatment of Pax5+/− mice for 4 weeks resulted in pB-ALL development in 3.44% of mice compared with a 23.52% of incidence in untreated animals. Fisher exact test, P = 0.0332. D, Hematoxylin and eosin staining of tumor-bearing Pax5+/− mice showing infiltrating blast cells in the LN, compared with an age-matched WT mouse. Loss of normal architecture due to leukemic cell infiltration can be seen. Magnification and the corresponding scale bar are indicated in each case. E, Flow cytometric analysis of PB showing the accumulation of blast B cells (B220low IgM) in the leukemic Pax5+/− mouse (W471) and compared with a healthy Pax5+/− mouse (W436), both treated with ruxolitinib (120 mg/kg/day) and exposed to common infections.
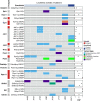
Figure 4. Whole-genome sequencing in leukemic Pax5+/− mice. Oncoprint of somatic single-nucleotide mutations and copy-number alterations across seven leukemia samples from Pax5+/− control mice (light blue) and one leukemia from Pax5+/− ruxolitinib-treated mouse (dark blue). Somatic alterations are clustered by gene. Tumor DNA was derived from whole leukemic BM or LN, while tail DNA of the respective mouse was used as reference germline material. Previously reported known human or mouse leukemia hotspot mutations are highlighted (red). Mean tumor variant allele fraction for each single nucleotide mutation is shown on the dot plot on the right.
Figure 4.
Whole-genome sequencing in leukemic Pax5+/− mice. Oncoprint of somatic single-nucleotide mutations and copy-number alterations across seven leukemia samples from Pax5+/− control mice (light blue) and one leukemia from Pax5+/− ruxolitinib-treated mouse (dark blue). Somatic alterations are clustered by gene. Tumor DNA was derived from whole leukemic BM or LN, while tail DNA of the respective mouse was used as reference germline material. Previously reported known human or mouse leukemia hotspot mutations are highlighted (red). Mean tumor variant allele fraction for each single nucleotide mutation is shown on the dot plot on the right.
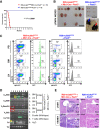
Figure 5. B-ALL development in Rosa26-mJak3V670A+Mb1-Cre+ Pax5+/− mice. A, Overall survival of Rosa26-mJak3V670A+Mb1-Cre+Pax5+/− (red line; n = 10) and Rosa26-mJak3V670A+Pax5+/− mice (blue line; n = 10), none of them exposed to common infections. Log-rank (Mantel–Cox) test, P < 0.0001. B, Photographs of the LNs of 1,7 month-old sibling Rosa26-mJak3V670A+Mb1-Cre+Pax5+/− (red arrow) and Rosa26-mJak3V670A+Pax5+/− mice (blue arrow). Scale bars, 1 cm. C, Flow cytometric analysis of B-cell subsets in diseased Rosa26-mJak3V670A+Mb1-Cre+Pax5+/− mice. Representative plots of B cell from the PB, BM, and LNs are shown. B cells from a control littermate Rosa26-mJak3V670A+Pax5+/− mouse are shown for reference. Tracking of the GFP marker for mJak3V670A transgene expression in the leukemic B cells of Rosa26-mJak3V670A+Mb1-Cre+Pax5+/− mice shows that all tumor cells are GFP+ in 100% (10/10) of the mice studied. Flow cytometric images are representative of 10 mice analyzed. D, BCR clonality in Rosa26-mJak3V670A+Mb1-Cre+Pax5+/− mice. PCR analysis of BCR gene rearrangements in infiltrated BM and LNs of diseased mice. Sorted CD19+ B cells from spleens of healthy mice served as a control for polyclonal BCR rearrangements. DP T cells from the thymus of healthy mice served as a negative control. Leukemic mice show increased clonality within their BCR repertoire (indicated by colored squares). E, An example of hematoxylin and eosin staining of liver and kidney from a tumor-bearing Rosa26-mJak3V670A+Mb1-Cre+Pax5+/− mouse shows infiltrates of relatively uniform lymphoid cells with immature appearance. The same tissues from a control littermate Rosa26-mJak3V670A+Pax5+/− mouse are shown as reference.
Figure 5.
B-ALL development in Rosa26-mJak3V670A+Mb1-Cre+ Pax5+/− mice. A, Overall survival of Rosa26-mJak3V670A+Mb1-Cre+Pax5+/− (red line; n = 10) and Rosa26-mJak3V670A+Pax5+/− mice (blue line; n = 10), none of them exposed to common infections. Log-rank (Mantel–Cox) test, P < 0.0001. B, Photographs of the LNs of 1,7 month-old sibling Rosa26-mJak3V670A+Mb1-Cre+Pax5+/− (red arrow) and Rosa26-mJak3V670A+Pax5+/− mice (blue arrow). Scale bars, 1 cm. C, Flow cytometric analysis of B-cell subsets in diseased Rosa26-mJak3V670A+Mb1-Cre+Pax5+/− mice. Representative plots of B cell from the PB, BM, and LNs are shown. B cells from a control littermate Rosa26-mJak3V670A+Pax5+/− mouse are shown for reference. Tracking of the GFP marker for mJak3V670A transgene expression in the leukemic B cells of Rosa26-mJak3V670A+Mb1-Cre+Pax5+/− mice shows that all tumor cells are GFP+ in 100% (10/10) of the mice studied. Flow cytometric images are representative of 10 mice analyzed. D, BCR clonality in Rosa26-mJak3V670A+Mb1-Cre+Pax5+/− mice. PCR analysis of BCR gene rearrangements in infiltrated BM and LNs of diseased mice. Sorted CD19+ B cells from spleens of healthy mice served as a control for polyclonal BCR rearrangements. DP T cells from the thymus of healthy mice served as a negative control. Leukemic mice show increased clonality within their BCR repertoire (indicated by colored squares). E, An example of hematoxylin and eosin staining of liver and kidney from a tumor-bearing Rosa26-mJak3V670A+Mb1-Cre+Pax5+/− mouse shows infiltrates of relatively uniform lymphoid cells with immature appearance. The same tissues from a control littermate Rosa26-mJak3V670A+Pax5+/− mouse are shown as reference.

References

    1. Hunger SP, Mullighan CG. Acute lymphoblastic leukemia in children. N Engl J Med 2015;373:1541–52. - PubMed
    1. Linabery AM, Ross JA. Trends in childhood cancer incidence in the U.S. (1992–2004). Cancer 2008;112:416–32. - PubMed
    1. Smith MA, Seibel NL, Altekruse SF, Ries LA, Melbert DL, O'Leary M, et al. . Outcomes for children and adolescents with cancer: challenges for the twenty-first century. J Clin Oncol 2010;28:2625–34. - PMC - PubMed
    1. Schafer D, Olsen M, Lahnemann D, Stanulla M, Slany R, Schmiegelow K, et al. . Five percent of healthy newborns have an ETV6-RUNX1 fusion as revealed by DNA-based GIPFEL screening. Blood 2018;131:821–6. - PMC - PubMed
    1. Vicente-Duenas C, Janssen S, Oldenburg M, Auer F, Gonzalez-Herrero I, Casado-Garcia A, et al. . An intact gut microbiome protects genetically predisposed mice against leukemia. Blood 2020;136:2003–17. - PMC - PubMed

Publication types