. 2022 Mar 29;98(13):e1349-e1360.
doi: 10.1212/WNL.0000000000200003. Epub 2022 Feb 7.

Biological and Social Determinants of Hypertension Severity Before vs After Intracerebral Hemorrhage

Affiliations

Biological and Social Determinants of Hypertension Severity Before vs After Intracerebral Hemorrhage

Jessica R Abramson et al. Neurology. .

Abstract

Background and objectives: Although blood pressure (BP) control is considered the most effective measure to prevent functional decline after intracerebral hemorrhage (ICH), fewer than half of survivors achieve treatment goals. We hypothesized that long-term (i.e., prehemorrhage) hypertension severity may be a crucial factor in explaining poor BP control after ICH. We investigated changes in hypertension severity after vs before ICH using latent class analysis (LCA) and identified patient characteristics predictive of individuals' BP trajectories.

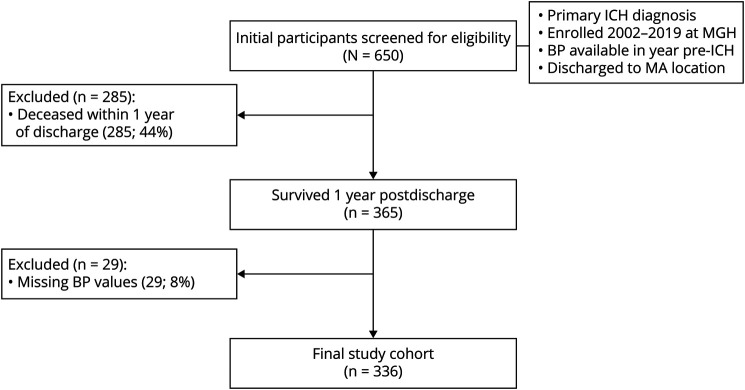
Methods: We analyzed data for ICH survivors enrolled in a study conducted at Massachusetts General Hospital (MGH) from 2002 to 2019 in Boston, a high-resource setting with near-universal medical insurance coverage. We captured BP measurements in the 12 months preceding and following the acute ICH hospitalization. Using LCA, we identified patient groups (classes) based on changes in hypertension severity over time in an unbiased manner. We then created multinomial logistic regression models to identify patient factors associated with these classes.

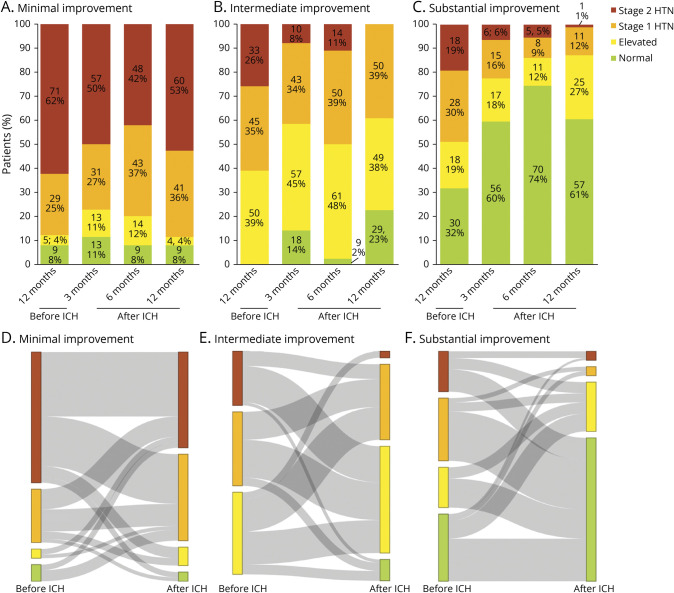
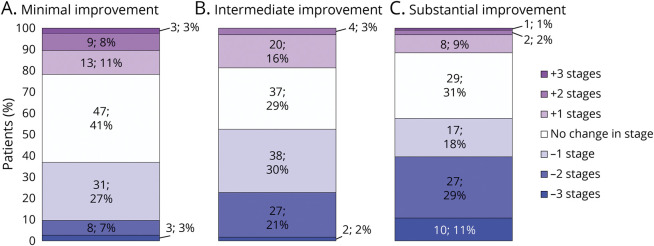
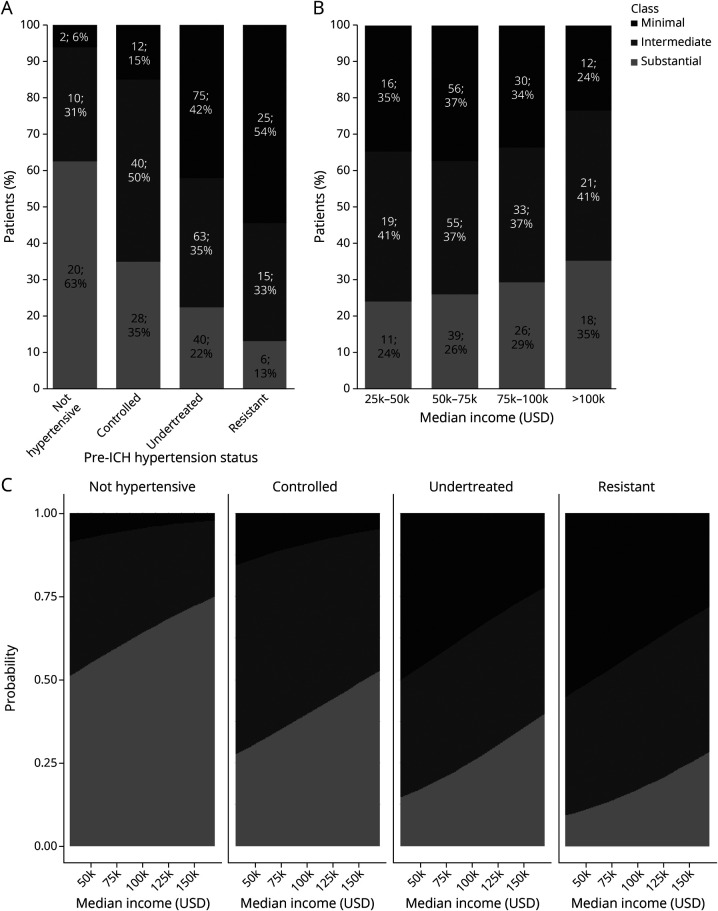
Results: Among 336 participants, the average age was 74.4 years, 166 (49%) were male, and 288 (86%) self-reported White race/ethnicity. LCA identified 3 patient classes, corresponding to minimal (n = 114, 34%), intermediate (n = 128, 38%), and substantial (n = 94, 28%) improvement in hypertension severity after vs before ICH. Survivors with undertreated (relative risk ratio [RRR] 0.05, 95% CI 0.01-0.23) or resistant (RRR 0.03, 95% CI 0.01-0.06) hypertension before ICH were less likely to experience substantial improvement afterwards. Residents of high-income neighborhoods were more likely to experience substantial improvement (RRR 1.14 per $10,000, 95% CI 1.02-1.28). Black, Hispanic, and Asian participants with uncontrolled hypertension before ICH were more likely to experience minimal improvement after hemorrhagic stroke (interaction p < 0.001).

Discussion: Most ICH survivors do not display consistent improvement in hypertension severity after hemorrhagic stroke. BP control after ICH is profoundly influenced by patient characteristics predating the hemorrhage, chiefly prestroke hypertension severity and socioeconomic status. Neighborhood income was associated with hypertension severity after ICH in a high-resource setting with near-universal health care coverage. These findings likely contribute to previously documented racial/ethnic disparities in BP control and clinical outcomes following ICH.


Figures

Figure 1
Figure 1. Study Participants and Inclusion/Exclusion Criteria
BP = blood pressure; ICH = intracerebral hemorrhage; MGH = Massachusetts General Hospital.
Figure 2
Figure 2. Hypertension Severity After vs Before ICH
(A–C) Stacked bar charts representing prevalence of hypertension (HTN) severity stages before intracerebral hemorrhage (ICH) (12 months preceding) and afterwards (3, 6, and 12 months after discharge from stroke hospitalization). Data presented as absolute number of patients in each category and percentage. (D–F) Sankey diagrams of changes in hypertension severity staging before vs after ICH, subdivided by patient classes identified by latent class analysis.
Figure 3
Figure 3. Changes in Hypertension Severity After vs Before ICH
(A–C) Stacked bar charts representing changes in hypertension staging before vs after intracerebral hemorrhage (ICH), subdivided by patient classes identified by latent class analysis. Individuals with positive values experienced worsening of hypertension control (with the number indicating how many stages higher after ICH); individuals with negative values experienced improvement in hypertension control (with the number indicating how many stages lower after ICH). Individuals assigned a value of zero experienced identical hypertension severity before vs after ICH. Data presented as absolute number of patients in each category and percentage.
Figure 4
Figure 4. Hypertension Treatment Status before ICH, Neighborhood Income, and Improvement in Hypertension Severity After vs Before ICH
(A) Stacked bar charts representing prevalence of minimal, intermediate, and substantial improvement in blood pressure (BP) control (as defined by latent class analysis) among study participants, subdivided by hypertension status before intracerebral hemorrhage (ICH). Data presented as absolute number of patients in each category and percentage. (B) Stacked bar charts representing prevalence of minimal, intermediate, and substantial improvement in BP control (as defined by latent class analysis) among study participants, subdivided by median residential income. Data presented as absolute number of patients in each category and percentage. (C) Predicted prevalence of minimal, intermediate, and substantial improvement in BP control (as defined by latent class analysis) as a function of participants’ hypertension status before ICH and median residential income. ICH survivors with prestroke history of undertreated or treatment-resistant hypertension did not experience the same degree of BP control improvement as their counterparts with no hypertension or controlled hypertension diagnoses, even with comparable median residential incomes. Values were computed for graphical illustration purposes from multinomial logistic regression results for a 75-year-old White man, not veteran status, without prior history of dementia or ICH before enrollment, and with an ICH volume of 6 mL (median value in cohort).

References

    1. Biffi A, Bailey D, Anderson CD, et al. . Risk factors associated with early vs delayed dementia after intracerebral hemorrhage. JAMA Neurol 2016;73(8):969-976. - PMC - PubMed
    1. Biffi A, Anderson CD, Battey TW, et al. . Association between blood pressure control and risk of recurrent intracerebral hemorrhage. JAMA. 2015;314(9):904-912. - PMC - PubMed
    1. Casolla B, Moulin S, Kyheng M, et al. . Five-year risk of major ischemic and hemorrhagic events after intracerebral hemorrhage. Stroke. 2019;50:1100-1107. - PubMed
    1. Moulin S, Labreuche J, Bombois S, et al. . Dementia risk after spontaneous intracerebral haemorrhage: a prospective cohort study. Lancet Neurol. 2016;15(8):820-829. - PubMed
    1. Biffi A, Murphy MP, Kubiszewski P, et al. . APOE genotype, hypertension severity and outcomes after intracerebral haemorrhage. Brain Commun. 2019;1:fcz018. - PMC - PubMed

Publication types