

Metabolomic selection for enhanced fruit flavor
- PMID: 35131943
- PMCID: PMC8860002
- DOI: 10.1073/pnas.2115865119
Metabolomic selection for enhanced fruit flavor
Abstract
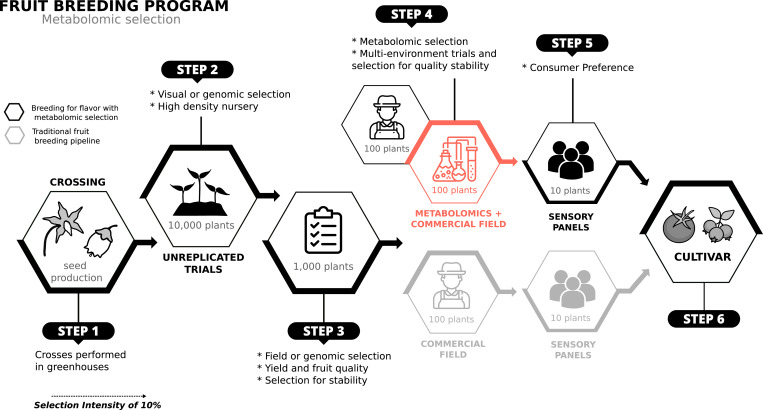
Although they are staple foods in cuisines globally, many commercial fruit varieties have become progressively less flavorful over time. Due to the cost and difficulty associated with flavor phenotyping, breeding programs have long been challenged in selecting for this complex trait. To address this issue, we leveraged targeted metabolomics of diverse tomato and blueberry accessions and their corresponding consumer panel ratings to create statistical and machine learning models that can predict sensory perceptions of fruit flavor. Using these models, a breeding program can assess flavor ratings for a large number of genotypes, previously limited by the low throughput of consumer sensory panels. The ability to predict consumer ratings of liking, sweet, sour, umami, and flavor intensity was evaluated by a 10-fold cross-validation, and the accuracies of 18 different models were assessed. The prediction accuracies were high for most attributes and ranged from 0.87 for sourness intensity in blueberry using XGBoost to 0.46 for overall liking in tomato using linear regression. Further, the best-performing models were used to infer the flavor compounds (sugars, acids, and volatiles) that contribute most to each flavor attribute. We found that the variance decomposition of overall liking score estimates that 42% and 56% of the variance was explained by volatile organic compounds in tomato and blueberry, respectively. We expect that these models will enable an earlier incorporation of flavor as breeding targets and encourage selection and release of more flavorful fruit varieties.
Keywords: artificial intelligence; flavor; fruit quality.
Copyright © 2022 the Author(s). Published by PNAS.
Conflict of interest statement
The authors declare no competing interest.
Figures


Comment in
-
Metabolomic selection-based machine learning improves fruit taste prediction.Proc Natl Acad Sci U S A. 2022 Mar 1;119(9):e2201078119. doi: 10.1073/pnas.2201078119. Proc Natl Acad Sci U S A. 2022. PMID: 35217628 Free PMC article. No abstract available.
References
-
- Fernqvist F., Hunter E., Who’s to blame for tasteless tomatoes? The effect of tomato chilling on consumers’ taste perceptions. Eur. J. Hortic. Sci. 77, 193–198 (2012).
-
- Klee H. J., Tieman D. M., The genetics of fruit flavour preferences. Nat. Rev. Genet. 19, 347–356 (2018). - PubMed
-
- Bartoshuk L. M., Klee H. J., Better fruits and vegetables through sensory analysis. Curr. Biol. 23, R374–R378 (2013). - PubMed
-
- Tieman D., et al. , The chemical interactions underlying tomato flavor preferences. Curr. Biol. 22, 1035–1039 (2012). - PubMed
-
- Tieman D., et al. , A chemical genetic roadmap to improved tomato flavor. Science 355, 391–394 (2017). - PubMed
MeSH terms
Substances
LinkOut - more resources
Full Text Sources
