. 2022 Feb 15;119(7):e2117293119.
doi: 10.1073/pnas.2117293119.

Vertical stratification of the air microbiome in the lower troposphere

Affiliations

Vertical stratification of the air microbiome in the lower troposphere

Daniela I Drautz-Moses et al. Proc Natl Acad Sci U S A. .

Abstract

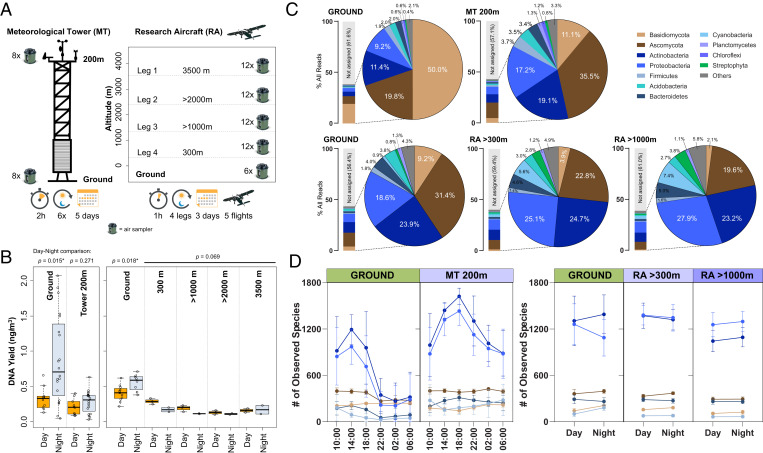
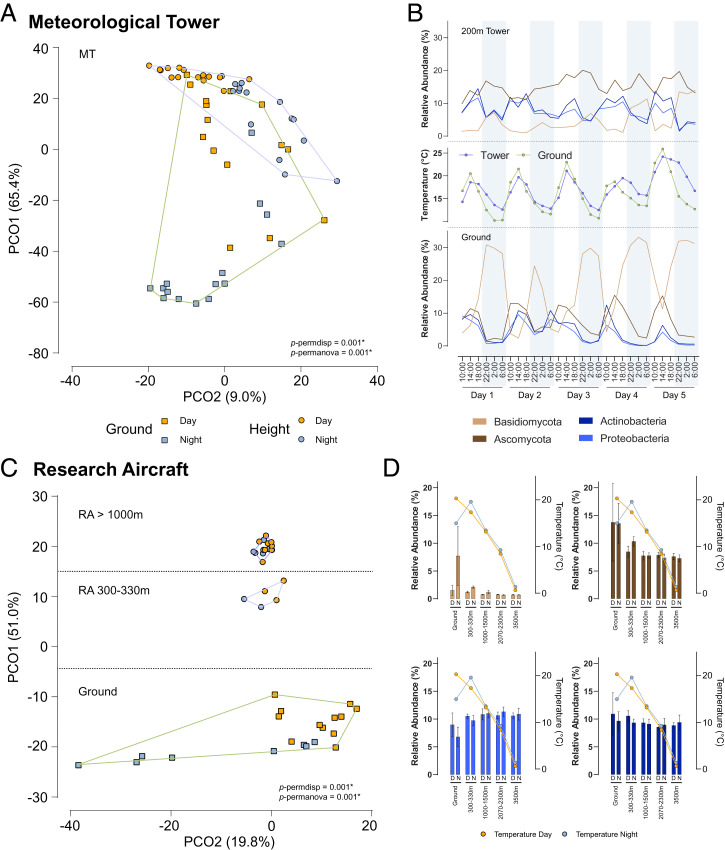
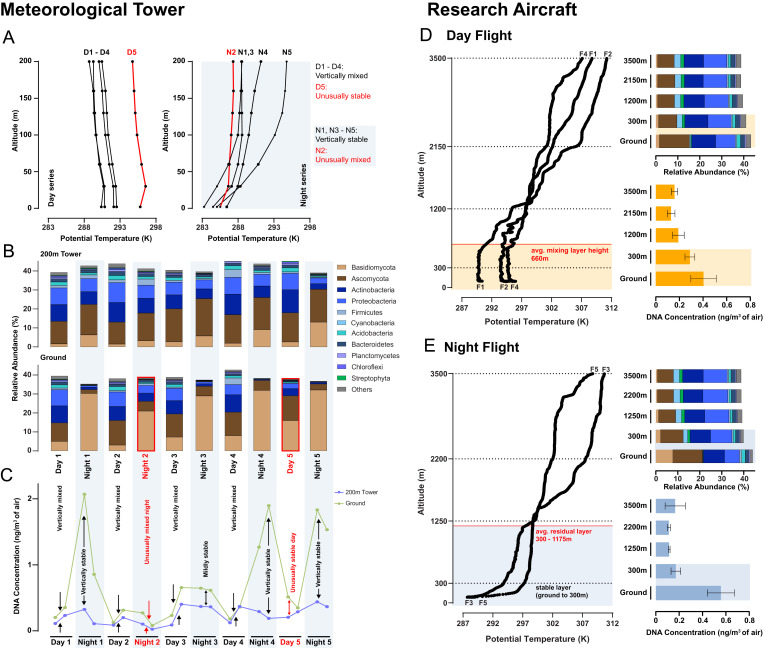
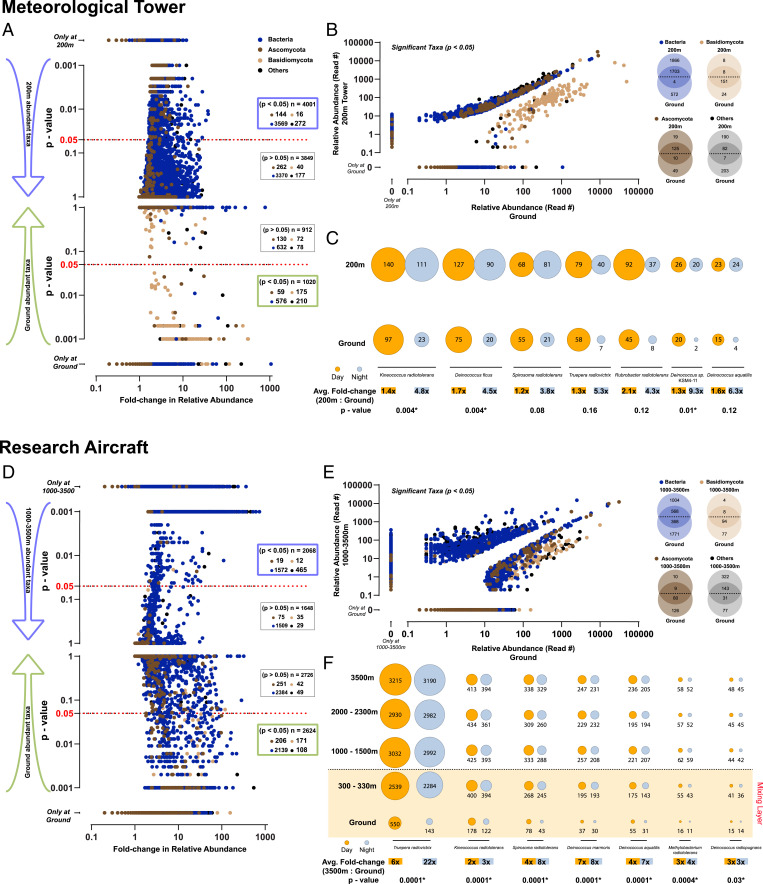
The troposphere constitutes the final frontier of global ecosystem research due to technical challenges arising from its size, low biomass, and gaseous state. Using a vertical testing array comprising a meteorological tower and a research aircraft, we conducted synchronized measurements of meteorological parameters and airborne biomass (n = 480) in the vertical air column up to 3,500 m. The taxonomic analysis of metagenomic data revealed differing patterns of airborne microbial community composition with respect to time of day and height above ground. The temporal and spatial resolution of our study demonstrated that the diel cycle of airborne microorganisms is a ground-based phenomenon that is entirely absent at heights >1,000 m. In an integrated analysis combining meteorological and biological data, we demonstrate that atmospheric turbulence, identified by potential temperature and high-frequency three-component wind measurements, is the key driver of bioaerosol dynamics in the lower troposphere. Multivariate regression analysis shows that at least 50% of identified airborne microbial taxa (n = ∼10,000) are associated with either ground or height, allowing for an understanding of dispersal patterns of microbial taxa in the vertical air column. Due to the interconnectedness of atmospheric turbulence and temperature, the dynamics of microbial dispersal are likely to be impacted by rising global temperatures, thereby also affecting ecosystems on the planetary surface.

Keywords: air microbiome; atmospheric turbulence; bioaerosols; microbial dispersal; microbial ecology.


Conflict of interest statement

The authors declare no competing interest.

Figures

Fig. 1.
Fig. 1.
Vertical testing array and airborne microbial communities at different heights. (A) Air sampling campaigns conducted at the MT (Left) and with a RA (Right). (B) Total airborne DNA concentration per volume of air (ng/m3) at different sampling heights from the MT (Left box) and RA (Right box). The air samples were grouped based on day (orange) or night (gray) sampling. The lines represent the median values, while the error bars denote SD among replicates. (C) Metagenomic composition of air samples at different sampling heights (MT Top, RA Bottom). The bars highlight the portion (% all reads) of DNA assignable at phylum level. Pie charts indicate % of assigned reads for the 10 most abundant phyla. (D) Diversity of airborne taxa at different altitudes and time of day (MT Left, RA Right) for each phylum. The dots are mean values, while the error bars denote SD among replicates.
Fig. 2.
Fig. 2.
Diel cycle of airborne microbial communities at different altitudes. (A) Principal coordinate analysis (Bray–Curtis dissimilarity, species level) between MT air samples collected at different times of day and altitudes. Circles represent 200-m tower-top samples and the squares, ground-level samples. Orange color depicts day samples, while gray color represents night samples. (B) Time series of relative abundances of the top four most abundant phyla from the MT experiment. Nighttime periods are shaded in gray. Temperature (°C) profiles at the two sampling heights (ground, green; 200 m, blue) are shown in the Center. (C) Principal coordinate analysis (Bray–Curtis dissimilarity, species level) between RA air samples collected at different times of day and altitudes. Ground-level air samples are indicated as squares, while air samples collected during flights (300 to 3,500 m) are shown as circles. Daytime samples are colored in orange, and the nighttime samples are colored in gray. (D) Diel fluctuations in relative abundances of the top four most abundant phyla in the RA experiments. The bars denote the mean values, whereas the error bars are SDs. Temperature profiles (°C) at different heights and times of day are overlayed on the bars by the two colored lines (daytime [D], orange; nighttime [N], gray).
Fig. 3.
Fig. 3.
Atmospheric turbulence drives bioaerosol stratification in the vertical air column. (A) PT profiles for the five sampling days in the MT experiment segregated into daytime series (Left) and nighttime series (Right). Samples with mixed period of sunlight were excluded from analysis (6 AM and 6 PM). PT profiles that indicate unusual day or nighttime atmospheric stability are highlighted in red. (B) Averaged relative abundance (%) of airborne microbial communities for the five day and night samples of the MT experiment. Day and night samples with unusual atmospheric stabilities are highlighted in red. (C) Absolute abundance (total DNA concentration) profile of the ground (green) and 200 m tower-top (blue) air samples for the MT experiment. The state of stability (based on the PT profiles) is annotated according to the sampling time. (D) Averaged PT at various altitudes (Left) and airborne microbial community profiles (Top Right: relative abundance; Bottom Right: DNA concentration) of ground and flight air samples that were collected during daytime and (E) nighttime in the RA experiment. The estimated MLH is highlighted in orange for day flights, while the stable and residual layers formed at night are highlighted in gray.
Fig. 4.
Fig. 4.
Association of airborne microorganisms to different altitudes in the lower troposphere. (A and D) Volcano graph plotting the mean fold change in relative abundance of specific species (x axis) and its corresponding P value difference (manyglm method, y axis) (A) between ground and 200-m tower-top air samples in the MT experiment and (D) between ground and 1,000- to 3,500-m air samples in the RA experiment. Each species is color labeled based on their domain/phylum. Species with significantly higher abundance at the 200-m tower top or 1,000- to 3,500-m height are plotted in the Top graph, while species with significantly higher abundance in the ground-level air are shown in the Bottom graph. Species with P value <0.05 are considered to be significantly associated with height. (B and E) Taxa cloud graph plotting the mean relative abundance of the species identified (B) in the MT experiment at ground level (x axis) and in the 200-m tower-top air layer (y axis) and (E) in the RA experiment on the ground level (x axis) and in the 1,000- to 3,500-m air layer (y axis). Only species significantly diverging between ground and high altitude are plotted (P < 0.05, manyglm method). The Venn diagrams denote the number of species that overlap between ground and high-altitude air samples in each group (domain/phylum/others). (C and F) Bubble charts showing the change in relative proportion of the top seven most abundant radio-tolerant bacterial species at different sampling times/altitudes in (C) the MT experiment and (F) the RA experiment. Day abundances are colored orange, while night abundances are in gray. The fold change and the corresponding P value (manyglm method) for the chosen taxa are listed at the Bottom.

References

    1. Venter J. C., et al. , Environmental genome shotgun sequencing of the Sargasso Sea. Science 304, 66–74 (2004). - PubMed
    1. Gilbert J. A., Jansson J. K., Knight R., The Earth Microbiome project: Successes and aspirations. BMC Biol. 12, 69 (2014). - PMC - PubMed
    1. Pasteur L. A., On the doctrine of spontaneous generation. Ann. Sci. Nat. Zool. 16, 5–98 (1861).
    1. Xu Z., et al. , Bioaerosol science, technology, and engineering: Past, present, and future. Aerosol Sci. Technol. 45, 1337–1349 (2011).
    1. Gregory P. H., Spore content of the atmosphere near the ground. Nature 170, 475–477 (1952). - PubMed

LinkOut - more resources