. 2022 Feb 8;8(1):11.
doi: 10.1038/s41421-021-00362-2.

Single-cell RNA sequencing identifies an Il1rn+/Trem1+ macrophage subpopulation as a cellular target for mitigating the progression of thoracic aortic aneurysm and dissection

Affiliations

Single-cell RNA sequencing identifies an Il1rn+/Trem1+ macrophage subpopulation as a cellular target for mitigating the progression of thoracic aortic aneurysm and dissection

Xuanyu Liu et al. Cell Discov. .

Abstract

Thoracic aortic aneurysm and dissection (TAAD) is a life-threatening condition characterized by medial layer degeneration of the thoracic aorta. A thorough understanding of the regulator changes during pathogenesis is essential for medical therapy development. To delineate the cellular and molecular changes during the development of TAAD, we performed single-cell RNA sequencing of thoracic aortic cells from β-aminopropionitrile-induced TAAD mouse models at three time points that spanned from the early to the advanced stages of the disease. Comparative analyses were performed to delineate the temporal dynamics of changes in cellular composition, lineage-specific regulation, and cell-cell communications. Excessive activation of stress-responsive and Toll-like receptor signaling pathways contributed to the smooth muscle cell senescence at the early stage. Three subpopulations of aortic macrophages were identified, i.e., Lyve1+ resident-like, Cd74high antigen-presenting, and Il1rn+/Trem1+ pro-inflammatory macrophages. In both mice and humans, the pro-inflammatory macrophage subpopulation was found to represent the predominant source of most detrimental molecules. Suppression of macrophage accumulation in the aorta with Ki20227 could significantly decrease the incidence of TAAD and aortic rupture in mice. Targeting the Il1rn+/Trem1+ macrophage subpopulation via blockade of Trem1 using mLR12 could significantly decrease the aortic rupture rate in mice. We present the first comprehensive analysis of the cellular and molecular changes during the development of TAAD at single-cell resolution. Our results highlight the importance of anti-inflammation therapy in TAAD, and pinpoint the macrophage subpopulation as the predominant source of detrimental molecules for TAAD. Targeting the IL1RN+/TREM1+ macrophage subpopulation via blockade of TREM1 may represent a promising medical treatment.


Conflict of interest statement

The authors declare no competing interests.

Figures
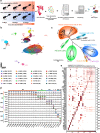
Fig. 1
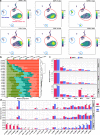
Fig. 1. scRNA-seq reveals cellular heterogeneity in the thoracic aorta during the development of TAAD.
a Schematic representation of the scRNA-seq procedure. The ascending aorta and aortic arch were collected at three time points during the induction, i.e., after 7, 14, and 21 days of BAPN or vehicle (drinking water) administration. Tissues from six mice were pooled for each time point for scRNA-seq. CTRL, control. b Unbiased clustering of 61,826 cells from all six samples reveals 24 cellular clusters. The number in the parenthesis indicates the cell count. c Hierarchical clustering of the clusters based on the average expression of the 2000 most variable genes. d Expression of the established marker genes specific for each lineage in each cluster. e Representative molecular signatures for each cell cluster. The area of the circles indicates the proportion of cells expressing the gene, and the color intensity reflects the expression intensity. EDO, endothelial cell; FB, fibroblast; MAC, macrophage; PCD, pericardial cell; SMC, smooth muscle cell.
Fig. 2
Fig. 2. Differential proportional analysis reveals significantly expanded or contracted cell lineages associated with the progression of TAAD.
a Visualization of cellular density reveals dramatic changes in proportion for smooth muscle cells and macrophages in BAPN vs CTRL. b The proportion of cells from each sample in each cluster. c The relative proportion of each lineage at each stage. Square root transformation was performed on the y-axis. d The relative proportion of each cluster at each time point. In a and b, cells are randomly sampled for equal numbers in each sample (n = 7316). In c and d, a DPA test was performed. *P < 0.05, **P < 0.01; CTRL, control; EDO, endothelial cell; FB, fibroblast; MAC, macrophage; PCD, pericardial cell; SMC, smooth muscle cell.
Fig. 3
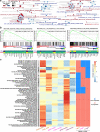
Fig. 3. Dysregulated pathways in SMCs during the development of TAAD.
a Network view of the differentially regulated REACTOME pathways in SMCs at the early stage of TAAD induction. The size of the dot reflects the size of the gene set. The dots in red denote upregulated pathways, and the dots in blue represent downregulated pathways. The significance threshold of the GSEA test was set to an FDR q value of 0.05. b Enrichment plots (upper panel) and leading-edge gene expression heatmaps (lower panel) for representative pathways dysregulated in SMCs at the early stage of TAAD induction. NES, normalized enrichment score. The vertical lines in the enrichment plot show where the members of the gene set appear in the ranked list of genes. The average expression across cells in each group is shown in the heatmap. c The expression dynamics of representative pathways dysregulated during the induction of TAAD. Gene set-based signature scoring was performed using the method implemented in Single-Cell Signature Explorer. The expression activity of a gene set in each sample is represented by the average of the signature scores across cells in the sample.
Fig. 4
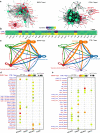
Fig. 4. Gene regulatory network of aortic SMCs and inter-lineage communication analysis of the aortic tissues at the early stage of TAAD.
a Comparative analysis of the gene regulatory networks of SMCs between BAPN (left panel) and CTRL (right panel) reveals dysregulated genes in the early stage of TAAD (7 days after BAPN administration). The node size reflects degree centrality. The top 28 genes ranked by delta degree are colored in red. b The average expression of the top dysregulated genes in SMCs of BAPN and CTRL. c Cell–cell communication networks in the aortic tissues of BAPN (left panel) and CTRL (right panel). The node size reflects the total number of communications for each lineage. The edge color indicates that the ligands are broadcast by the cell lineage in the same color. The line thickness is proportional to the number of broadcast ligands. d The ligand–receptor pairs with significant changes in specificity between any one of the non-SMC lineages and SMCs in BAPN vs CTRL at the early stage of TAAD. SMCs express receptors and receive ligand signals from other lineages. e The representative ligand–receptor pairs with significant changes in specificity between SMCs and the other lineages in BAPN vs CTRL at the early stage of TAAD. SMCs express ligands and broadcast ligand signals for other lineages. In d and e, the dot size reflects the P value of the permutation tests for lineage-specificity, and the dot color denotes the mean of the average ligand–receptor expression in the interacting lineages. CTRL, control; EDO, endothelial cell; FB, fibroblast; MAC, macrophage; SMC, smooth muscle cell; TC, T cell; B cells are not considered due to too few cells.
Fig. 5
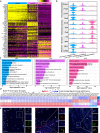
Fig. 5. The heterogeneity of macrophages during the development of TAAD.
a Heatmap showing distinct expression profiles of the three macrophage subpopulations. b The expression of markers for pro-inflammatory chemokines, M1-polarized, M2-polarized, and tissue-resident macrophages in the three subpopulations. c GO terms enriched in the molecular signatures of each subpopulation. Adjusted P value of hypergeometric test <0.05. d Subpopulation-specific regulons of each subpopulation revealed by SCENIC analysis. e smFISH results showing the spatial distribution of the three macrophage subpopulations in mouse aorta. Scale bars, 50 μm. TA, tunica adventitia; TM, tunica media.
Fig. 6
Fig. 6. The pro-inflammatory macrophage subpopulation is a predominant source of most detrimental molecules in the development of TAAD.
a Split violin plot showing the expression of genes encoding MMP family proteins in the mouse aorta of the BAPN and CTRL groups. scRNA-seq data from all three time points were considered. Log2 transformation was performed on the y-axis. CTRL control. b Experimental procedure for bulk RNA-seq of the aorta tissues from TAAD patients (n = 8) and healthy donors (n = 6). c Principal component analysis showing the separation of the TAAD from the healthy group. d The expression of the markers of the three macrophage subpopulations and three MMP genes in aorta tissues from TAAD patients and healthy donors. The statistical threshold of the differential expression test was set to be a q value < 0.05. e Experimental procedure for bulk RNA-seq of CD11b+ aortic cells, CD11b aortic cells, and CD11b+ PBMCs from TAAD patients (n = 4). f The expression of the markers of the three macrophage subpopulations in CD11b+ aortic tissues and corresponding CD11b+ PBMCs. g The expression of the markers of the three macrophage subpopulations and three MMP genes in CD11b+ and CD11b aortic cells from TAAD patients and healthy donors. The statistical threshold of the differential expression test was set to be a q value < 0.05.
Fig. 7
Fig. 7. Pharmacological blockade of Trem1 using mLR12 decreases the aortic rupture rate.
a Trem1 was highly expressed in the macrophage subpopulation. b Schematic illustration of the treatment procedure. Two biological replicates (n = 8 for each replicate) were performed for each group. All measurements were performed after 28 days of treatment. c Survival curves of mice treated with mLR12 or vehicle (saline solution). d Summary of the normal, TAAD, and rupture rates in each group. e mLR12 treatment could significantly decrease the aortic rupture rate. f Quantification of plasma levels of sTREM1. n = 6 for each group. g Quantification of the mRNA expression of Tnfa, Il1b, Il6, Trem1, and Cd11b in the aorta by qPCR (n = 3). h Immunofluorescence staining for Cd11b+Trem1+ cells in mouse aorta of the mLR12 treatment group. i Immunofluorescence staining for Cd11b+Trem1+ cells in mouse aorta of the BAPN + vehicle group. j The percentage of the Cd11b+Trem1+ cells in each sample was calculated based on the immunofluorescence staining. Wilcoxon rank-sum test, P = 0.0004. n = 9 for each group. k Immunofluorescence staining for CD11b+TREM1+ cells in aortic adventitia of human TAAD patients. l Immunofluorescence staining for CD11b+TREM1+ cells in aortic adventitia of healthy donors. m The expression of TREM1 in aortic tissues of human TAAD patients (n = 8) and healthy donors (n = 6) measured by bulk RNA-seq. n The expression of TREM1 in CD11b+ and CD11b cells sorted from the aortic tissues of TAAD patients (n = 4) measured by bulk RNA-seq. In f and g, all values are means ± SEM. *P < 0.05, **P < 0.01, n.s. not significant, Kruskal–Wallis test followed by multiple pairwise comparisons between groups.

Similar articles

Cited by

References

    1. Goldfinger JZ, et al. Thoracic aortic aneurysm and dissection. J. Am. Coll. Cardiol. 2014;64:1725–39. - PubMed
    1. Wu D, Shen YH, Russell L, Coselli JS, Lemaire SA. Molecular mechanisms of thoracic aortic dissection. J. Surg. Res. 2013;184:907–24. - PMC - PubMed
    1. El-Hamamsy I, Yacoub MH. Cellular and molecular mechanisms of thoracic aortic aneurysms. Nat. Rev. Cardiol. 2009;6:771–86. - PubMed
    1. Quintana RA, Taylor WR. Cellular mechanisms of aortic aneurysm formation. Circ. Res. 2019;124:607–18. - PMC - PubMed
    1. Pinard A, Jones GT, Milewicz DM. Genetics of thoracic and abdominal aortic diseases: aneurysms, dissections, and ruptures. Circ. Res. 2019;124:588–606. - PMC - PubMed