. 2022 Feb 7;12(1):1989.
doi: 10.1038/s41598-022-05486-3.

Epigenetic study of early breast cancer (EBC) based on DNA methylation and gene integration analysis

Affiliations

Epigenetic study of early breast cancer (EBC) based on DNA methylation and gene integration analysis

Wenshan Zhang et al. Sci Rep. .

Erratum in

Abstract

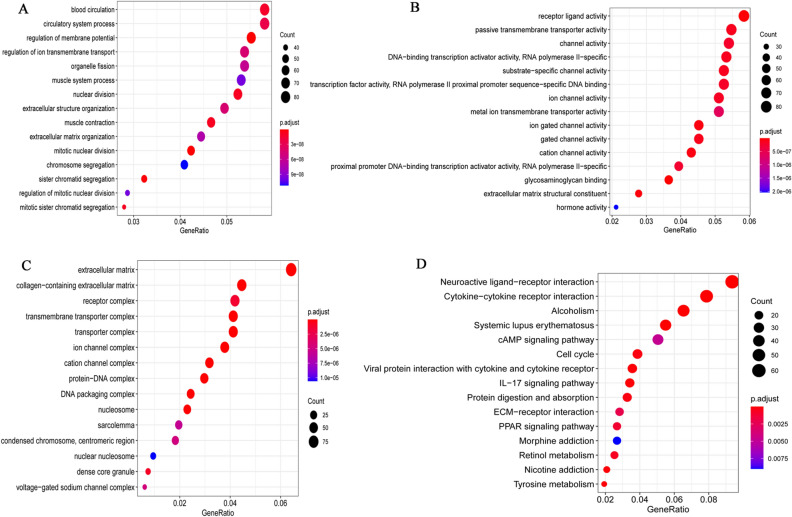
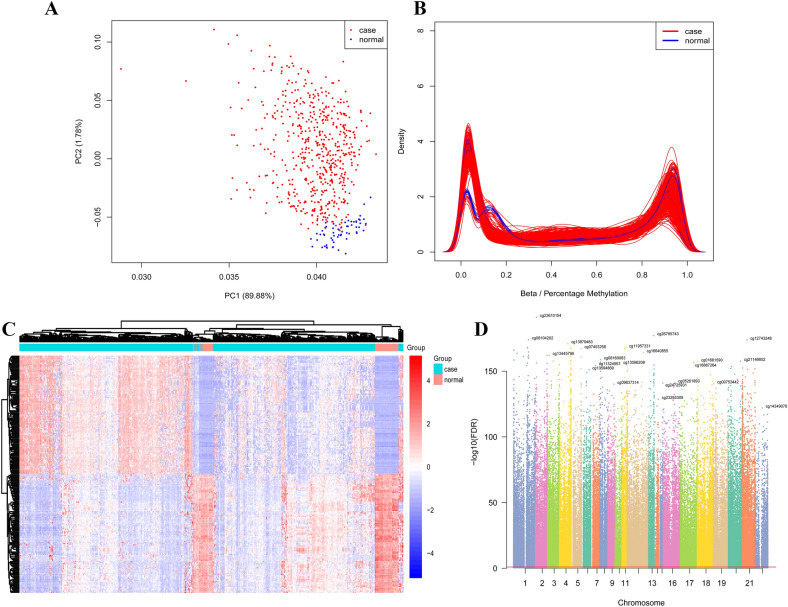
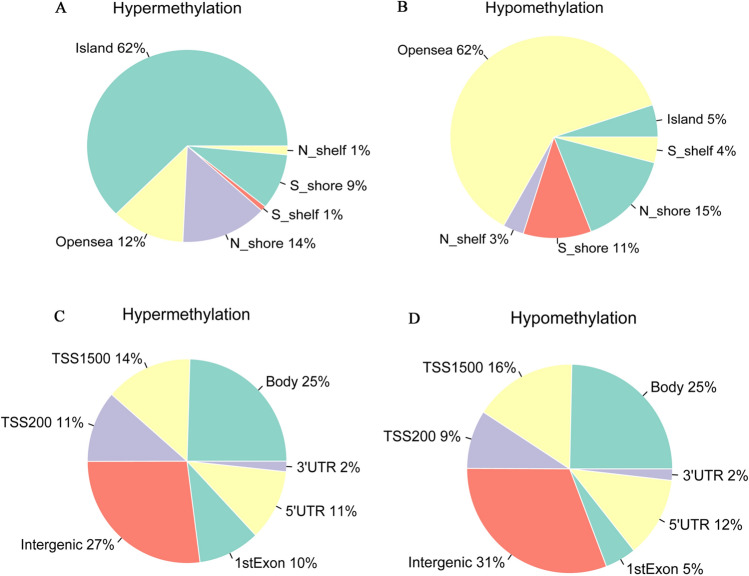
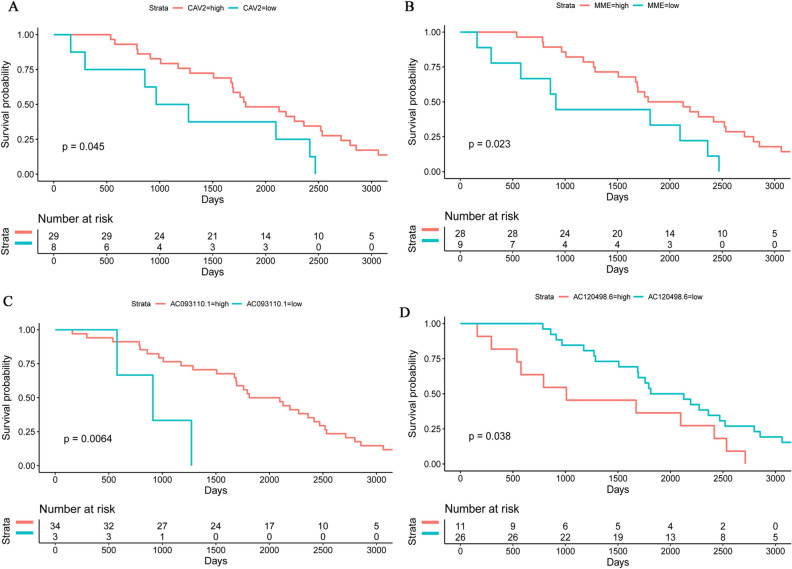
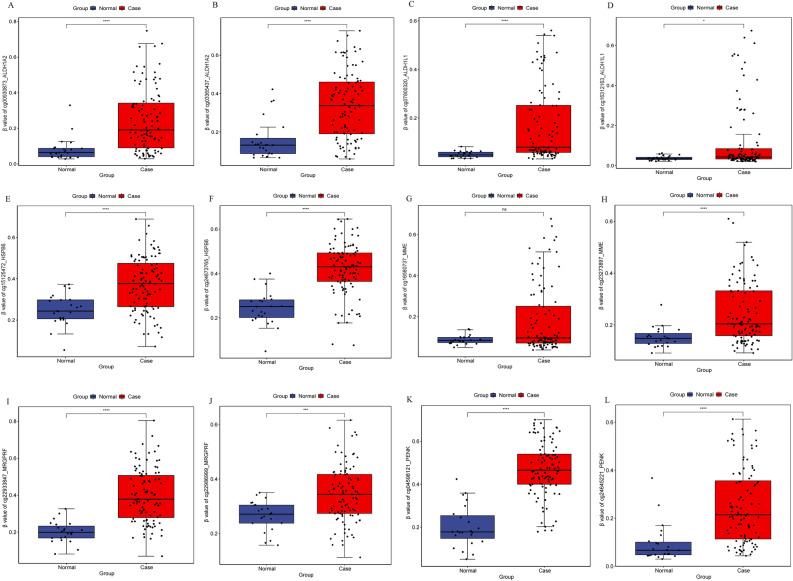
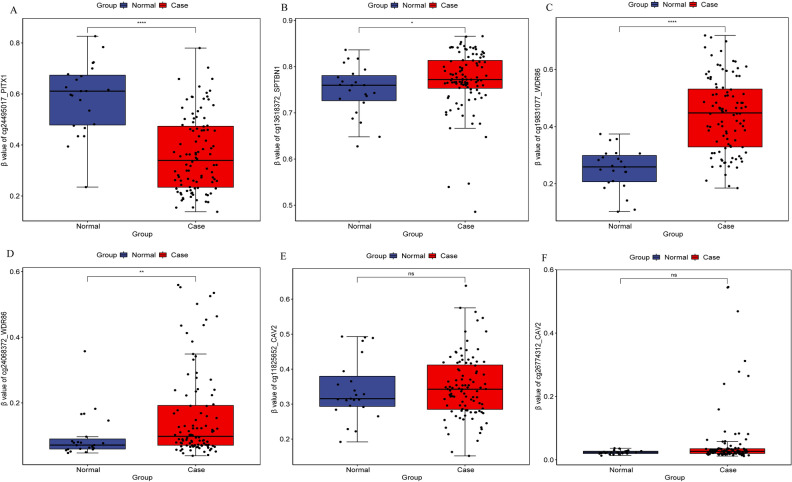
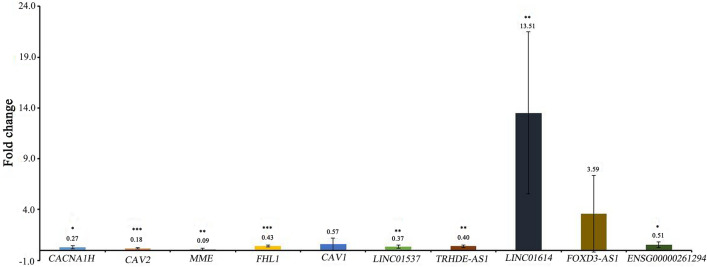
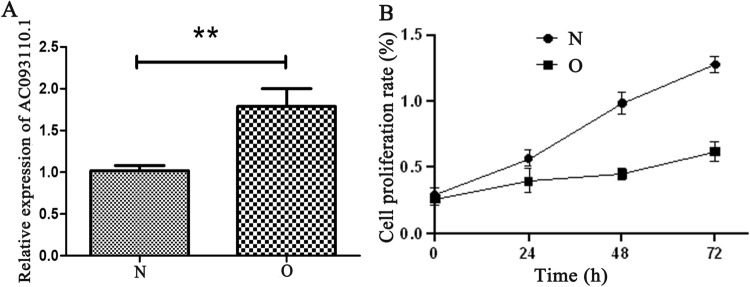
Breast cancer (BC) is one of the leading causes of cancer-related deaths in women. The purpose of this study is to identify key molecular markers related to the diagnosis and prognosis of early breast cancer (EBC). The data of mRNA, lncRNA and DNA methylation were downloaded from The Cancer Genome Atlas (TCGA) dataset for identification of differentially expressed mRNAs (DEmRNAs), differentially expressed lncRNAs (DElncRNAs) and DNA methylation analysis. Gene Ontology (GO) and Kyoto Encyclopedia of Genes and Genomes (KEGG) enrichment analyzes were used to identify the biological functions of DEmRNAs. The correlation analysis between DNA methylation and DEmRNAs was carried out. Then, diagnostic analysis and prognostic analysis of identified DEmRNAs and DElncRNAs were also performed in the TCGA database. Subsequently, methylation state verification for identified DEmRNAs was performed in the GSE32393 dataset. In addition, real-time polymerase chain reaction (RT-PCR) in vitro verification of genes was performed. Finally, AC093110.1 was overexpressed in human BC cell line MCF-7 to verify cell proliferation and migration. In this study, a total of 1633 DEmRNAs, 750 DElncRNAs and 8042 differentially methylated sites were obtained, respectively. In the Venn analysis, 11 keys DEmRNAs (ALDH1L1, SPTBN1, MRGPRF, CAV2, HSPB6, PITX1, WDR86, PENK, CACNA1H, ALDH1A2 and MME) were we found. ALDH1A2, ALDH1L1, HSPB6, MME, MRGPRF, PENK, PITX1, SPTBN1, WDR86 and CAV2 may be considered as potential diagnostic gene biomarkers in EBC. Strikingly, CAV2, MME, AC093110.1 and AC120498.6 were significantly actively correlated with survival. Methylation state of identified DEmRNAs in GSE32393 dataset was consistent with the result in TCGA. AC093110.1 can affect the proliferation and migration of MCF-7. ALDH1A2, ALDH1L1, HSPB6, MME, MRGPRF, PENK, PITX1, SPTBN1, WDR86 and CAV2 may be potential diagnostic gene biomarkers of EBC. Strikingly, CAV2, MME, AC093110.1 and AC120498.6 were significantly actively correlated with survival. The identification of these genes can help in the early diagnosis and treatment of EBC. In addition, AC093110.1 can regulate SPTBN1 expression and play an important role in cell proliferation and migration, which provides clues to clarify the regulatory mechanism of EBC.


Conflict of interest statement

The authors declare no competing interests.

Figures

Figure 1
Figure 1
Top 15 significantly enriched GO terms and KEGG pathways of all DEmRNAs. (A) Biological process (BP); (B) Molecular function (MF); (C) Cell composition (CC); (D) Kyoto Encyclopedia of Genes and Genomes (KEGG) pathways. The x-axis and y-axis represent Gene Ratio and GO terms or KEGG pathways, respectively. The size of the dot represents the number of genes. The color of the dot represents the level of P value.
Figure 2
Figure 2
Analysis of differential methylation sites. (A) PCA of methylation sites; (B) The distribution of the β value of the sample; (C) Heat map of top 200 DMSs. Complete‑linkage method combined with Euclidean distance is used to construct clustering. Each row represents DMSs, and each column represents a sample. DMSs clustering tree is shown on the left. Red indicates above the reference channel (high expression genes). Blue indicates below the reference channel (low expression genes); (D) The Manhattan figure of DMSs in chromosome. The x-axis and y-axis represents the chromosomeand and the -log10 (FDR) of DMSs, respectively.
Figure 3
Figure 3
The distribution of differential methylation sites in CpG_Island and Gene_Group. (A) Distribution of hypermethylation sites on CpG_Island; (B) Distribution of hypomethylation sites on CpG_Island; (C) Distribution of hypermethylation sites on Gene_Group; (D) Distribution of hypomethylation sites on Gene_Group.
Figure 4
Figure 4
Venn diagram for mRNAs of site&cis target, cor-relation and island. Purple represent DEmRNAs co-regulated by DElncRNAs and DNA methylation. Green represent DEmRNAs negatively associated with DMSs. Yellow represent DEmRNAs negatively associated with DMRs. 11 DEmRNAs that interacted with site&cis target were selected.
Figure 5
Figure 5
ROC curve of 11 diagnostic gene biomarkers. ROC curves were used to show the diagnostic ability with 1‑specificity and sensitivity. AUC > 0.9 represent a higher diagnostic value. AUC: area under curve, ROC: receiver operating characteristic.
Figure 6
Figure 6
Prognostic analysis of CAV2, MME, AC093110.1 and AC120498.6 in TCGA database. The x-axis and y-axis represent time and survival probability, respectively. P < 0.05 was considered statistically significant.
Figure 7
Figure 7
Methylation modification state verification of ALDH1A2, ALDH1L1, HSPB6, MME, MRGPRF and PENK in the GSE32393 dataset. * represents P < 0.05, ** represents P < 0.01, *** represents P < 0.001, P < 0.05 was considered statistically significant.
Figure 8
Figure 8
Methylation modification state verification of PITX1, SPTBN1, WDR86 and CAV2 in the GSE32393 dataset. * represents P < 0.05, ** represents P < 0.01, *** represents P < 0.001, P < 0.05 was considered statistically significant.
Figure 9
Figure 9
RT-PCR validation of CACNA1H, CAV2, MME, FHL1, CAV1, LINC01537, TRHDE-AS1, LINC01614, FOXD3-AS1 and ENSG00000261294 in tissues samples. * represents P < 0.05, ** represents P < 0.01, *** represents P < 0.001, Fold change > 1 represent regulation, Fold change < 1 represent regulation.
Figure 10
Figure 10
Expression and proliferation of MCF-7 cells after AC093110.1 overexpression. (A) Verification of relative expression of AC093110.1 after overexpression; (B) MTT detect the proliferation ability of MCF-7 cells after overexpression of AC093110.1. N and O represent normal cells and overexpressing AC093110.1 cells, respectively.
Figure 11
Figure 11
Migration of MCF-7 cells after AC093110.1 overexpression. (A) Cells migration capacity in normal MCF-7 at 0 h; (B) Cells migration capacity in normal MCF-7 cells at 24 h; (C) Cells migration capacity in normal MCF-7 cells at 48 h; (D) Cells migration capacity in AC093110.1 overexpressed cells at 0 h; (E) Cells migration capacity in AC093110.1 overexpressed cells at 24 h; (F) Cells migration capacity in AC093110.1 overexpressed cells at 48 h; (G) Scratch width of normal cells and overexpressed cells at different times. (H) Scratch healing rate of normal cells and overexpressed cells at different times. N and O represent normal cells and overexpressing AC093110.1 cells, respectively.
Figure 12
Figure 12
Western blotting assay (A) and quantitative analysis (B) of SPTBN1 after AC093110.1 overexpression in MCF-7 cells. N and O represent normal cells and overexpressing AC093110.1 cells, respectively. Usually the blots were cut prior to hybridisation with antibodies.

References

    1. Harbeck, N. & Gnant, M. Breast cancer. Lancet (Lond. Engl.)389, 1134–1150, doi:10.1016/s0140-6736(16)31891-8 (2017). - PubMed
    1. Fahad Ullah M. Breast cancer: current perspectives on the disease status. Adv. Exp. Med. Biol. 2019;1152:51–64. doi: 10.1007/978-3-030-20301-6_4. - DOI - PubMed
    1. Anastasiadi Z, Lianos GD, Ignatiadou E, Harissis HV, Mitsis M. Breast cancer in young women: an overview. Updates Surg. 2017;69:313–317. doi: 10.1007/s13304-017-0424-1. - DOI - PubMed
    1. Maughan KL, Lutterbie MA, Ham PS. Treatment of breast cancer. Am. Family Phys. 2010;81:1339–1346. - PubMed
    1. Romagnolo AP, Romagnolo DF, Selmin OI. BRCA1 as target for breast cancer prevention and therapy. Anti-cancer Agents Med. Chem. 2015;15:4–14. doi: 10.2174/1871520614666141020153543. - DOI - PubMed