. 2022 Feb 7;13(1):711.
doi: 10.1038/s41467-022-28347-z.

Enhanced germline stem cell longevity in Drosophila diapause

Affiliations

Enhanced germline stem cell longevity in Drosophila diapause

Sreesankar Easwaran et al. Nat Commun. .

Abstract

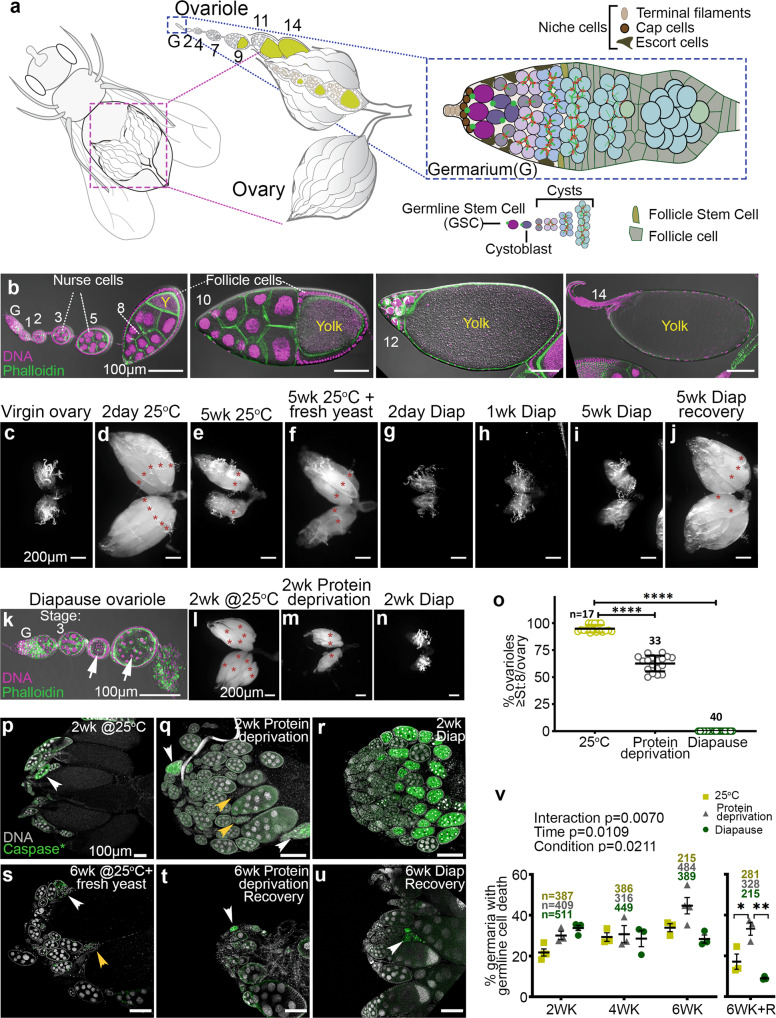
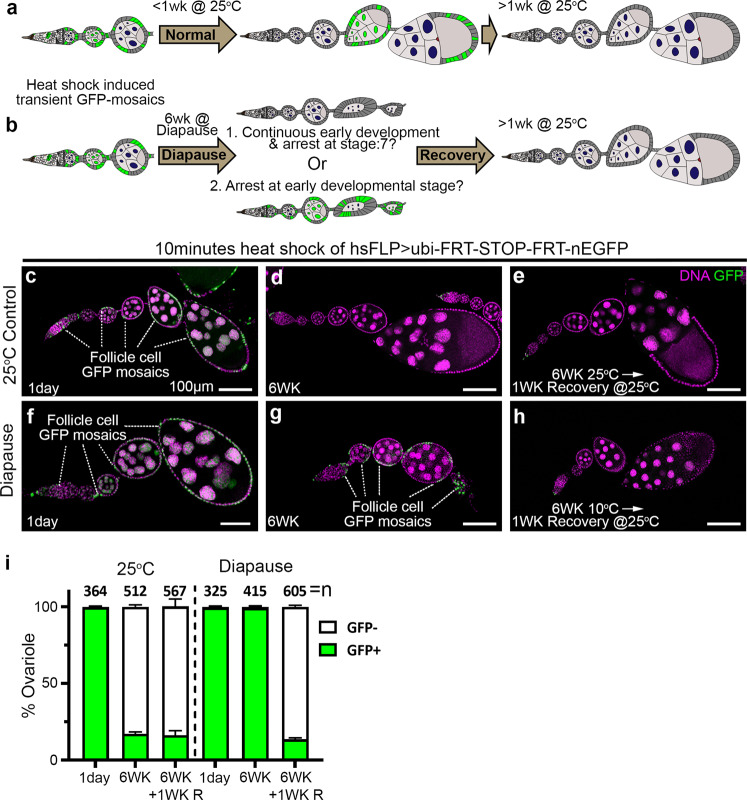
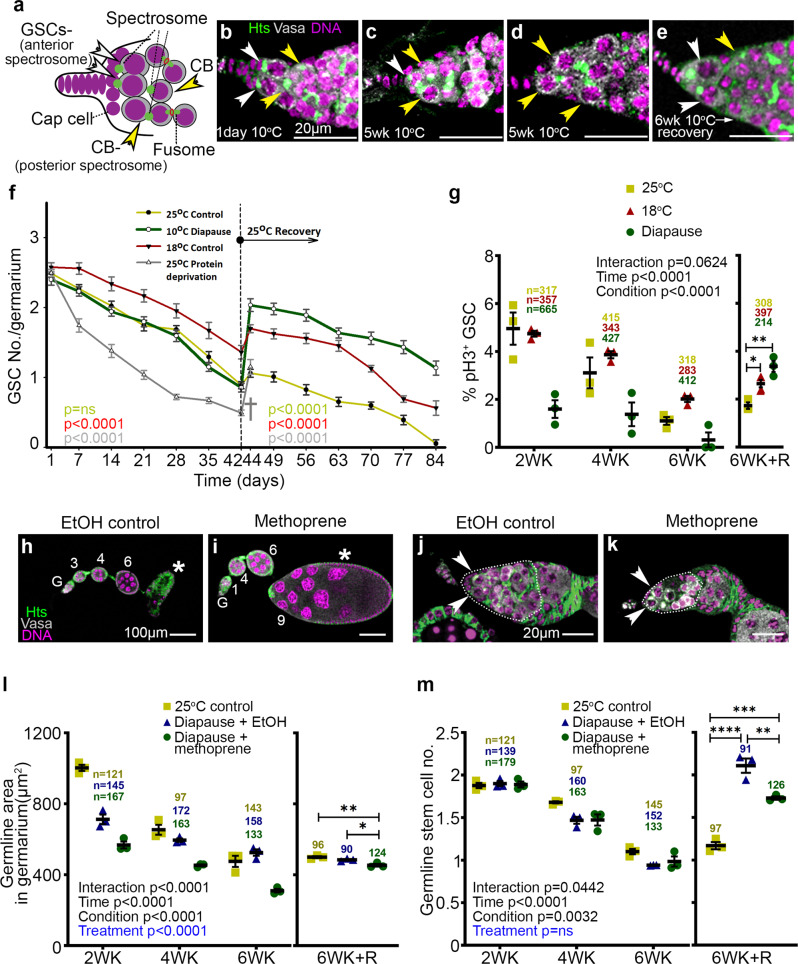
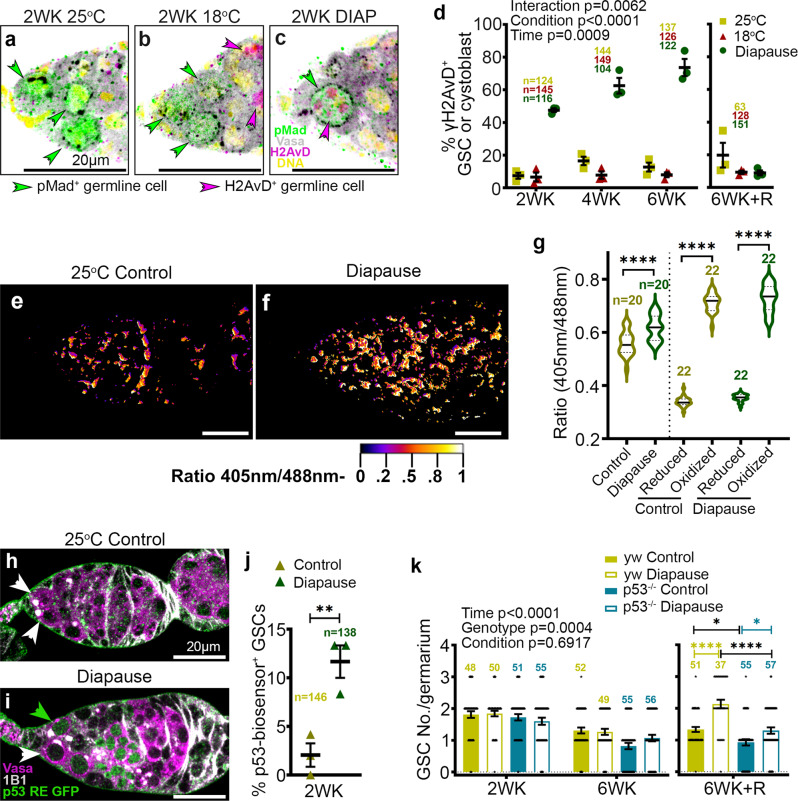
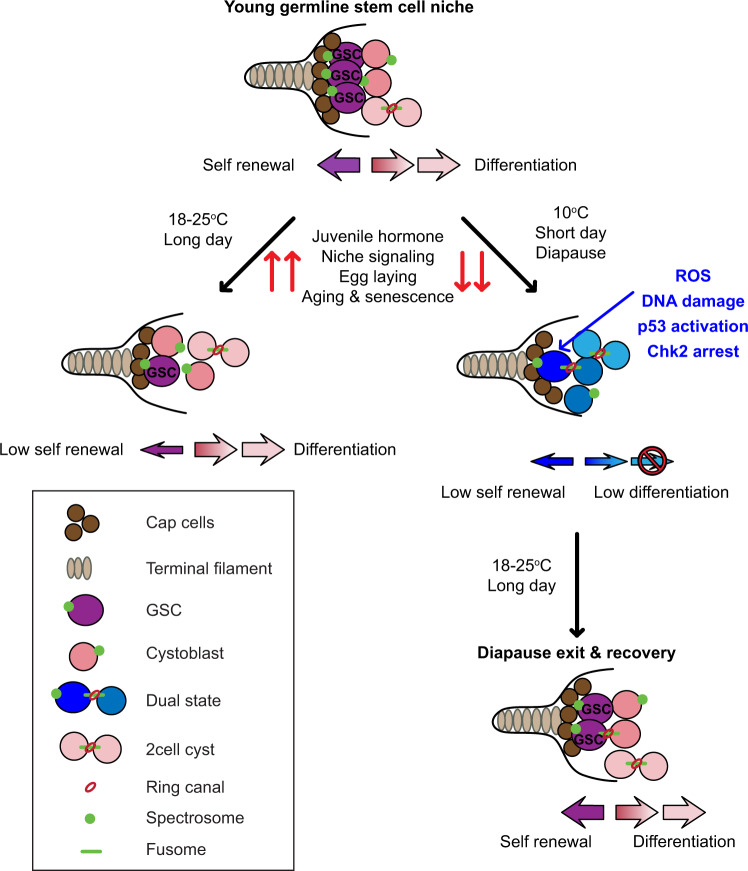
In many species including humans, aging reduces female fertility. Intriguingly, some animals preserve fertility longer under specific environmental conditions. For example, at low temperature and short day-length, Drosophila melanogaster enters a state called adult reproductive diapause. As in other stressful conditions, ovarian development arrests at the yolk uptake checkpoint; however, mechanisms underlying fertility preservation and post-diapause recovery are largely unknown. Here, we report that diapause causes more complete arrest than other stresses yet preserves greater recovery potential. During dormancy, germline stem cells (GSCs) incur DNA damage, activate p53 and Chk2, and divide less. Despite reduced niche signaling, germline precursor cells do not differentiate. GSCs adopt an atypical, suspended state connected to their daughters. Post-diapause recovery of niche signaling and resumption of division contribute to restoring GSCs. Mimicking one feature of quiescence, reduced juvenile hormone production, enhanced GSC longevity in non-diapausing flies. Thus, diapause mechanisms provide approaches to GSC longevity enhancement.


Conflict of interest statement

The authors declare no competing interests.

Figures

Fig. 1
Fig. 1. Distinct ovarian arrest and recovery responses to diapause and other stresses.
a Schematic drawings of ovarian anatomy at increasing magnifications (left to right). Yellow indicates yolk. b Confocal images showing stages of normal egg chamber development. Scale bars 100 µm. cj Darkfield micrographs of whole ovaries for the indicated conditions showing normal development, aging, diapause, and recovery. Asterisks denote mature eggs. Scale bars 200 µm. k Degenerating early stage egg chambers (white arrows) during diapause. Scale bar 100 µm. ln Darkfield micrographs of whole ovaries from flies grown under the indicated conditions. Asterisks label mature eggs. Scale bars 200 µm. o Percentage of ovarioles with egg chambers that developed beyond the yolk deposition checkpoint. n is the number of ovaries analyzed and data are mean ± s.d.; ****p < 0.0001 (1-way ANOVA and Tukey’s multiple comparison test). pu Micrographs of anti-active caspase staining (green) of whole ovaries from the indicated conditions. Examples of caspase-positive, degenerating egg chambers (white arrowheads) or caspase-negative, fully degenerated egg chambers (yellow arrowheads). Scale bars 100 µm. v Comparison of the germline cell death in the germaria from flies during normal development and aging, subjected to protein deprivation, or in diapause and recovery (R). Data are means from at least three independent experiments ± s.e.m. Numbers (n) of germaria counted. Statistical analysis using 2-way ANOVA was carried out before the recovery time period. After recovery, Tukey’s multiple comparisons test and 1-way ANOVA test was conducted (*p = 0.0162; **p = 0.0022).
Fig. 2
Fig. 2. Diapause arrest at multiple stages.
a, b Schematic representation of the experimental design. Transient, GFP + clones are generated by heat shock (see methods for details). a As egg chambers develop, those containing GFP + cells mature into eggs that are laid, and are replaced by unlabeled egg chambers. b In diapause, if egg chambers are continually produced and degenerating (option 1, top), GFP labeling would be lost, but if egg chamber development stops (option 2, bottom), degenerating GFP-labeled egg chambers would persist. In either case, upon transfer to recovery conditions, development should resume and GFP labeling should disappear. ce Controls showing the presence of transient GFP clones 1 day after heat shock (c) and loss thereafter (d, e). fh In diapause, GFP-labeled egg chambers persist for six weeks and are lost after a week of recovery. Scale bars 100 µm. i Quantification of the percentage of ovarioles containing any egg chamber younger than stage 14 with GFP + cells, comparing normal aging to diapause and recovery. The data shown are from three independent experiments. Error bars = mean ± s.e.m. n is the total number of ovarioles analyzed. See also Supplementary Fig. 2.
Fig. 3
Fig. 3. Germline stem cells in diapause arrest and recovery.
a Schematic of a germarium tip showing GSCs (white arrowheads) in contact with niche cap cells and containing an anterior (left) spectrosome and a cystoblast (yellow arrowhead) with a posterior spectrosome and/or separated from the niche. be Confocal micrographs of representative germaria from diapause and recovery are stained with Vasa (white), Hts (green), and Hoechst (magenta). Nondiapause germaria are shown in Supplementary Fig. 3a–d. Scale bars 20 µm. f Quantification of GSC numbers over six weeks in the indicated conditions (control, diapause, protein deprivation) followed by 6 weeks at 25 °C. GSC numbers declined during diapause (green line) and rebounded during recovery. Protein deprivation led to premature death (†) so GSC data were not available after 44 days. Data = mean ± s.e.m. and refer to Supplementary Fig. 3e which has the n, number of germaria analyzed. p value for the condition was calculated using 2-way ANOVA (carried out separately for before and after the recovery time period) individually for each condition. g Percentage of GSCs in mitosis, assessed using anti-pH3 staining, over six weeks (WK) in the indicated conditions, followed by recovery (R). (n) number of GSCs analyzed. *p = 0.0179; **p = 0.0011. h, i Representative images of ovarioles without (EtOH control) or with methoprene treatment. G, germarium. Numerals indicate egg chamber stages. The stage 7/8 diapause arrest (asterisk in (h)) was released by methoprene treatment allowing the development of vitellogenic egg chambers (asterisk in (i)). j, k Arrowheads indicate GSCs. Dotted lines outline germarium regions 1 and 2, which are quantified in (l) (*p = 0.0265; **p = 0.0040). See also Supplementary Fig. 3. m Quantification of GSC numbers over time. **p = 0.0069; ***p = 0.0010; ****p < 0.0001. (n) number of germaria analyzed in (l, m). For g, l, m, data = mean ± s.e.m. Statistical analysis is by 2-way ANOVA before recovery and 1-way ANOVA with Tukey’s multiple comparisons test after recovery.
Fig. 4
Fig. 4. DNA damage, ROS, and p53 mediated protective response in diapause.
ac Confocal micrographs of germaria from flies maintained for 2 weeks (WK) at 25 °C (a), 18°C (b), or diapause conditions (c). Anti-pMad (green) labels cells with active Dpp signaling from the niche. Anti-γH2AvD (magenta) labels cells with double-strand DNA breaks due to damage [magenta arrowheads in (c)] or meiosis (arrowheads in (b)). d Percentage of H2AvD+ cells out of total pMad+ cells from 25 °C, 18 °C, and diapause over time. R, recovery. Statistical analysis is by 2-way ANOVA before recovery and 1-way ANOVA with Tukey’s multiple comparisons test after recovery. e, f Ratiometric (405 nm/488 nm) confocal micrographs of germaria from tubulin-mito-roGFP2-Orp1 flies kept for 2 weeks at 25 °C [control (e)] and in diapause (f). g Quantification of ROS in the germarium relative to maximally reduced (with dithiothreitol) or oxidized (with diamide, see methods for details). Statistical analysis is by 1-way ANOVA and Tukey’s multiple comparisons test. ****p < 0.0001. hi Confocal micrographs of germaria from flies maintained for 2 weeks (WK) at 25 °C (h), or diapause conditions (i). Anti-Vasa labels germline cells (magenta) and 1B1 stains the Hts protein indicating spectrosome/fusome (GSCs are shown by arrowheads). p53 RE GFP-NLS biosensor (green) labels cells with p53 activity (green arrowhead in (i)). j Percentage of p53 RE GFP+ GSCs out of total GSCs from 25 °C control and diapause for 2WK. p value from unpaired two-tailed t-test. **p = 0.0095. k Quantification of GSC number/germarium from y, w control flies and p53−/− in 25 °C control and diapause from 2WK, 6WK, and 6WK recovery (6WK + R). Statistical analysis is by three-way ANOVA before the recovery and one-way ANOVA after recovery. n is the number of GSCs analyzed in (j), in all other cases, n = number of germaria analyzed. Data are mean ± s.e.m. *p = 0.0211; *p = 0.0346; ****p < 0.0001. Scale bars are 20 µm.
Fig. 5
Fig. 5. Chk2 DNA damage checkpoint maintains GSC diapause arrest.
a Schematic of a germarium showing regions 1–3 and spectrosome/fusome morphology (GSC germline stem cell, CB cystoblast, CC cyst cell). Dotted line shows region 2/3 border. bd Quantification of germline area in regions 1 and 2 (b), fusome number (c), and GSC number (d) in germaria from control and lokKD/lokP30. The control for bd is Canton S. eg Quantification of germline area in regions 1 and 2 (e), fusome number (f), and GSC number (g) in the germarium from lokKD/lokP30 treated with either ethanol vehicle (EtOH) or methoprene. Throughout Fig. 5, n = number of germaria analyzed. Data are mean ± s.e.m. from at least three independent experiments. Statistical analysis was carried out by unpaired two-tailed t test (*p = 0.0101; ***p = 0.0003; ****p < 0.0001). See also Supplementary Fig. 5.
Fig. 6
Fig. 6. GSC niche signaling in diapause and recovery.
ai Confocal micrographs of germaria stained for pMad (magenta), Vasa (green), and Hoechst (gray) from flies maintained at 25 °C, 18 °C or in diapause. pMad+ cells are marked by magenta arrowheads. j Quantification of pMad+ germline cells over time from flies maintained at 25 °C, 18 °C, or in diapause. k Quantification of Dpp signaling in the cap cells relative to that in the germline region. ls Confocal micrographs of germaria stained for Dpp (green) to identify the BMP signaling from the cap cells, along with Vasa (gray), and Hoechst (magenta) from flies maintained at 25 °C (lo) or in diapause conditions (ps) for 2, 4, 6, or 6 weeks (WK) followed by recovery. Cap cells are marked in dotted lines. (l’s’) Dpp channel alone is in gray and Dpp enrichment in the cap cell region is shown with arrows. n = number of germaria analyzed. Data are mean ± s.e.m. from at least three independent experiments. Statistical analysis was carried out by two-way ANOVA before recovery time periods in (j, k). After recovery, ordinary 1-way ANOVA with Tukey’s multiple comparisons test for (j) and unpaired two-tailed t-test for (k) were undertaken (*p = 0.0119; **p = 0.0024; ***p = 0.0002). Scale bars are 20 µm. See also Supplementary Fig. 6.
Fig. 7
Fig. 7. Incomplete cell division of GSCs in diapause.
af Confocal micrographs of germaria from nosGAL4>UASp-PA(Photoactivatable)GFP-alphaTub84B flies kept at either 25 °C (a, b and e, f) or diapause (c, d) for the indicated time. Arrows indicate the anteriormost germline cell in each germarium and the circle shows the illuminated area. Images captured before (a, c, e) and after (b, d, f) photoactivation along with respective grayscale images are displayed (a’f’). g Quantification of GFP confined to a single cell (1 cell) or to multiple cells (>1 cell). n, the numbers of photoactivation experiments carried out are shown above the bar. See also Supplementary Fig. 7.
Fig. 8
Fig. 8. JH inhibition leads to a diapause-like arrest and GSC preservation in non-diapause conditions.
a Confocal micrograph of ovarioles from a fly with Aug21Gal4 driving UAS-NiPp1 to inhibit JH production in the corpora allata. Egg chambers develop normally through stage 6, without early stage degeneration, then arrest at stage 7/8 (a), an arrest released by methoprene treatment (b). Scale bars are 100 μm (a, b). cj Confocal micrographs of germaria from control (Aug21Gal4>UAS-lacZ, cf) or JH downregulation (Aug21Gal4>UAS-NiPp1, gj) stained for Hts (magenta), Vasa (gray), pMAD (green), and Hoechst (yellow) from flies maintained at 25 °C for 2 weeks (WK) (c, g), 6WK (d, h), or 6WK at 25 °C followed by supplementation with either EtOH (e, i) or methoprene (f, j). Arrowheads indicate GSCs and scale bars are 20 µm. k Quantification of GSC number over time from controls (Aug21Gal4>UAS-lacZ) and JH downregulation (Aug21Gal4>UAS-NiPp1) followed by methoprene treatment to mimic JH production in post-diapause recovery. l Quantification of pMAD+ cells over time in germaria from control flies and those with JH downregulation, followed by methoprene treatment. n = number of germaria analyzed. Data are mean ± s.e.m. from at least three independent experiments. Statistical analysis by two-way ANOVA was carried out separately before the treatment time periods and after the treatment. See also Supplementary Fig. 8.
Fig. 9
Fig. 9. Model for ovarian diapause arrest and recovery.
During diapause, the GSCs enter a state of inactivity mediated by Dpp downregulation, increased incidence of ROS, DNA damage, and Chk2 activation. The low level of differentiation maintains a pool of germline cells within the germarium, which replenishes GSCs upon diapause exit. Post-diapause, Dpp signaling from cap cells is restored and re-activates GSCs to reverse the developmental arrest.

Similar articles

Cited by

References

    1. Baugh LR. To grow or not to grow: nutritional control of development during Caenorhabditis elegans L1 arrest. Genetics. 2013;194:539–555. - PMC - PubMed
    1. Tissenbaum HA. Using C. elegans for aging research. Invertebr. Reprod. Dev. 2015;59:59–63. - PMC - PubMed
    1. Reynolds JA. Noncoding RNA regulation of dormant states in evolutionarily diverse animals. Biol. Bull. 2019;237:192–209. - PubMed
    1. Tougeron K. Diapause research in insects: historical review and recent work perspectives. Entomol. Exp. Appl. 2019;167:27–36.
    1. Hu C-K, et al. Vertebrate diapause preserves organisms long term through Polycomb complex members. Science. 2020;367:870–874. - PMC - PubMed

Publication types