. 2022 Feb;24(2):217-229.
doi: 10.1038/s41556-021-00827-2. Epub 2022 Feb 7.

Membrane-associated cytoplasmic granules carrying the Argonaute protein WAGO-3 enable paternal epigenetic inheritance in Caenorhabditis elegans

Affiliations

Membrane-associated cytoplasmic granules carrying the Argonaute protein WAGO-3 enable paternal epigenetic inheritance in Caenorhabditis elegans

Jan Schreier et al. Nat Cell Biol. 2022 Feb.

Abstract

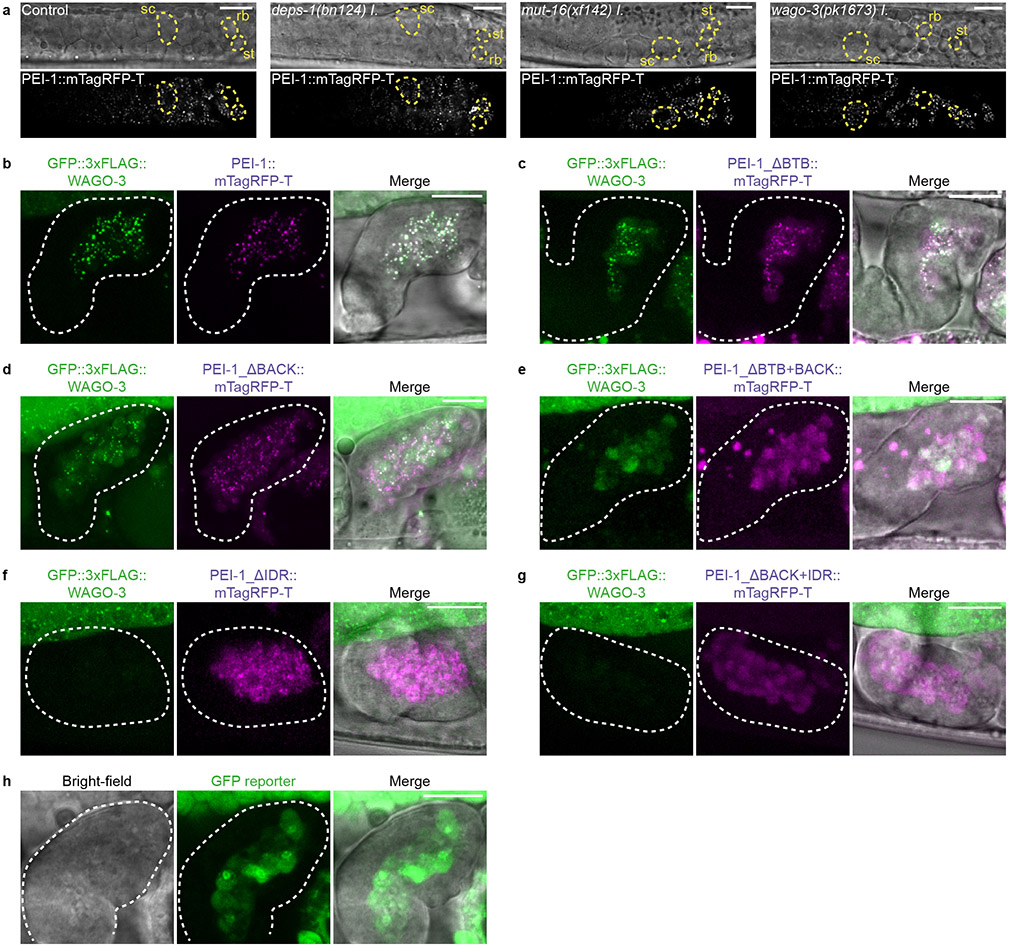
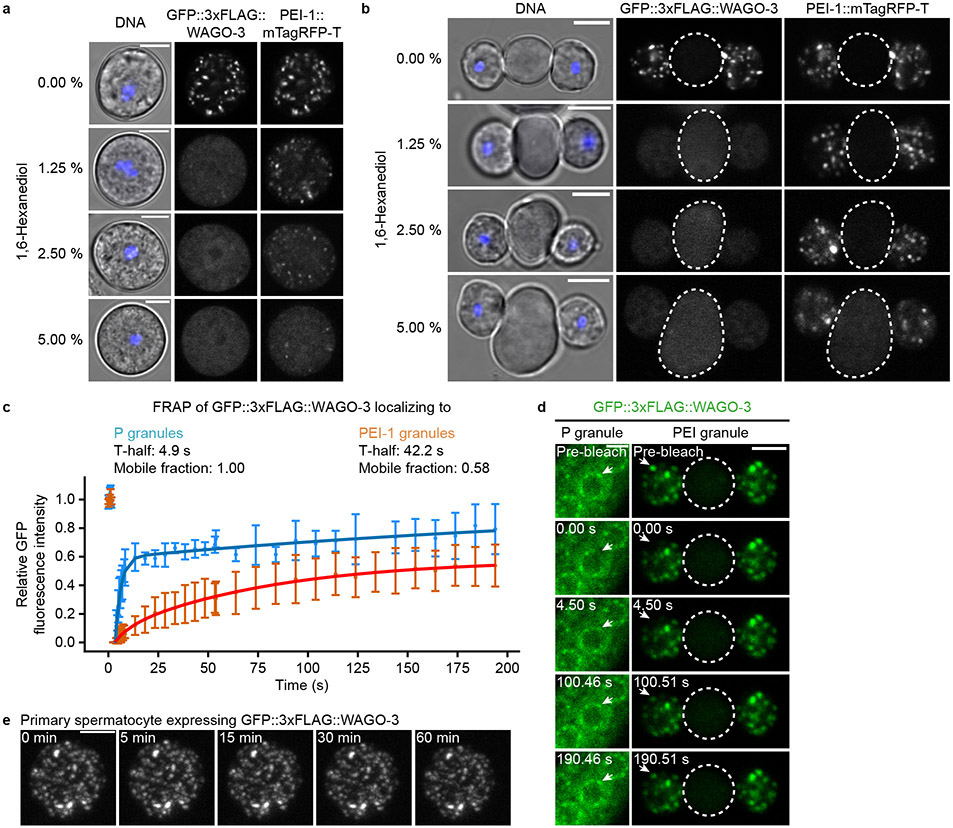
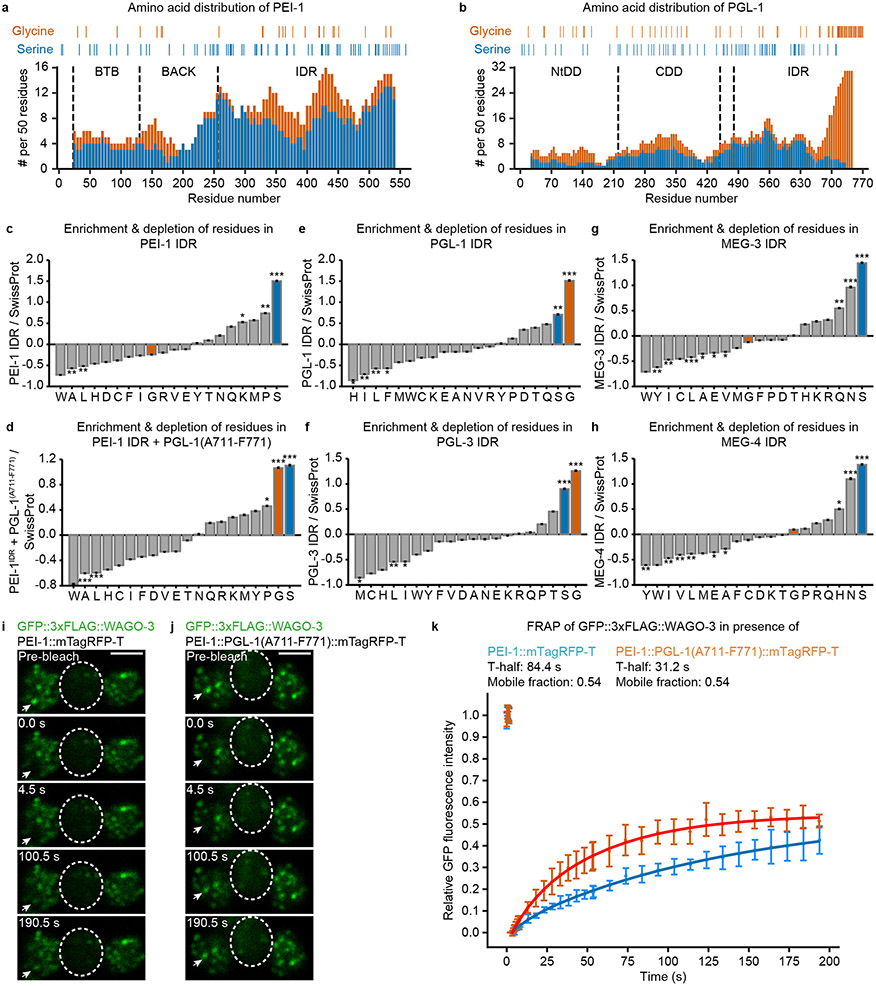
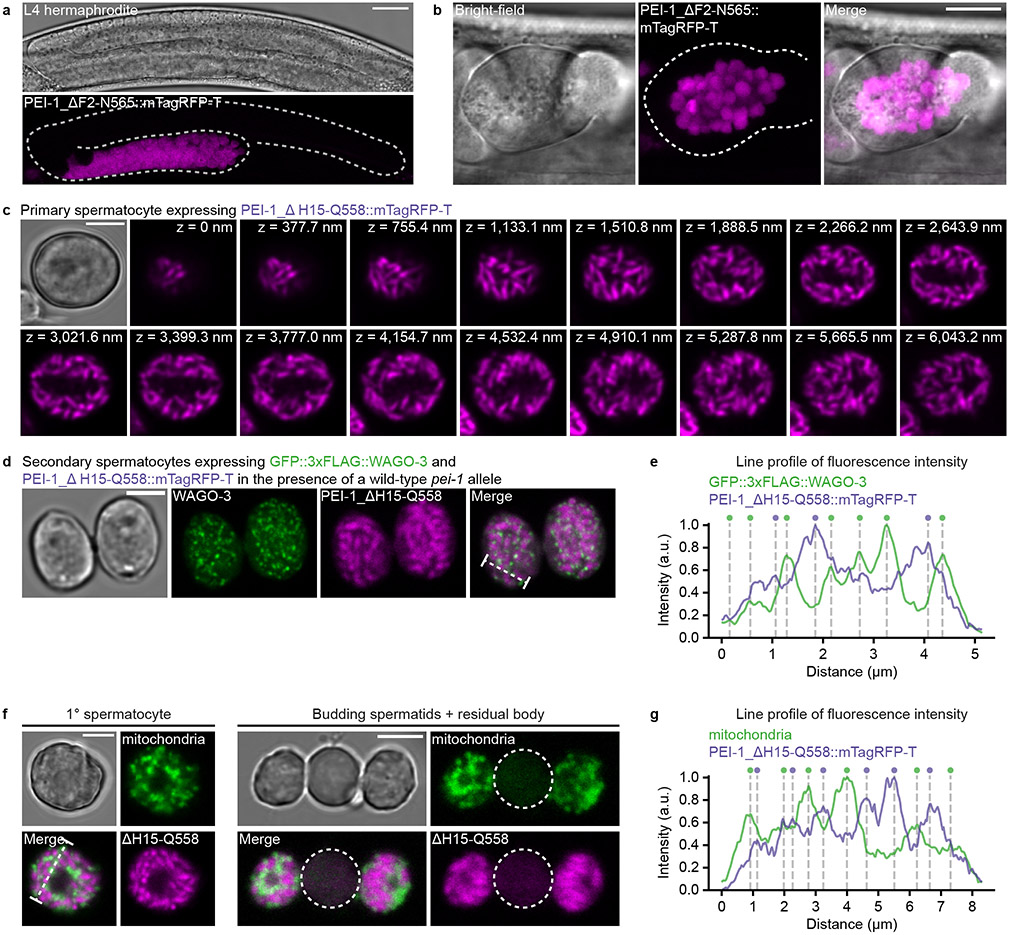
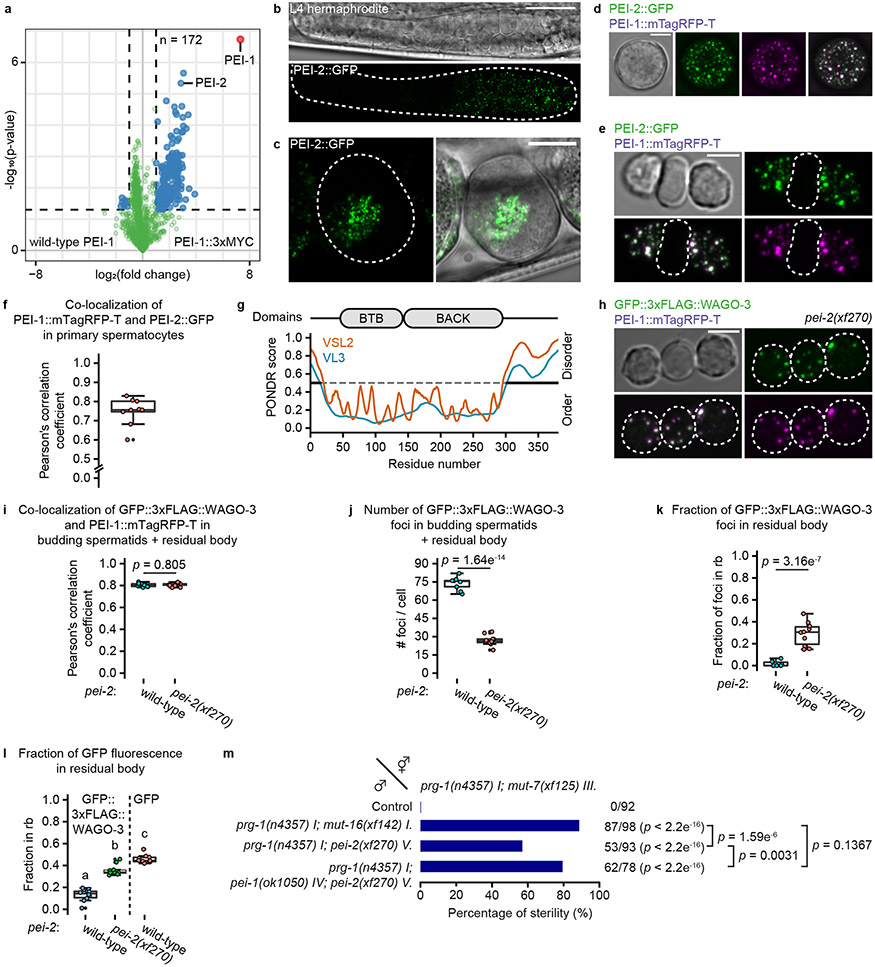
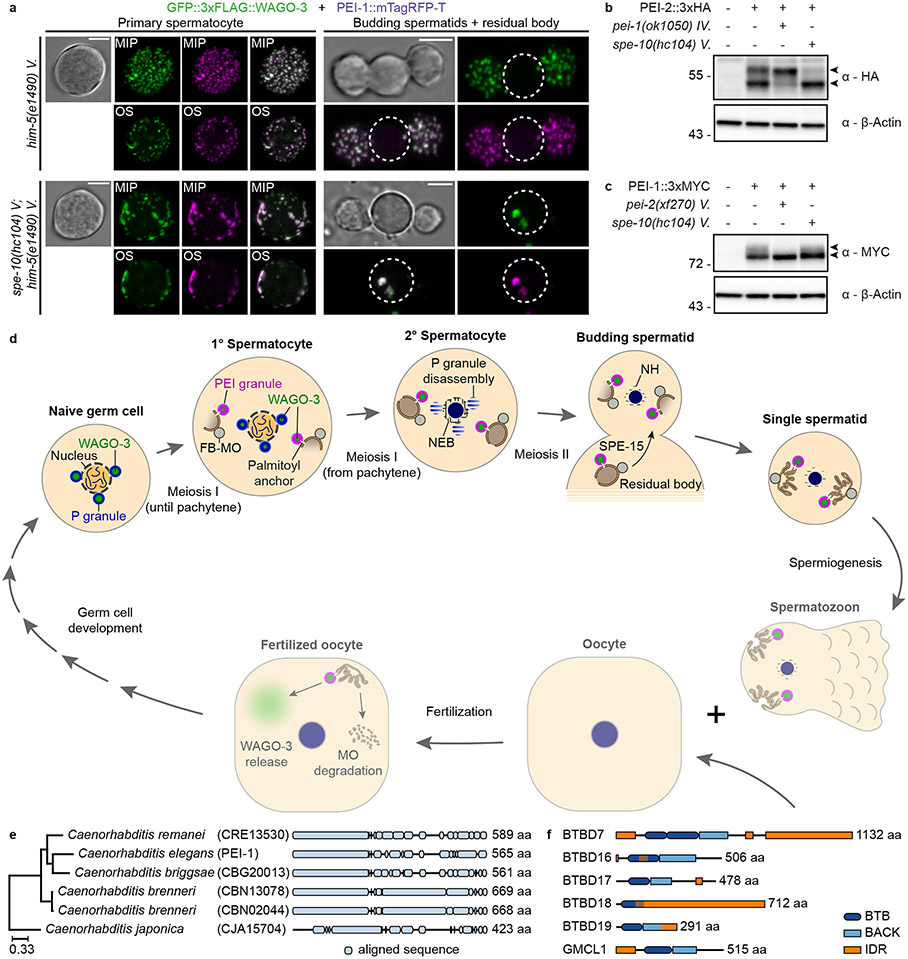
Epigenetic inheritance describes the transmission of gene regulatory information across generations without altering DNA sequences, enabling offspring to adapt to environmental conditions. Small RNAs have been implicated in this, through both the oocyte and the sperm. However, as much of the cellular content is extruded during spermatogenesis, it is unclear whether cytoplasmic small RNAs can contribute to epigenetic inheritance through sperm. Here we identify a sperm-specific germ granule, termed the paternal epigenetic inheritance (PEI) granule, that mediates paternal epigenetic inheritance by retaining the cytoplasmic Argonaute protein WAGO-3 during spermatogenesis in Caenorhabditis elegans. We identify the PEI granule proteins PEI-1 and PEI-2, which have distinct functions in this process: granule formation, Argonaute selectivity and subcellular localization. We show that PEI granule segregation is coupled to the transport of sperm-specific secretory vesicles through PEI-2 in an S-palmitoylation-dependent manner. PEI-like proteins are found in humans, suggesting that the identified mechanism may be conserved.


Figures

Extended Data Fig. 1
Extended Data Fig. 1. WAGO-3 is required for germline immortality and transgenerational maintenance of RNAe.
a, Mortal germline assay representing loss of fertility of strains with indicated genotype at 25°C. Statistical significance was tested with a log-rank-test (n = 15 populations per strain assayed in a single experiment). b, Diagram displaying mCherry::H2B(RNAe) reactivation in prg-1(n4357), prg-1(n4357);mut-7(xf125) and prg-1(n4357);wago-3(pk1673) mutant generations. F2-F5: second-fifth homozygous generation. For each generation, reactivation in 10 populations of 50 animals each was scored. Each plotted point represents the fraction of 50 animals that express the mCherry::H2B transgene. Since no prg-1(n4357) single mutant animal was found to reactivate mCherry::H2B expression, the value of this group is deterministically zero due to lack of variability/statistical noise. Thus, any positive number of animals that expresses the mCherry::H2B transgene in either the prg-1(n4357);mut-7(xf125) or prg-1(n4357);wago-3(pk1673) group causes a significant difference from the prg-1(n4357) group. c, Micrographs of three example animals with the mCherry::H2B transgene in either RNAe (prg-1(n4357)) or activated (prg-1(n4357);wago-3(pk1673) and prg-1(n4357);mut-7(xf125)) status. Top panel shows schematic representation of an adult hermaphroditic gonad. Activity status of the transgene was homogeneous in F2 homozygous prg-1(n4357) and prg-1(n4357);mut-7(xf125) mutants. Images represent two biologically independent experiments. Scale bars: 30 μm. Source data are provided.
Extended Data Fig. 2
Extended Data Fig. 2. WAGO-3 is associated with 22G RNAs.
a, Read length distribution and first nucleotide bias of indicated small RNA libraries. Both hermaphrodite and male libraries were prepared and sequenced in biological triplicates. Each panel represents a replicate, top and bottom bars represent sense and anti-sense small RNAs mapping to annotated loci. b, Heat map showing the enrichment or depletion of small RNA species of the libraries shown in a. >27 nt are non-specific RNA fragments, also including fragments of structural RNAs, such as rRNA and tRNA. 21U, 22G, 26G and miRNA are known Argonaute-associated small RNA species. Statistically significant differences between small RNA types were determined by Fisher’s exact tests (***: p ≤ 0.001, ns: p > 0.05). The exact P values are provided as source data. c, Box plots displaying the distribution of WAGO-3 associated 22G RNAs mapping to protein-coding genes across the indicated gene segments. Each box plot represents average data from three biological replicates. Boxplot centre and box edges indicate median and 25th or 75th percentiles, respectively, while whiskers indicate the median ± 1.5 x interquartile range. d, Metagene analysis of 22G RNA reads mapping to protein-coding WAGO-3 target genes. TSS – transcription start site, TES – transcription end site. Shading around each line represents the standard error of the median of each bin. Source data are provided.
Extended Data Fig. 3
Extended Data Fig. 3. WAGO-3 targets overlap with Mutator targets and sperm-derived 22G RNAs.
a, Scatter plots displaying the RPKM of 22G RNAs mapping to individual genes in immunoprecipitation (IP) (Y-axis) versus input (X-axis) samples for all six sequenced libraries. Transposons are not included in these plots. Light blue: significant enrichment of genes in at least two replicates. Dark blue: significant enrichment of genes in only one replicate. b, Germline expression status of protein-coding WAGO-3 target genes. Left column shows the distribution of expression profiles of all annotated protein-coding genes. Columns 2 and 3 show the same, but for hermaphrodite and male-specific WAGO-3 targets, respectively. Column 4 shows the same for targets found in both sexes. Statistically significant differences with respect to complete gene annotations were determined by Chi-square tests. c, Scatter plots displaying the RPKM of 22G RNAs mapping to transposons in the six individual experiments in input (X-axes) and IP samples (Y-axes). Red line represents the diagonal. d, Venn diagrams displaying the overlaps of WAGO-3 targets (protein-coding) called in hermaphrodites and males with previously determined CSR-1 and MUT-16 targets. e, Stacked bar plot showing number and types of WAGO-3 targets. f, Heat map showing the overlap of WAGO-3 targets (protein-coding) with previously determined sperm-derived 22G RNA targets (protein-coding), which were binned into indicated groups. Values inside the boxes indicate fraction of overlap. Source data are provided.
Extended Data Fig. 4
Extended Data Fig. 4. PEI granules specifically recruit WAGO-3.
a-b, Confocal maximum intensity projections of an adult hermaphrodite (a) and gastrula-staged embryo (b) expressing indicated proteins. Zooms show perinuclear co-localization of GFP::3xFLAG::WAGO-3 and PGL-1::mTagRFP-T in meiotic (a) and primordial (b) germ cells. Z2/Z3 are the primordial germ cells of C. elegans. Scale bars: 20 μm (a, adult), 20 μm (b, embryo), 10 μm (a, zoom), 4 μm (b, zoom). c, Quantification of GFP::3xFLAG::WAGO-3 foci number within indicated, male-derived germ cells (n = 10 cells pooled from two independent experiments, for each condition). Statistically significant differences were determined by one-way ANOVA (p ≤ 0.001) followed by Tukey’s honestly significant difference post hoc test (p ≤ 0.05). Different letters represent significant differences. Note that the values for primary spermatocytes and budding spermatids (c) are the same as those shown in Fig. 3j (FL) and Extended Data Figure 10f (wild-type), and Fig. 4n (FL) and Fig. 7j (wild-type), respectively. Secondary spermatocyte and budding spermatid stages are separated into ‘c’ and ‘s’. c: coupled; due to incomplete cytokinesis, leaving the two sister cells coupled and both cells were analyzed; s: separate, each of the coupled cells in ‘c’ was analyzed individually. Boxplot centre and box edges indicate median and 25th or 75th percentiles, respectively, while whiskers indicate the median ± 1.5 x interquartile range. d, Co-immunoprecipitation experiments using whole-worm extracts of late-L4 stage hermaphrodites analyzed by Western blotting. Sample processing control was run on a different gel. Data represent two biologically independent experiments. e-j, Confocal micrographs of an adult male (f) and late-L4 stage hermaphrodites (e,g-j) expressing indicated proteins. sc – spermatocyte, st – spermatid, rb – residual body. Scale bars: 10 μm (e-j). a,b,e-j, Images represent two biologically independent experiments. k-n, Co-localization analyses between PEI-1::mTagRFP-T and DEPS-1::GFP (k), GFP::3xFLAG::WAGO-1 (l), GFP::3xFLAG::CSR-1 (m) and GFP::3xFLAG::ALG-3 (n) based on the images shown in g-j, respectively (n = 10 worms for each condition). X and Y axes indicate fluorescence intensity. PC: Pearson’s correlation coefficient. Exact P values (c), unprocessed original scans of blots and the source data for all graphical representations are provided.
Extended Data Fig. 5
Extended Data Fig. 5. Presence of WAGO-3 in spermatozoa is dependent on the IDR of PEI-1.
a, Confocal micrographs showing spermatogenesis of late-L4 stage hermaphrodites expressing PEI 1::mTagRFP-T in indicated mutants. sc – spermatocyte, rb – residual body, st – spermatid. Images represent two biologically independent experiments. Scale bars: 10 μm. b-h, Confocal maximum intensity projections of hermaphrodite-derived spermatozoa within the spermatheca expressing indicated proteins. In all panels, except c, a piece of a gonad arm expressing GFP::3xFLAG::WAGO-3 is visible in the top part of the image. Dashed lines indicate spermatheca. Images represent two biologically independent experiments. Scale bars: 10 μm.
Extended Data Fig. 6
Extended Data Fig. 6. PEI granules are static condensates with liquid-like properties.
a-b, Confocal micrographs of isolated, male-derived spermatocytes (a) and budding spermatids (b) expressing GFP::3xFLAG::WAGO-3 and PEI-1::mTagRFP-T. Images were taken after a 30 minute treatment with 1,6-hexanediol. Hoechst33342 was used to stain DNA. Residual bodies are marked by a dashed circle. Images represent two biologically independent experiments. Scale bars: 4 μm. c, FRAP recovery curve of GFP::3xFLAG::WAGO-3 localizing to either P granules in L4 gonads or PEI granules in male-derived spermatids. Normalized data is presented as mean +/− SD and was fitted to a double exponential curve (n = 4 granules pooled from one independent experiment). d, Time sequence showing fluorescence recovery after photobleaching (FRAP) of GFP::3xFLAG::WAGO-3 localizing to either P granules in L4 gonads or PEI granules in male-derived spermatids. Residual bodies are marked by a dashed circle. Images represent two biologically independent experiments. Scale bars: 4 μm. e, Time sequence of GFP::3xFLAG::WAGO-3, taken from Extended Data Movie 1. Images are confocal maximum intensity projections of an isolated, male-derived spermatocyte. Images represent two biologically independent experiments. Scale bar: 4 μm. Source data are provided.
Extended Data Fig. 7
Extended Data Fig. 7. The amino acid composition of the PEI-1 IDR affects exchange dynamics of WAGO-3.
a-b, Occurrence of glycine and serine residues in PEI-1 (a) and PGL-1 (b) was counted in amino acid 50-mers, starting at position one, shifting 5 residues at a time, and displayed as stacked columns. Indicated residue positions in the diagrams are the mid-point of the 50-mer. Y-axes display number of relevant residues in amino acid 50-mers. X-axes indicate the position along the respective proteins. The various domains are indicated by vertical, dashed lines. NtDD and CDD indicate the N-terminal and C-terminal dimerization domains of PGL-1, respectively. The exact positions of glycine and serine residues for each protein are indicated above the stacked bar diagrams. IDR – intrinsically disordered region. c-h, Amino acid composition profiles of the intrinsically disordered region of the indicated proteins. Bars representing serine and glycine residues are highlighted in blue and orange, respectively. Panel d reflects a fusion between the PEI-1 IDR and the very C-terminal end of PGL-1(A711-F771). The profiles were generated using Composition profiler. Sequences were analyzed against the SwissProt database using 10,000 bootstrap iterations. Statistical significance was tested using the two sample t test (***: p ≤ 0.001, **: p ≤ 0.01, *: p ≤ 0.05, ns: p > 0.05). The exact P values are provided as source data. i-j, Time lapse images showing fluorescence recovery after photobleaching (FRAP) of GFP::3xFLAG::WAGO-3 localizing to PEI granules via PEI-1::mTagRFP-T (i) or via PEI-1::PGL-1(A711-F771)::mTagRFP-T (j) in isolated, male-derived budding spermatids. Residual bodies are marked by a dashed circle. Images represent two biologically independent experiments. Scale bars: 4 μm. k, FRAP recovery curves of GFP::3xFLAG::WAGO-3 localizing to PEI granules, containing indicated PEI-1 proteins, in male-derived budding spermatids. Normalized data is presented as mean +/− SD and was fitted to a double exponential curve (n = 5 granules pooled from one independent experiment). Source data are provided.
Extended Data Fig. 8
Extended Data Fig. 8. PEI-1 peptides at the N- and C-termini localize to asymmetrically segregated structures of defined shape.
a, Confocal micrograph of an L4 hermaphrodite expressing free mTagRFP-T from the pei-1 locus. The dashed line indicates the outline of the gonad. Scale bar: 20 μm. b, Confocal maximum intensity projection of spermatozoa within the spermatheca of an adult hermaphrodite expressing free mTagRFP-T from the pei-1 locus. The dashed line indicates the outline of the spermatheca. Scale bar: 10 μm. c, Confocal Z-stack of an isolated, male-derived spermatocyte expressing PEI-1_ΔH15-Q558::mTagRFP-T (see Fig. 4a, middle construct). Z-size: 125.9 nm. Scale bar: 4 μm. d, Confocal micrograph of two isolated, male-derived secondary spermatocytes expressing GFP::3xFLAG::WAGO-3 and PEI-1_ΔH15-Q558::mTagRFP-T. The pei-1 locus was heterozygous: pei-1_ΔH15-Q558::mTagRfp-t/pei-1(+). This allowed the formation and visualization of both PEI granules and PEI-1_ΔH15-Q558-specific structures within the same animal. Scale bar: 4 μm. e, Line profiles displaying relative fluorescence intensity for PEI-1_ΔH15-Q558::mTagRFP-T signals versus GFP::3xFLAG::WAGO-3 signals over the indicated, dashed line shown in panel d. Vertical lines and colored circles indicate fluorescence peaks. a.u. – arbitrary unit. f, Confocal micrograph of an isolated, male-derived spermatocyte (left) and budding spermatids (right) showing the subcellular distribution of mitochondria and PEI-1_ΔH15-Q558-specific structures. MitoTracker® Green FM was used to stain mitochondria. Residual bodies are marked by dashed circles. Scale bar: 4 μm. g, Line profiles displaying relative fluorescence intensity for PEI-1_ΔH15-Q558::mTagRFP-T signals versus mitochondria signals over the indicated, dashed line shown in panel f. Vertical lines and colored circles indicate fluorescence peaks. a.u. – arbitrary unit. All images represent two biologically independent experiments. Source data are provided.
Extended Data Fig. 9
Extended Data Fig. 9. PEI granules are associated with membranous organelles throughout spermatogenesis.
a-c, Overview GFP::3xFLAG::WAGO-3 CLEM montages acquired from three high-pressure frozen adult males expressing GFP::3xFLAG::WAGO-3 and PEI-1::mTagRFP-T. The depicted animals were used to collect the high-resolution CLEM images shown in Fig. 6a-e. In all three panels, germ cell development progresses from left to right. The GFP::3xFLAG::WAGO-3 signal is fitted locally, implying that fluorescence signal was fitted using landmarks (tetraspecks and Hoechst staining) spread over the entire region of interest, spanning a larger field of view. The panels a’-a’”, b’ and c’ depict zoom-ins of the indicated areas in panels a-c. The indicated ‘Tomo’ regions within these zoomed-in panels are shown in greater detail in Fig. 6a-e. Precise CLEM overlays at specific ROIs (Tomos 1 to 5) were done using landmarks more locally and close to each ROI, covering a smaller field of view. The EM grids shown in panels a-c can be navigated using Fiji software and data deposited to Mendeley Data (https://data.mendeley.com/datasets/dgb8d7h2hz/1) , following the instruction listed in Supplementary Information. All images represent two biologically independent experiments.
Extended Data Fig. 10
Extended Data Fig. 10. PEI-2 interacts with PEI-1.
a, Co-immunoprecipitation experiments using whole-worm extracts of late-L4 stage hermaphrodites analyzed by Western blotting. Labels above the blots indicate the presence (+) or absence (−) of the respective tags. Asterisks indicate non-specific signals. b, Pull-down experiments on extracts of transfected BmN4 cells expressing the indicated PEI-1 and PEI-2 variants. Full-length (FL) PEI-1-mCherry was pulled down, followed by detection of the various PEI-2 fragments. Expression of free 3xFLAG-eGFP served as negative control. c, Fraction of total mTagRFP-T signal within the residual body of male-derived budding spermatids expressing PEI-1_ΔH15-Q558::mTagRFP-T in wild-type or pei-2(xf270) mutant background (n = 10 cells pooled from two independent experiments, for each condition). Note that the wild-type data is the same as shown in Fig. 5c (ΔH15-Q558). d, Confocal maximum intensity projection of isolated, male-derived budding spermatids expressing PEI-1_ΔH15-Q558::mTagRFP-T in pei-2(xf270) mutant background. The residual body is marked by a dashed circle. Scale bar: 4 μm. e, Confocal maximum intensity projection of an isolated, male-derived primary spermatocyte expressing GFP::3xFLAG::WAGO-3 and PEI-1::mTagRFP-T in pei-2(xf270) mutant background. Scale bar: 4μm. d,e, Images represent two biologically independent experiments. f-g, Co-localization analysis between GFP::3xFLAG::WAGO-3 and PEI-1::mTagRFP-T (g), and quantification of GFP::3xFLAG::WAGO-3 foci number (f) in wild-type and pei-2(xf270) mutant, male-derived primary spermatocytes (n = 10 cells pooled from two independent experiments, for each condition). c,f,g, Statistically significant differences were determined by one-way ANOVA (p ≤ 0.001). Boxplot centre and box edges indicate median and 25th or 75th percentiles, respectively, while whiskers indicate the median ± 1.5 x interquartile range. Note that the wild-type data in f and g are the same as those shown in Fig. 3j (FL) and Extended Data Figure 4c (primary spermatocyte), and Fig. 3k (FL), respectively. h-i, Transfected BmN4 cells were treated with the palmitoylation inhibitor 2-BP at indicated concentrations, followed by Western Blot detection of PEI-1-mCherry (h) and PEI-2-HA-eGFP (i). α-tubulin served as loading control. a,b,h,i, The experiment has been performed once. Unprocessed original scans of blots are provided in source data.
Fig. 1 ∣
Fig. 1 ∣. WAGO-3 is guided into sperm by PEI-1.
a, Schematic summarizing spermatogenesis in C. elegans. Corresponding confocal images of male-derived cells expressing GFP::3xFLAG::WAGO-3 are shown below. Scale bars: 4μm. b, Volcano plot representing label-free proteomic quantification of quadruplicate GFP::3xFLAG::WAGO-3 immunoprecipitation experiments from late-L4 stage hermaphrodite extracts. The X-axis indicates the mean fold enrichment of individual proteins in the control versus the genome-edited strain. The Y-axis represents −log10(p value) of observed enrichments. Dashed lines show thresholds at p = 0.05 and two-fold enrichment. Blue and green data points represent above and below threshold, respectively. WAGO-3 and PEI-1 are highlighted with red data points. c, Confocal micrograph showing spermatogenesis of late-L4 stage hermaphrodite expressing indicated proteins. PGL-1::mTagRFP-T serves as P granule marker. Germ cell development progresses from left to right. Zoom of two areas is provided. ROI1: PGL-1::mTagRFP-T and GFP::3xFLAG::WAGO-3 co-localize; ROI2: GFP::3xFLAG::WAGO-3 leaves P granules; ROI3: PGL-1::mTagRFP-T signal is not detectable anymore. sc – spermatocyte, rb – residual body, st – spermatid. Scale bars: 10 μm (proximal gonad), 4 μm (zoom). d, Co-localization analysis between GFP::3xFLAG::WAGO-3 and PGL-1::mTagRFP-T based on the image shown in c. Signals from ROI1-3 are plotted in orange, blue and green, respectively. X and Y axes indicate fluorescence intensity. PC: Pearson’s correlation coefficient. e, As c, for PEI-1::mTagRFP-T instead of PGL-1::mTagRFP-T. ROI1: no PEI-1::mTagRFP-T expression. ROI2: PEI-1::mTagRFP-T is expressed. sc – spermatocyte, rb – residual body, st – spermatid. Scale bars: 10 μm (proximal gonad), 4 μm (zoom). f, As d for PEI-1::mTagRFP-T instead of PGL-1::mTagRFP-T. g, Confocal maximum intensity projections of male-derived budding spermatids expressing GFP::3xFLAG::WAGO-3 in presence and absence of PEI-1. Scale bars: 4 μm. h, Confocal micrograph showing spermatogenesis of late-L4 stage hermaphrodite expressing GFP::3xFLAG::WAGO-3 and PGL-1::mTagRFP-T in a pei-1(ok1050) mutant background. Germ cell development progresses from left to right. Zoom of two areas is provided. ROI1: PGL-1::mTagRFP-T is expressed; ROI2: no PGL-1::mTagRFP-T expression detectable. sc – spermatocyte, rb – residual body, st – spermatid. Scale bars: 10 μm (proximal gonad), 4 μm (zoom). i, As d in a pei-1(ok1050) mutant background based on the image shown in h. c,e,g,h, Images represent three biologically independent experiments. Source data are provided.
Fig. 2 ∣
Fig. 2 ∣. WAGO-3 and PEI-1 are required for paternal epigenetic inheritance.
a, Schematic illustration of crosses used to probe the specific effects of maternal and paternal epigenetic inheritance on the Mutator-induced sterility (Mis) phenotype. The mut-7(pk204) and mut-16(pk710) alleles both cause global depletion of Mutator 22G RNAs, and can be used interchangeably. Colour code of the small RNAs: Grey – absent. Green – present, without parental influence. Orange – present, with maternal influence. Blue – present, with paternal influence. b-c, Percentage of fertile F1 animals generated by crosses between males and hermaphrodites of indicated genotypes. Fertility implies: presence of paternal (b) or maternal (c) epigenetic inheritance. Sterility implies: no epigenetic inheritance. Statistical significance was tested with a Pearson's Chi-squared test with Yates' continuity correction (NA - not available).
Fig. 3 ∣
Fig. 3 ∣. Granule formation and WAGO-3 interaction are mediated via different PEI-1 domains.
a, PEI-1 domain composition. Prediction of naturally disordered regions was performed using PONDR VSL2 and PONDR VL3 algorithms. b, Schematic representation of truncated PEI-1::mTagRFP-T and GFP::3xFLAG::WAGO-3 proteins generated by CRISPR/Cas9 mediated genome editing. IDR – intrinsically disordered region. c-i,l, Confocal maximum intensity projections of isolated, male-derived primary spermatocytes expressing indicated proteins. In all images: Green – GFP::3xFLAG::WAGO-3 (except l), magenta – PEI-1::mTagRFP-T variants. Images represent two biologically independent experiments. Scale bars: 4 μm. h, Compared to g, this image was acquired with a higher gain in order to visualize remaining PEI-1::mTagRFP-T signal within the spermatocyte. l, Free GFP is expressed from the wago-3 locus. j-k, Quantification of GFP::3xFLAG::WAGO-3 foci number (j), and co-localization of GFP::3xFLAG::WAGO-3 and PEI-1::mTagRFP-T (k) in isolated, male-derived primary spermatocytes expressing indicated PEI-1::mTagRFP-T variants (FL = full-length, n = 10 cells pooled from two independent experiments, for each condition). Statistically significant differences were determined by one-way ANOVA (p ≤ 0.001) followed by Tukey’s honestly significant difference post hoc test (p ≤ 0.05). Different letters represent significant differences. The exact P values are provided as source data. Boxplot centre and box edges indicate median and 25th or 75th percentiles, respectively, while whiskers indicate the median ± 1.5 x interquartile range. Note that the FL data in panel j and k are the same as those displayed in Extended Data Figure 4c (primary spermatocyte) and Extended Data Figure 10f (wild-type), and Extended Data Figure 10g (wild-type), respectively. m, Confocal micrograph of an L4 stage hermaphrodite expressing free GFP from the endogenous wago-3 locus. Image represents two biologically independent experiments. sc – spermatocyte, rb – residual body, st – spermatid. Scale bar: 20 μm. Source data are provided.
Fig. 4 ∣
Fig. 4 ∣. The IDR of PEI-1 is required for WAGO-3 segregation into spermatids.
a-h, Confocal maximum intensity projections of isolated, male-derived budding spermatids expressing indicated proteins. In all images: Green – GFP::3xFLAG::WAGO-3 (except h), magenta – PEI-1::mTagRFP-T variants. Residual bodies are marked by a dashed circle. Scale bars: 4 μm. f, Compared to e, this image was acquired with higher gain in order to visualize remaining PEI-1::mTagRFP-T signal within the budding spermatids. h, Free GFP is expressed from the wago-3 locus. i-j, Plots displaying fluorescence intensity (X-axis) versus the mean of relative pixel count (Y-axis) of GFP::3xFLAG::WAGO-3 signal in budding spermatids (i) and residual bodies (j) expressing the indicated PEI-1::mTagRFP-T variants (n = 10 cells pooled from two independent experiments, for each condition). Relative pixel count is the number of pixels with a given intensity within a selected region, divided by the total number of pixels in that region. In each plot, the curve derived from full-length (FL) PEI-1::mTagRFP-T is also depicted in blue. The width of the curves reflects the standard deviation of the mean. k-n, Quantification of co-localization of GFP::3xFLAG::WAGO-3 and PEI-1::mTagRFP-T in budding spermatids + residual body (k), fraction of GFP::3xFLAG::WAGO-3 foci in residual body (l), total GFP::3xFLAG::WAGO-3 signal in residual body (m) and GFP::3xFLAG::WAGO-3 foci number in budding spermatids + residual body (n) of male-derived cells expressing indicated PEI-1::mTagRFP-T variants (FL = full-length, n = 10 cells pooled from two independent experiments, for each condition). Statistically significant differences were determined by one-way ANOVA (p ≤ 0.001) followed by Tukey’s honestly significant difference post hoc test (p ≤ 0.05). Different letters represent significant differences. The exact P values are provided as source data. Boxplot centre and box edges indicate median and 25th or 75th percentiles, respectively, while whiskers indicate the median ± 1.5 x interquartile range. Note that the FL data in k,l,m,n is the same as the wild-type data shown in Fig. 7i, Fig. 7k, Fig. 7l, and Fig. 7j and Extended Data Figure 4c (budding spermatid (c)), respectively. Representative images from two biologically independent experiments are shown in panels a-h. Source data are provided.
Fig. 5 ∣
Fig. 5 ∣. PEI granule segregation is dependent on SPE-15.
a, Schematic representation of two mTagRFP-T proteins generated by CRISPR/Cas9 mediated genome editing of the pei-1 locus. The ΔH15-Q558 deletion leaves 14 and 7 amino acids from the PEI-1 N- and C-terminus, respectively. The ΔF2-N565 deletion removes all PEI-1-specific amino acids. IDR – intrinsically disordered region. b, Confocal micrographs of isolated, male-derived spermatocytes (left panel) and budding spermatids (right panel) each expressing one of the proteins shown in a. Dashed circles indicate residual bodies. Images represent two biologically independent experiments. Scale bars: 4 μm. c, Fraction of total mTagRFP-T signal within the residual body of male-derived budding spermatids expressing indicated proteins (FL = full-length, n = 10 cells, which were pooled from multiple experiments, for each condition). Note that the ΔH15–Q558 data is the same as the one displayed in Extended Data Figure 10c (wild-type). d, Quantification of mTagRFP-T structures in isolated, male-derived, primary spermatocytes expressing indicated proteins (FL = full-length, n = 10 cells pooled from two independent experiments, for each condition). To the right: extrapolated number of FB-MOs in primary spermatocytes based on LysoSensor Blue DND-192 staining in spermatids (n = 36 cells pooled from two independent experiments). c,d, Statistically significant differences were determined by one-way ANOVA (p ≤ 0.001) followed by Tukey’s honestly significant difference post hoc test (p ≤ 0.05). Boxplot centre and box edges indicate median and 25th or 75th percentiles, respectively, while whiskers indicate the median ± 1.5 x interquartile range. Representative images are shown in b. e, Confocal maximum intensity projections and optical sections of isolated, male-derived spermatocytes and budding spermatids expressing GFP::3xFLAG::WAGO-3 and PEI-1::mTagRFP-T in a spe-15(ok153) mutant background. The strain contained a him-mutation to increase the frequency of males in the cultures. Dashed circles indicate residual bodies. Images represent two biologically independent experiments. MIP - maximum intensity projection. OS – optical section. Scale bars: 4 μm. Source data are provided.
Fig. 6 ∣
Fig. 6 ∣. PEI granules are associated with membranous organelles.
a-e, Representative dual-color CLEM images acquired in indicated germ cells of spermatogenesis (indicated at the top) of high-pressure frozen adult males expressing GFP::3xFLAG::WAGO-3 and PEI-1::mTagRFP-T. The four rows show the EM-only (a-e), EM with annotations (a’-e’), EM with GFP::3xFLAG::WAGO-3 fluorescence (a”-e”), and EM with PEI-1::mTagRFP-T fluorescence (a’”-e’”). The GFP::3xFLAG::WAGO-3-only positive focus in panel a” (black arrow head) is adjacent to the nucleus, and most likely representing a P granule. Images represent two biologically independent experiments. Annotations: EM - electron microscopy, CLEM - correlative light and electron microscopy, N – nucleus, M – mitochondrion, MO – membranous organelle, FB – fibrous body, GO – Golgi complex, NH – peri-nuclear halo, D – DNA. Scale bars: 500 nm. Source data are provided.
Fig. 7 ∣
Fig. 7 ∣. PEI-2 affects PEI granule segregation.
a, Volcano plot representing label-free proteomic quantification of PEI-1::3xMYC IP experiments from late-L4 stage hermaphrodite extracts. See Fig. 1b for further information. b, Confocal micrograph of an L4 hermaphrodite expressing PEI-2::GFP. Dashed line encloses the gonad. Scale bar: 20 μm. c, Confocal maximum intensity projection of spermatozoa within the spermatheca of an adult hermaphrodite expressing PEI-2::GFP. Dashed line encloses the spermatheca. Scale bar: 10 μm. d-e, Confocal maximum intensity projection of an isolated, male-derived primary spermatocyte (d) and budding spermatids (e) expressing PEI-1::mTagRFP-T and PEI-2::GFP. Dashed lines in e indicate the residual body. Scale bars: 4 μm. f, Co-localization analysis between PEI-1::mTagRFP-T and PEI-2::GFP in isolated, male-derived primary spermatocytes (n = 9 cells pooled from two independent experiments). g, PEI-2 domain organization. Features are as detailed in Fig. 3a. h, Confocal maximum intensity projections of isolated, male-derived budding spermatids expressing GFP::3xFLAG::WAGO-3 and PEI-1::mTagRFP-T in pei-2(xf270) mutant background. Dashed circles indicate cells. Scale bar: 4 μm. i-l, Quantification of GFP::3xFLAG::WAGO-3 and PEI-1::mTagRFP-T expression in wild-type and pei-2(xf270) mutant, male-derived budding spermatids (n = 10 cells pooled from two independent experiments, for each condition). i: Co-localization of GFP::3xFLAG::WAGO-3 and PEI-1::mTagRFP-T; j: Total number of GFP::3xFLAG::WAGO-3 foci; k: Fraction of GFP::3xFLAG::WAGO-3 foci within the residual body; l: Fraction of total GFP::3xFLAG::WAGO-3 signal within the residual body. The wild-type (i-l) and free GFP (l) data are the same as those shown as FL in Fig. 4k-n. Statistically significant differences were determined by one-way ANOVA (p ≤ 0.001) followed by Tukey’s honestly significant difference post hoc test (p ≤ 0.05). Different letters in l represent significant differences. m, Percentage of fertile F1 animals generated by crosses between males and hermaphrodites with the indicated genotypes. See Fig. 2 for further information. Statistical significance was tested with a Pearson's Chi-squared test with Yates' continuity correction. f,i,j,k,l, Boxplot centre and box edges indicate median and 25th or 75th percentiles, respectively, while whiskers indicate the median ± 1.5 x interquartile range. Images in b-e and h represent two biologically independent experiments. Exact P vaules (l) and source data are provided.
Fig. 8 ∣
Fig. 8 ∣. PEI granule formation and segregation depends on S-palmitoylation.
a, Confocal maximum intensity projections and optical sections of isolated, male-derived spermatocytes and budding spermatids expressing GFP::3xFLAG::WAGO-3 and PEI-1::mTagRFP-T in indicated mutants. Strains contained him-mutations to increase the frequency of males in the cultures. Dashed circles indicate residual bodies. Images represent two biologically independent experiments. MIP - maximum intensity projection. OS – optical section. Scale bars: 4 μm. b-c, Whole-worm extracts of late-L4 stage hermaphrodites were separated via SDS-PAGE, followed by Western transfer and chemiluminescence detection of PEI-2::3xHA (b) and PEI-1::3xMYC (c) in indicated mutants. The doublet signals of both proteins are indicated by arrow heads. β-actin served as loading control. Unprocessed original scans of blots are provided in source data. The experiment in b and c has been performed once. d, We provide data for the top half of the model: WAGO-3 starts in P granules, gradually moves to PEI granules that associate with FB-MOs via S-palmitoylation, which ensures spermatid localization via SPE-15 dependent transport. The bottom half is hypothetical, and depicted in reduced opacity. We speculate that PEI granules release their content into the oocyte, helping to establish/maintain silencing of specific targets (see Extended Data Figure 1). Schematic representation is not to scale. Annotations: MO – membranous organelle, FB – fibrous body, NH – peri-nuclear halo. e, Phylogenetic analysis showing PEI-1 conservation within the Caenorhabditis genus. The phylogenetic three was generated using EggNOG (v4.5.1). PEI-1 was defined as query and compared to all eukaryote entries. f, Protein length and domain composition of six human BTB domain-containing proteins that resemble PEI-1 protein composition.

Comment in

References

MAIN MANUSCRIPT REFERENCES

    1. Bošković A & Rando OJ Transgenerational epigenetic inheritance. Annu. Rev. Genet 52, 21–41 (2018). - PubMed
    1. Hutvagner G & Simard MJ Argonaute proteins: Key players in RNA silencing. Nat. Rev. Mol. Cell Biol 9, 22–32 (2008). - PubMed
    1. Peters L & Meister G Argonaute Proteins: Mediators of RNA Silencing. Mol. Cell 26, 611–623 (2007). - PubMed
    1. Castel SE & Martienssen RA RNA interference in the nucleus: Roles for small RNAs in transcription, epigenetics and beyond. Nat. Rev. Genet 14, 100–112 (2013). - PMC - PubMed
    1. Xu F, Guang S & Feng X Distinct nuclear and cytoplasmic machineries cooperatively promote the inheritance of RNAi in Caenorhabditis elegans. Biol. Cell 110, 217–224 (2018). - PubMed

METHOD REFERENCES

    1. Brenner S The genetics of Caenorhabditis elegans. Genetics 77, 71–94 (1974). - PMC - PubMed
    1. Schweinsberg PJ & Grant BD C. elegans gene transformation by microparticle bombardment. in WormBook 1–10 (2013). doi:10.1895/wormbook.1.166.1 - DOI - PMC - PubMed
    1. Haeussler M et al. Evaluation of off-target and on-target scoring algorithms and integration into the guide RNA selection tool CRISPOR. Genome Biol. 17, 148 (2016). - PMC - PubMed
    1. Chen B et al. Dynamic imaging of genomic loci in living human cells by an optimized CRISPR/Cas system. Cell 155, 1479–1491 (2013). - PMC - PubMed
    1. Chiu J, March PE, Lee R & Tillett D Site-directed, Ligase-Independent Mutagenesis (SLIM): a single-tube methodology approaching 100% efficiency in 4 h. Nucleic Acids Res. 32, (2004). - PMC - PubMed

Publication types

Substances