. 2022 Feb;19(2):205-215.
doi: 10.1038/s41592-021-01364-4. Epub 2022 Feb 7.

NTR 2.0: a rationally engineered prodrug-converting enzyme with substantially enhanced efficacy for targeted cell ablation

Affiliations

NTR 2.0: a rationally engineered prodrug-converting enzyme with substantially enhanced efficacy for targeted cell ablation

Abigail V Sharrock et al. Nat Methods. 2022 Feb.

Abstract

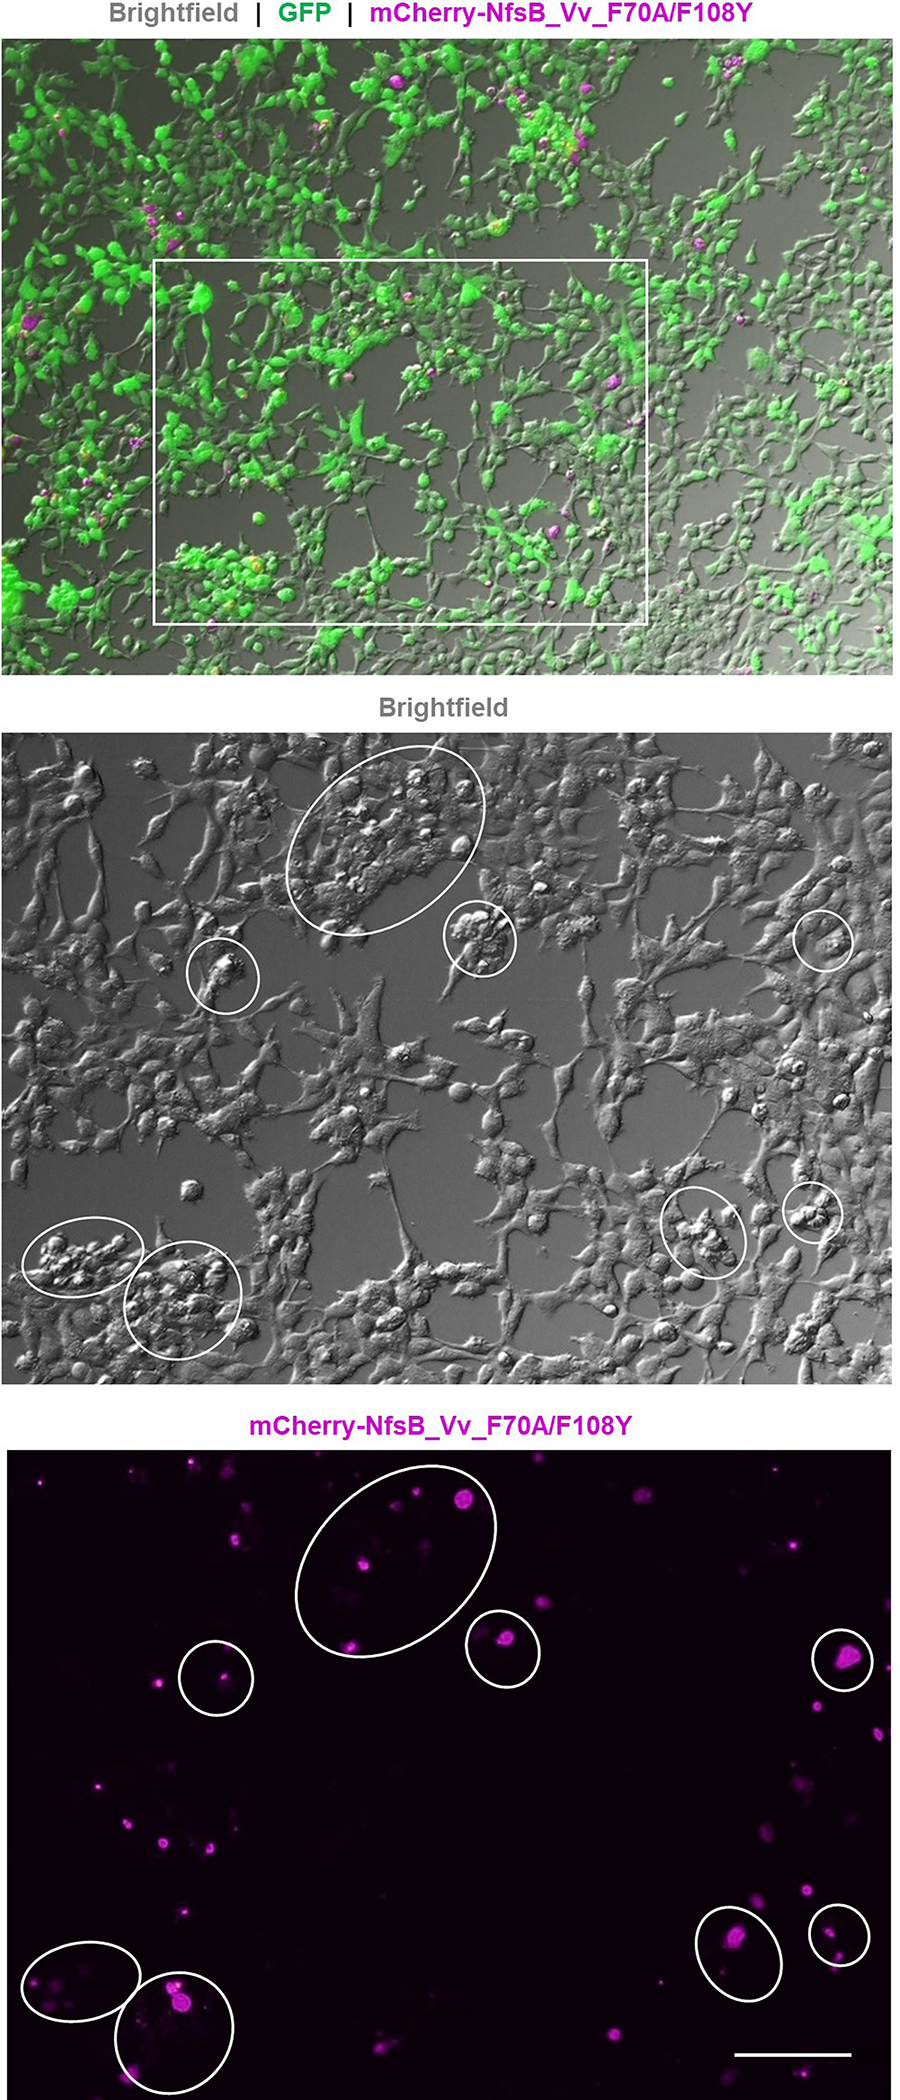
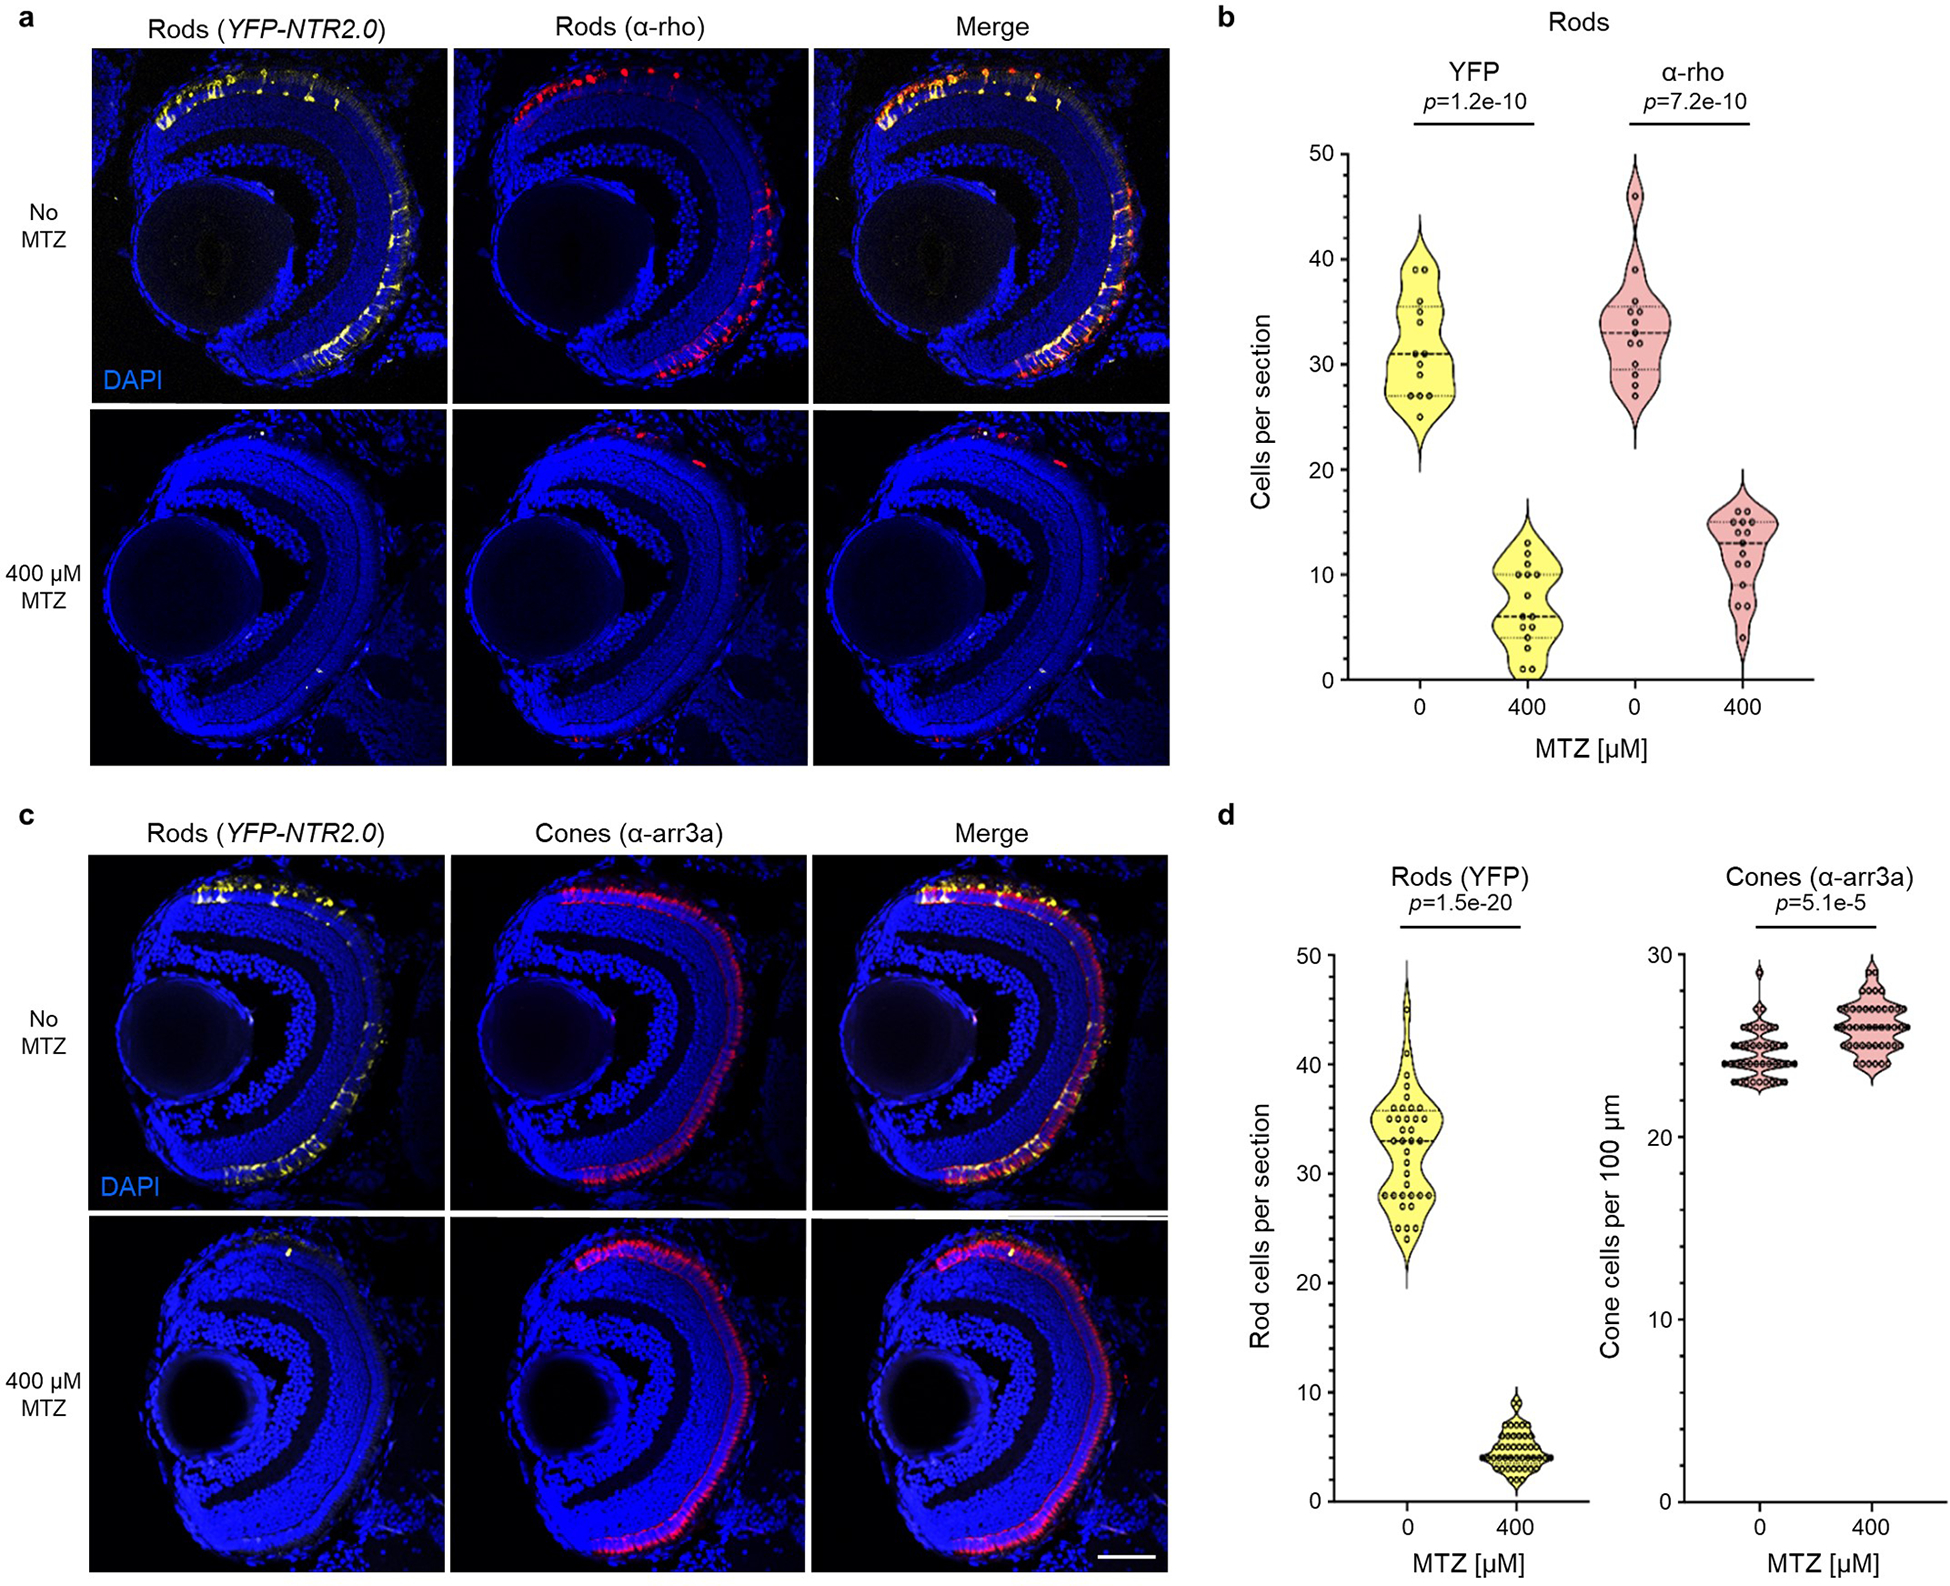
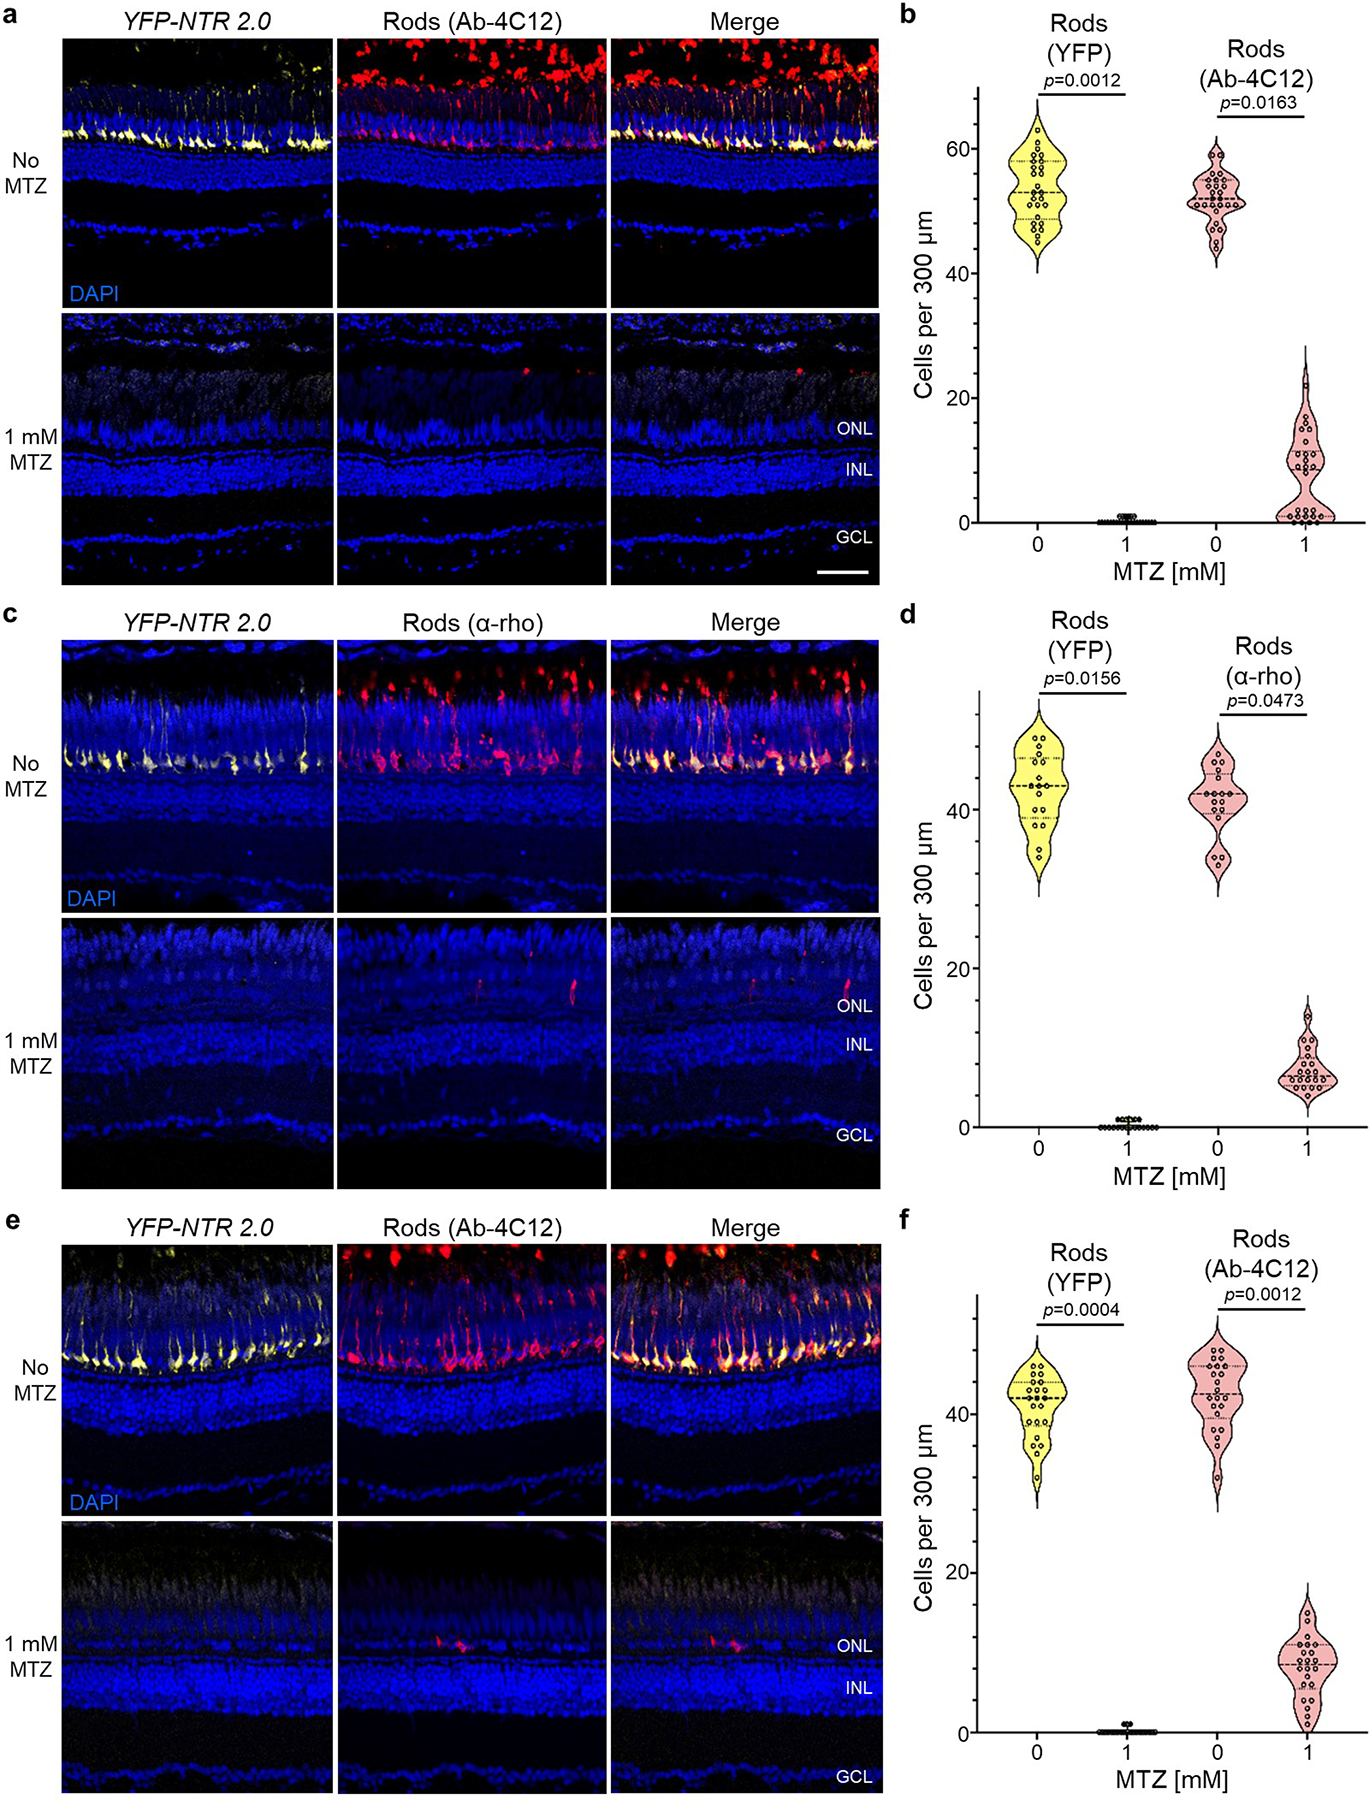
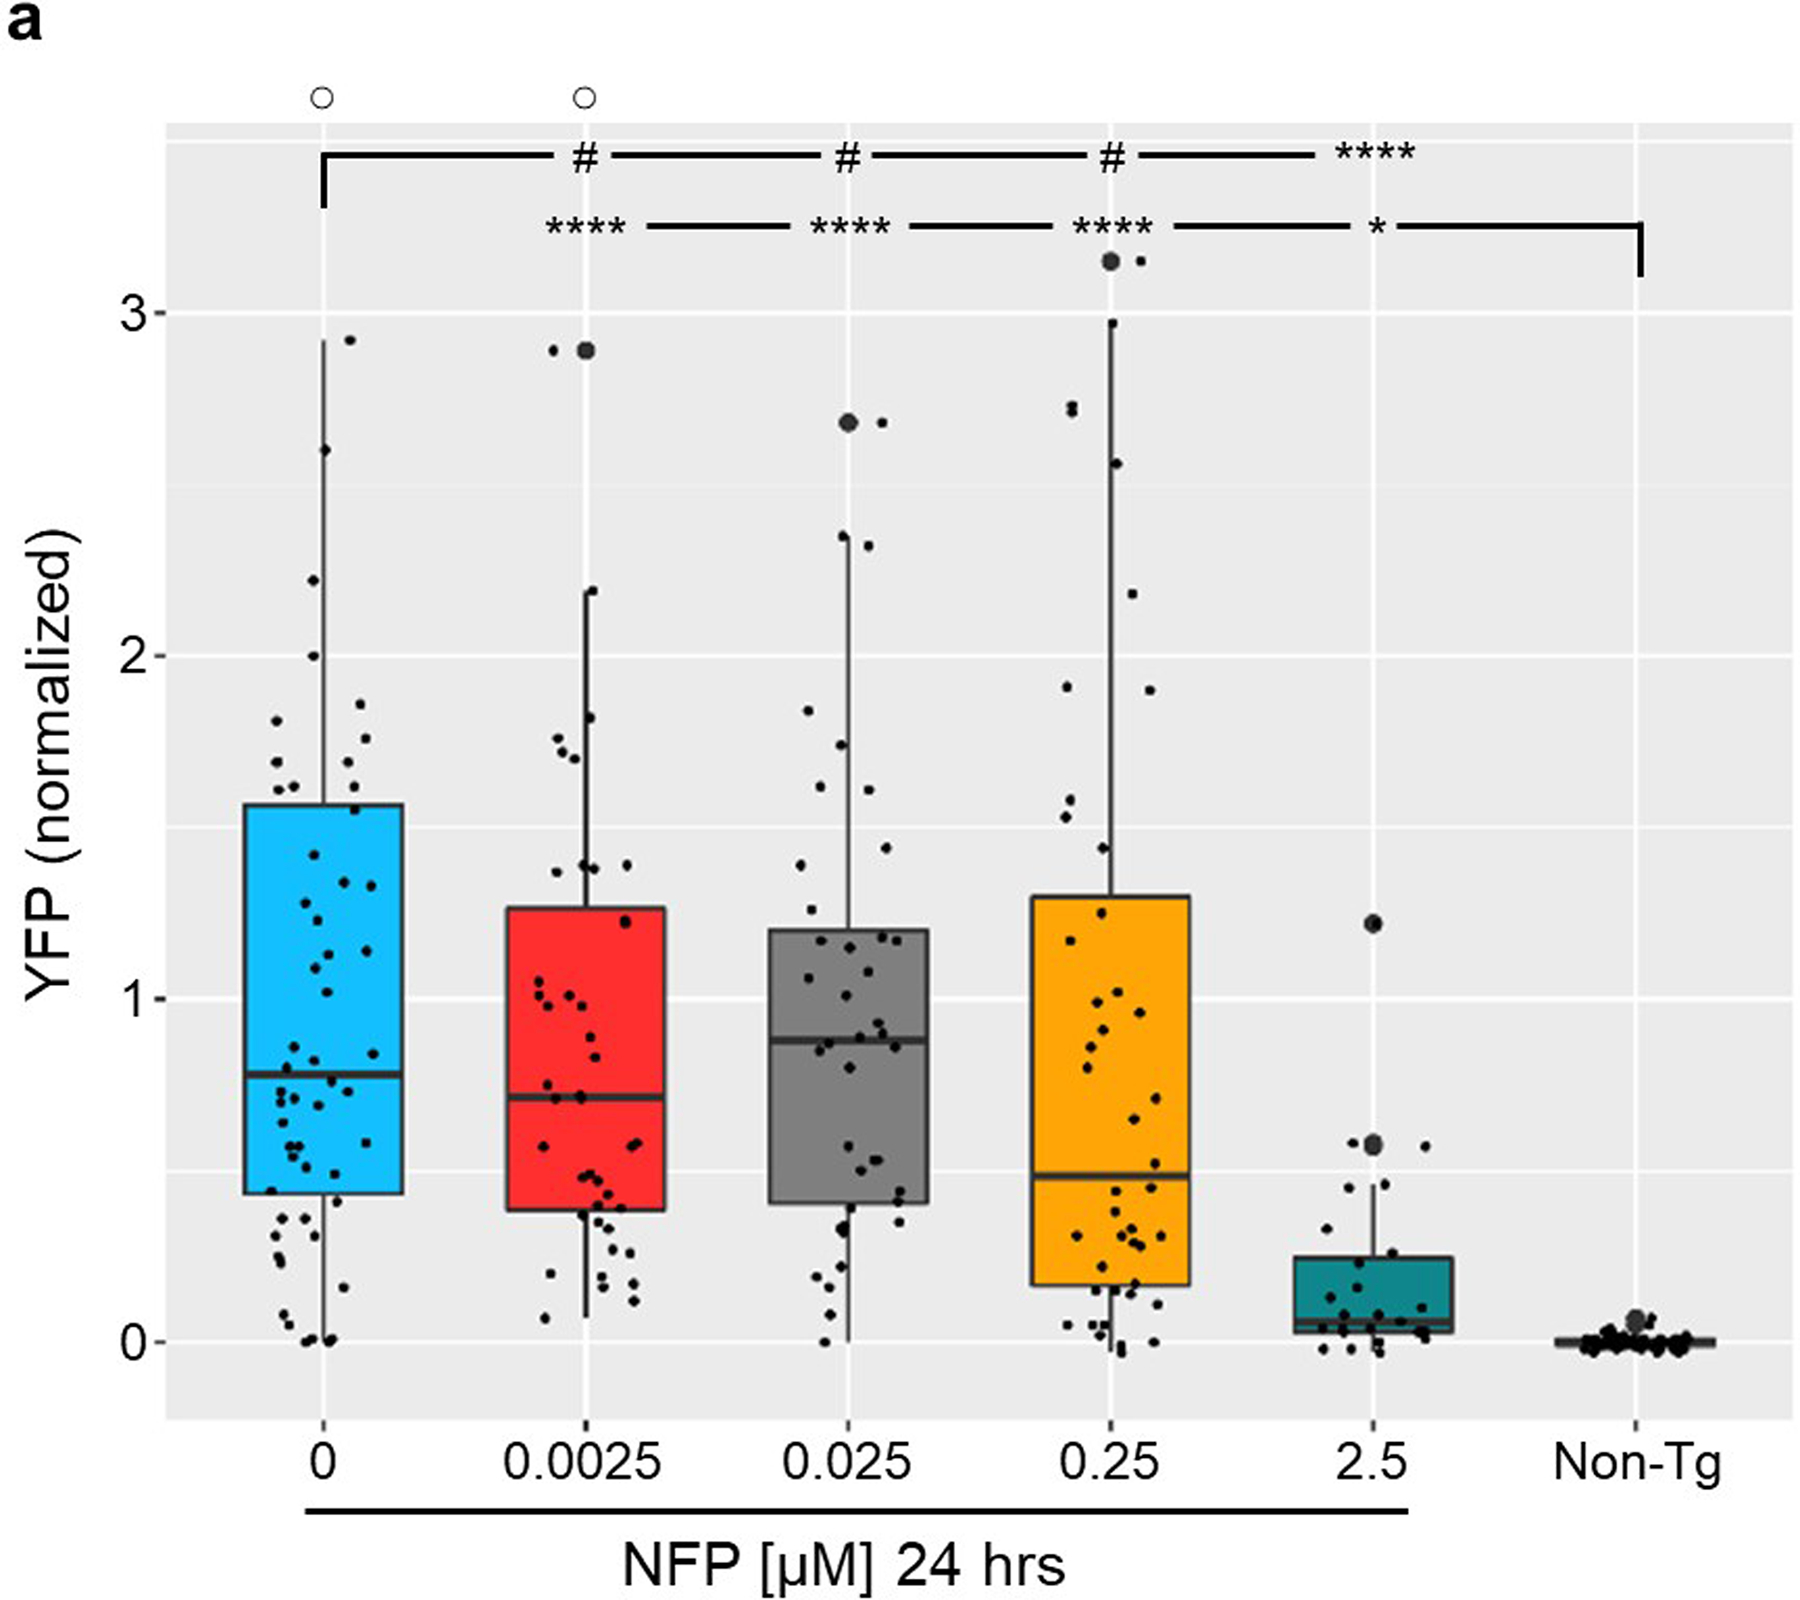
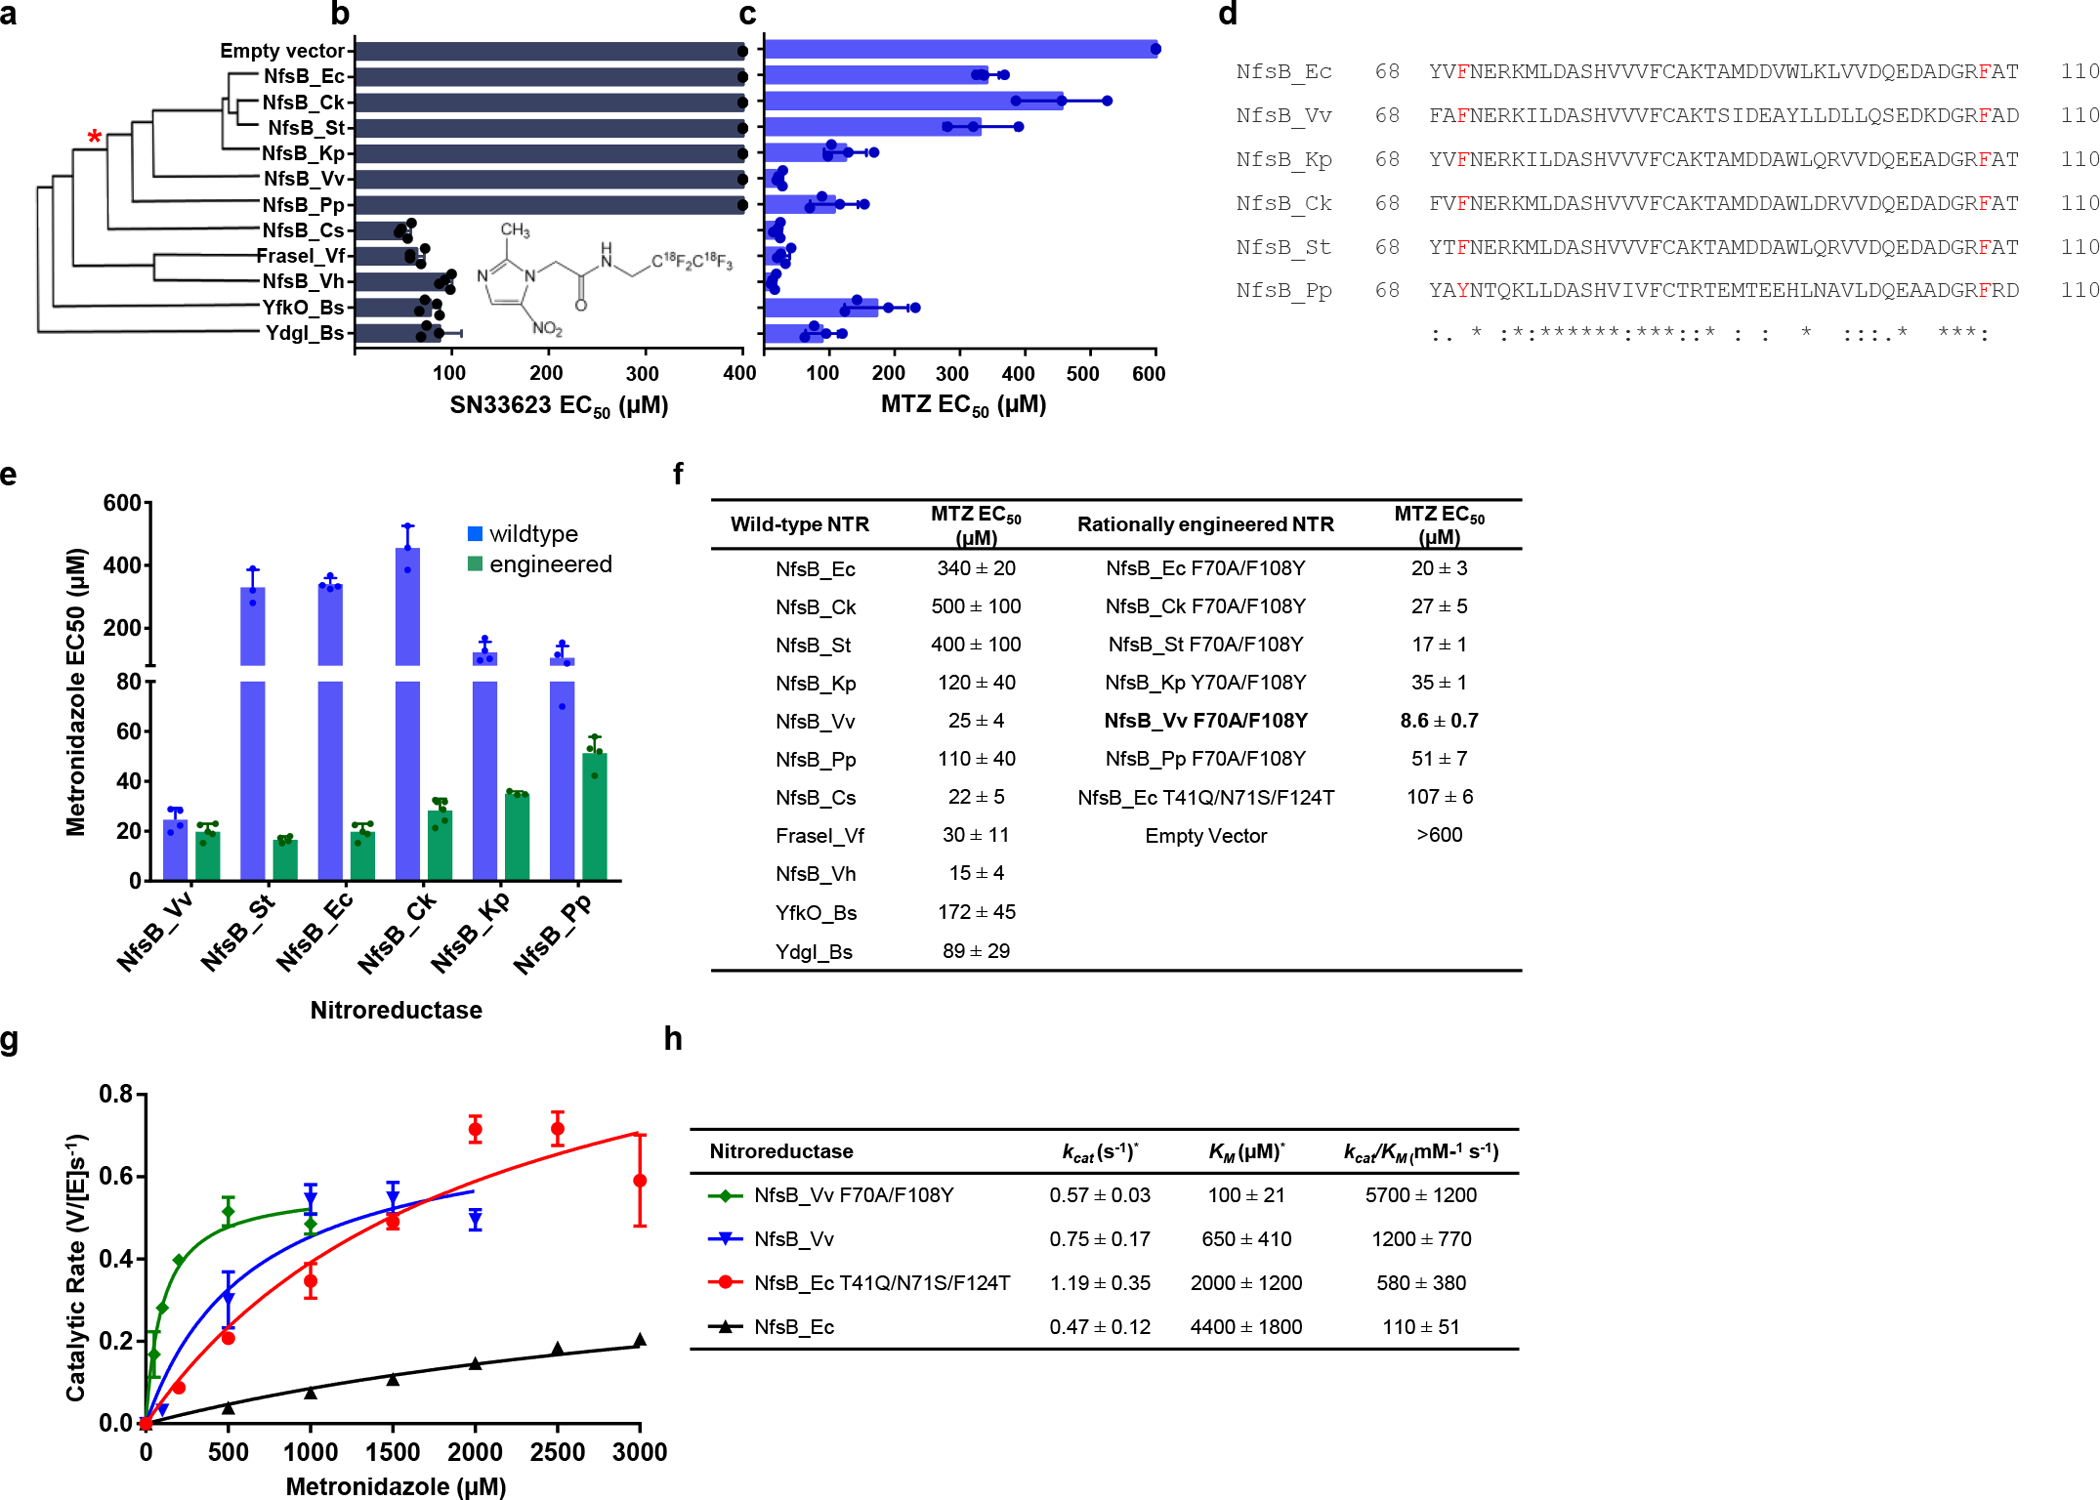
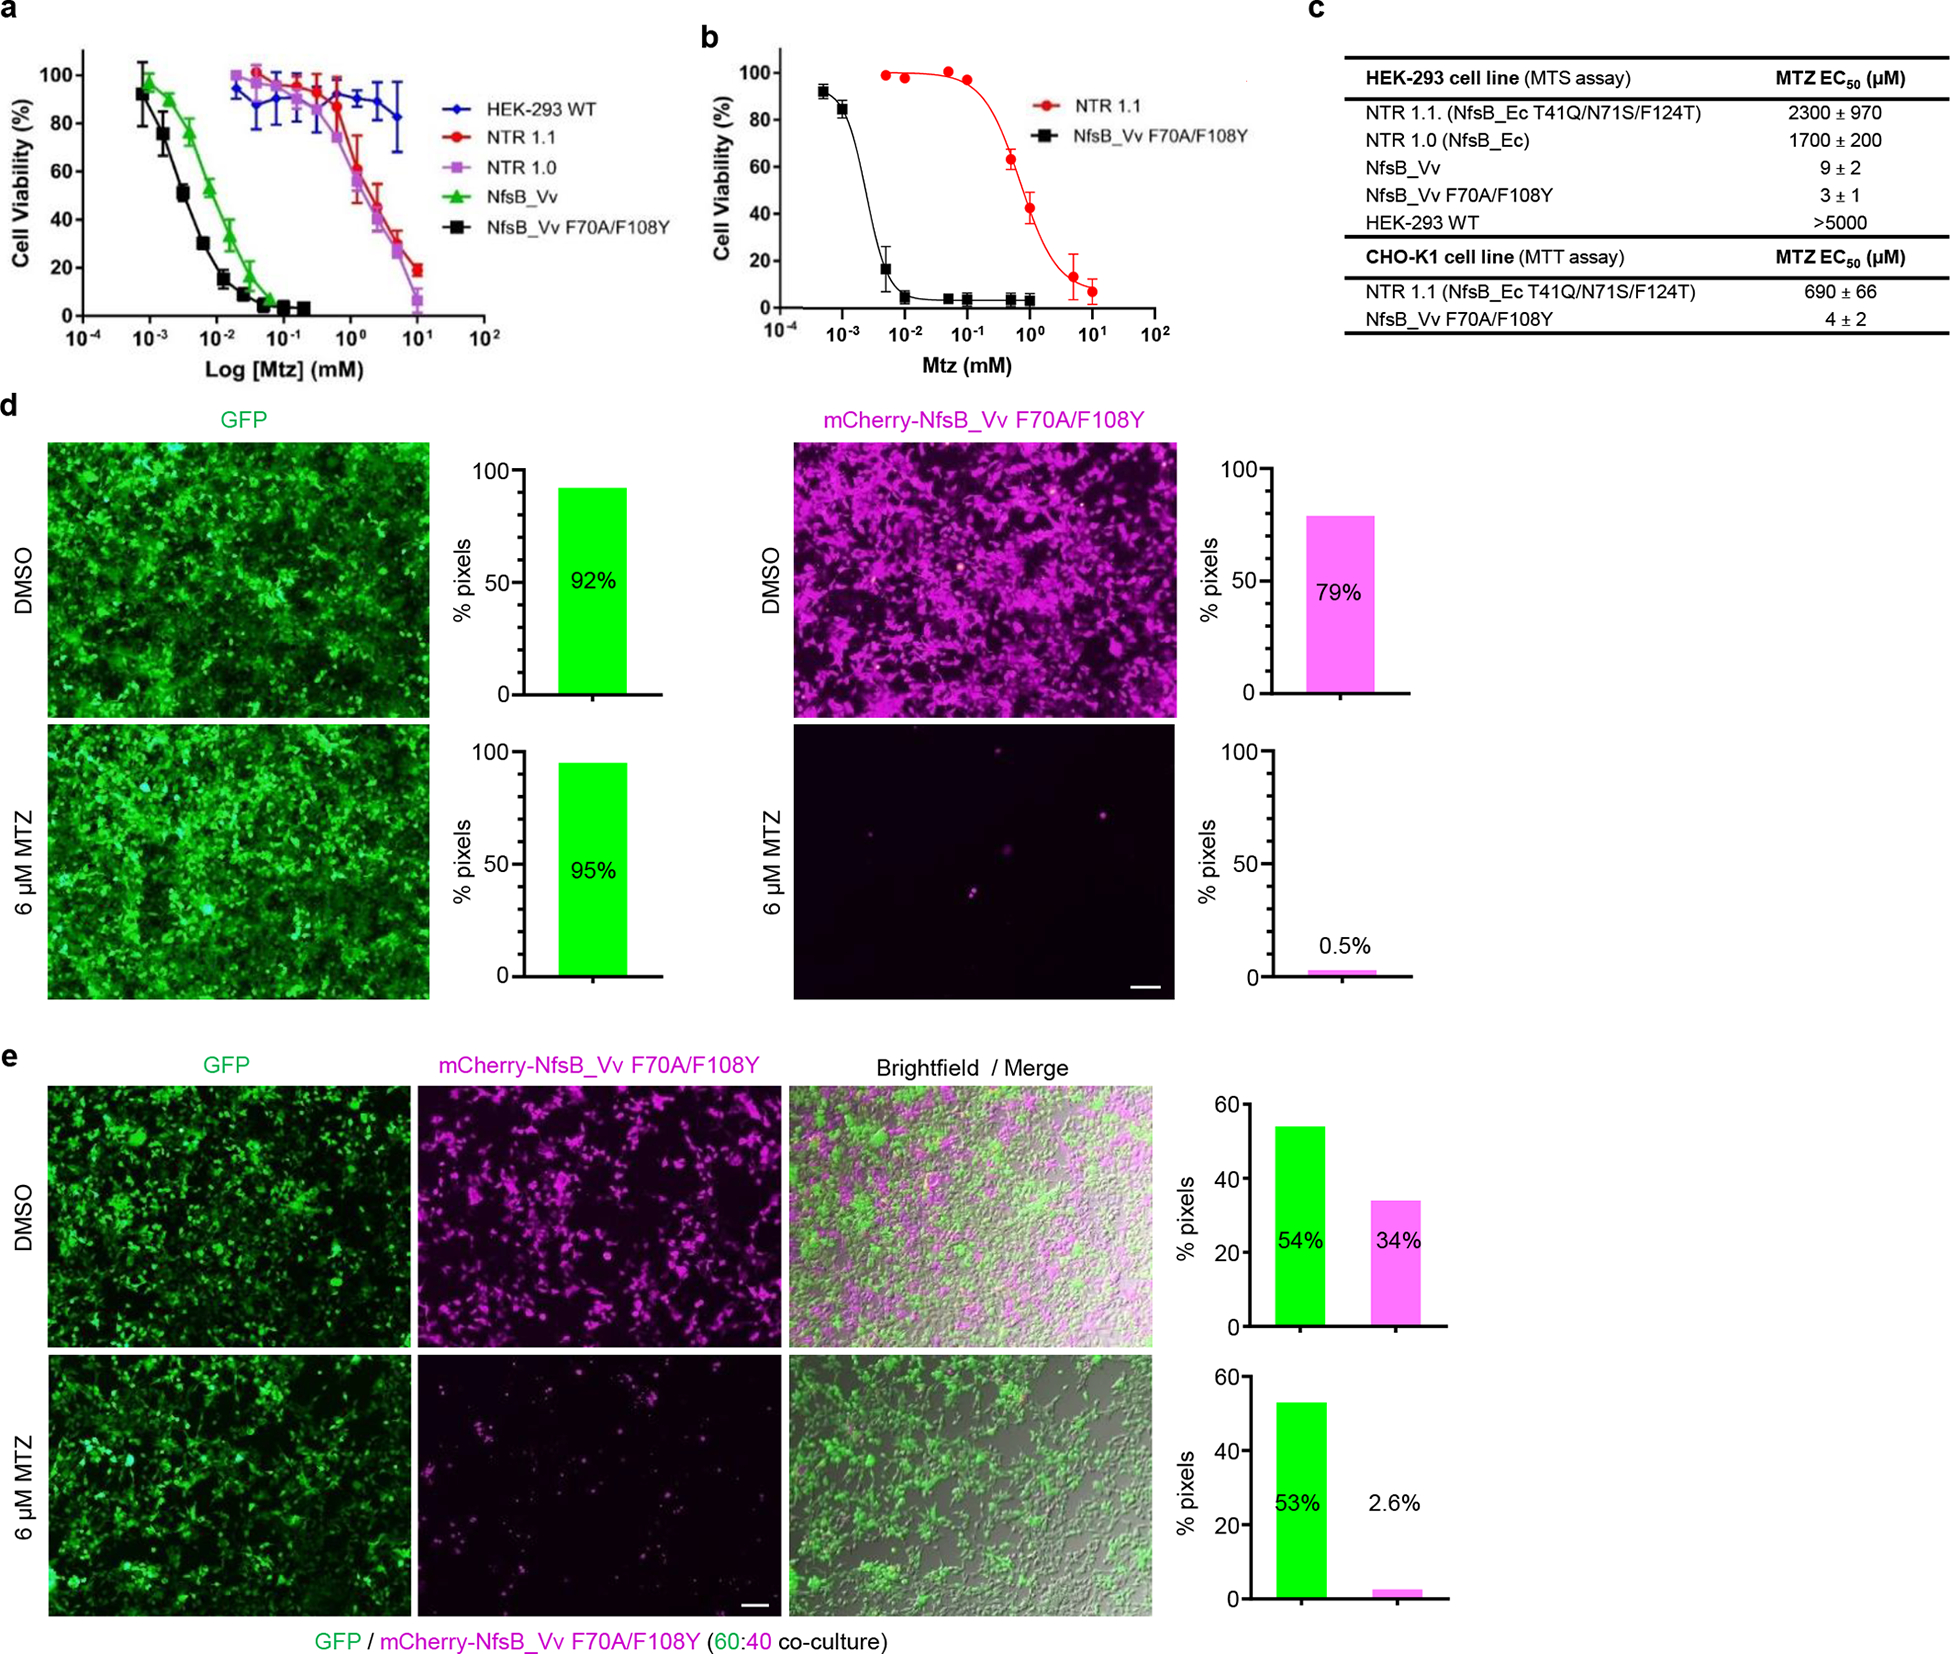
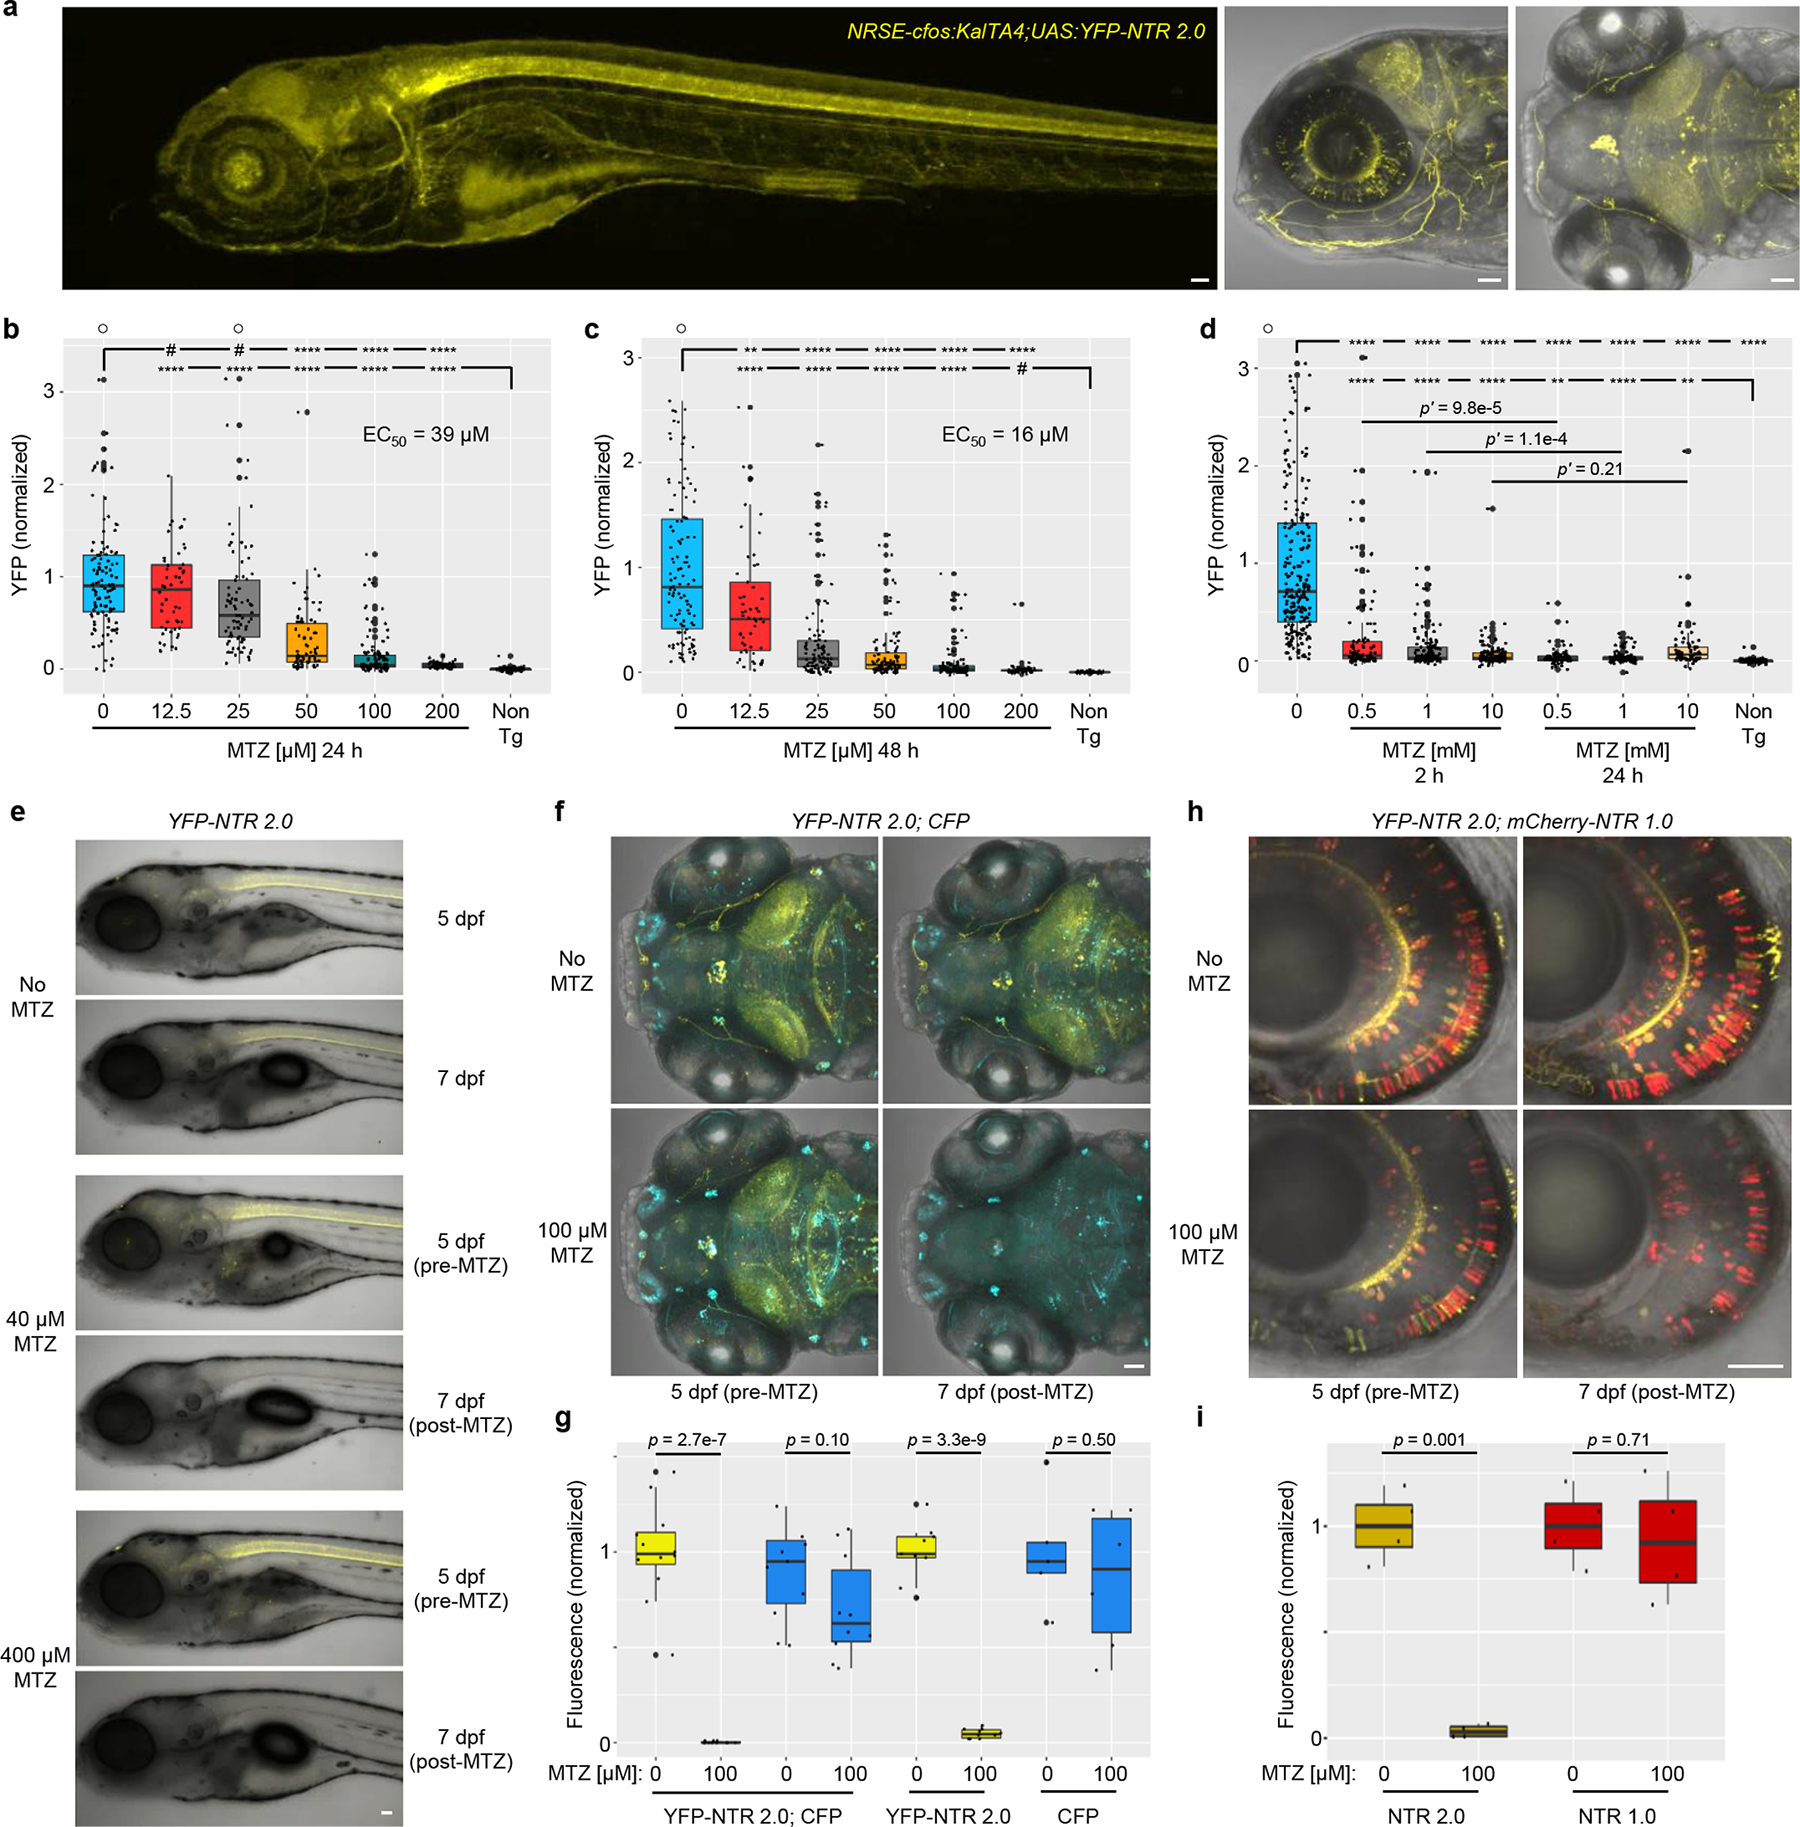
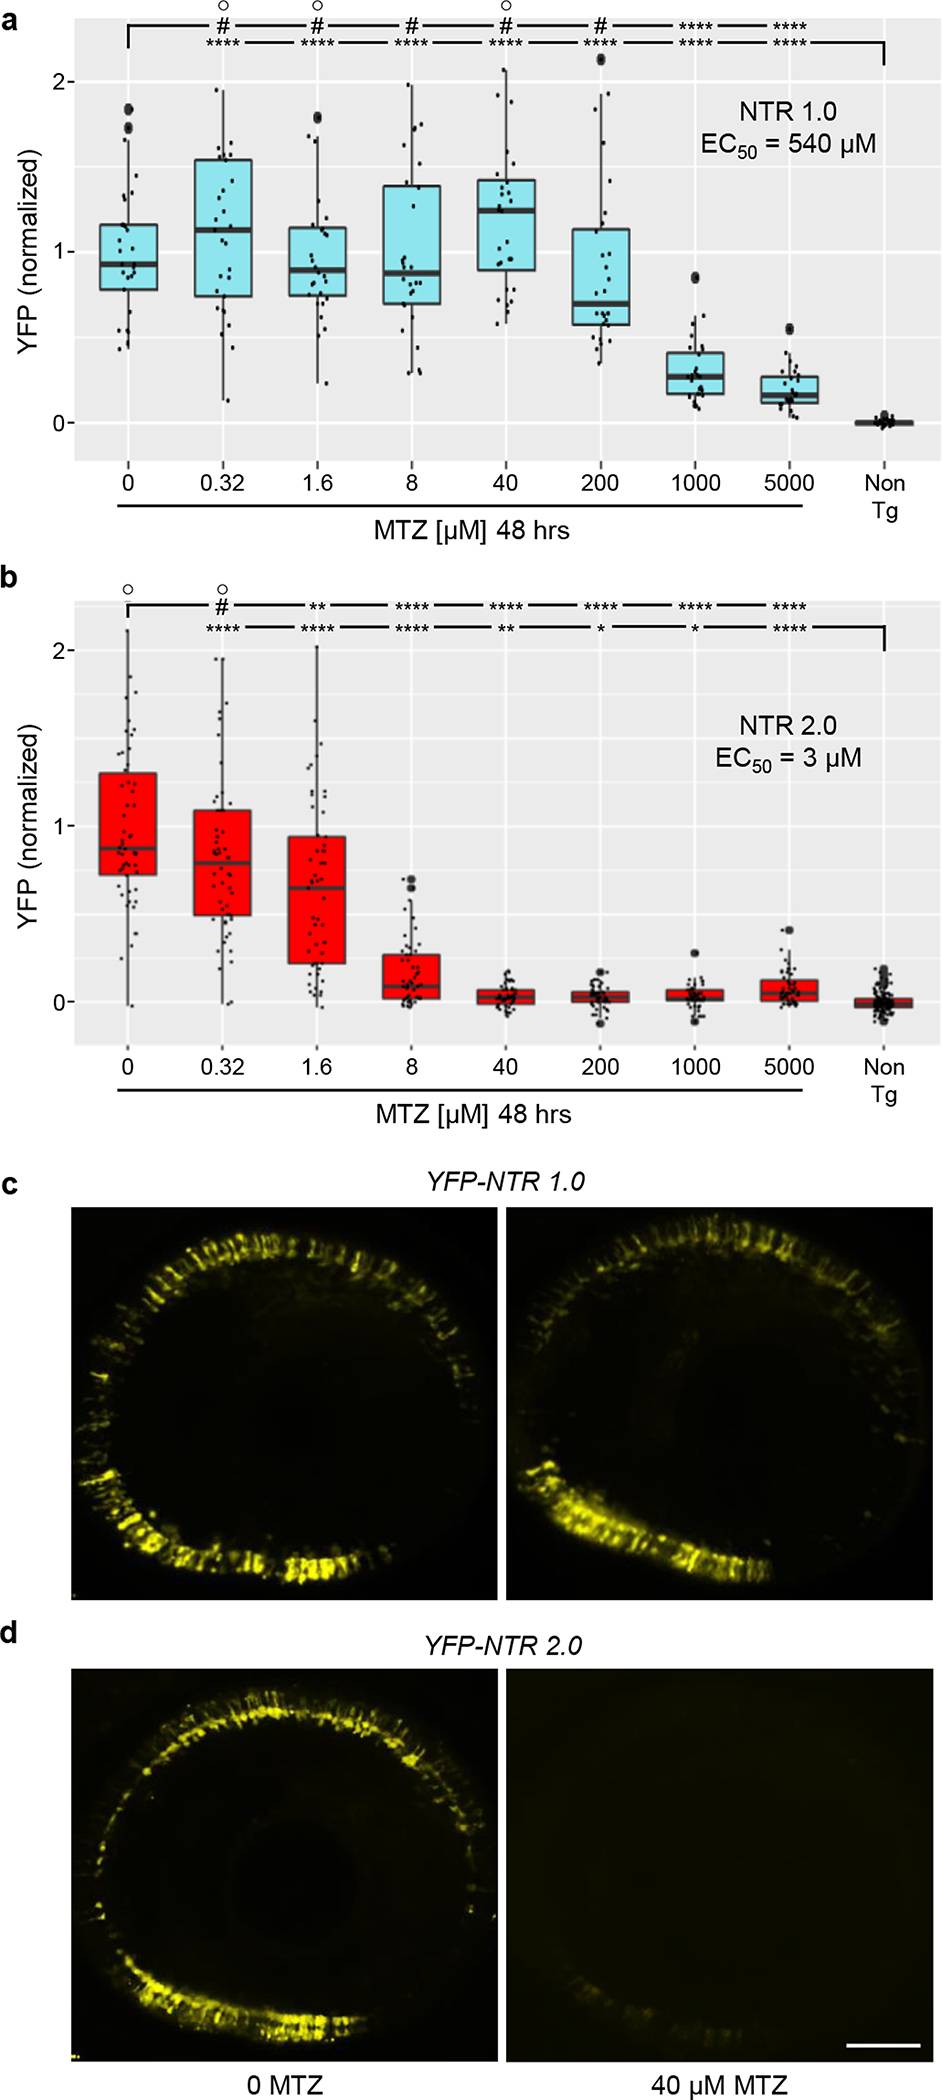
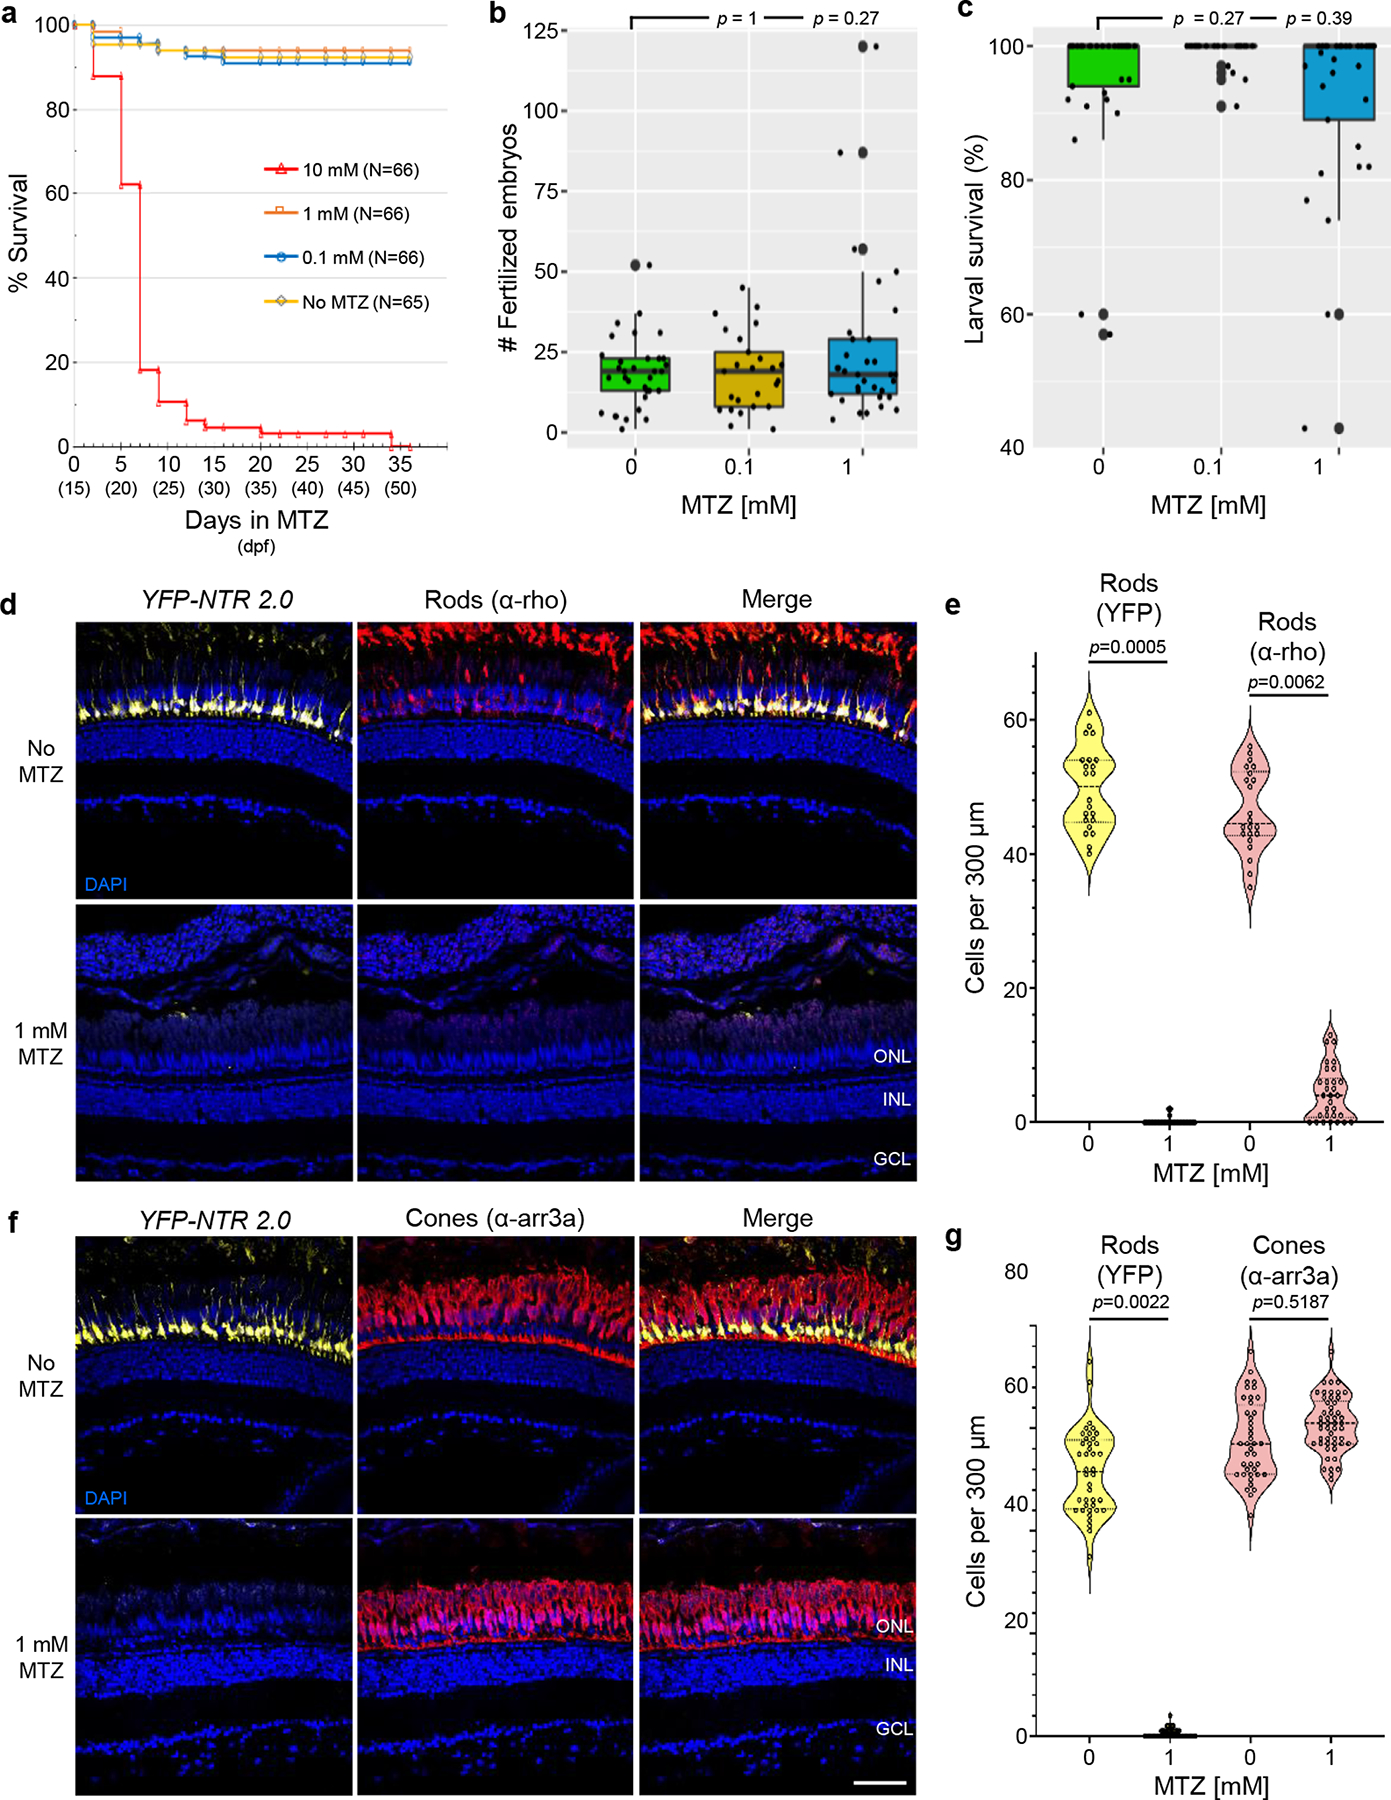
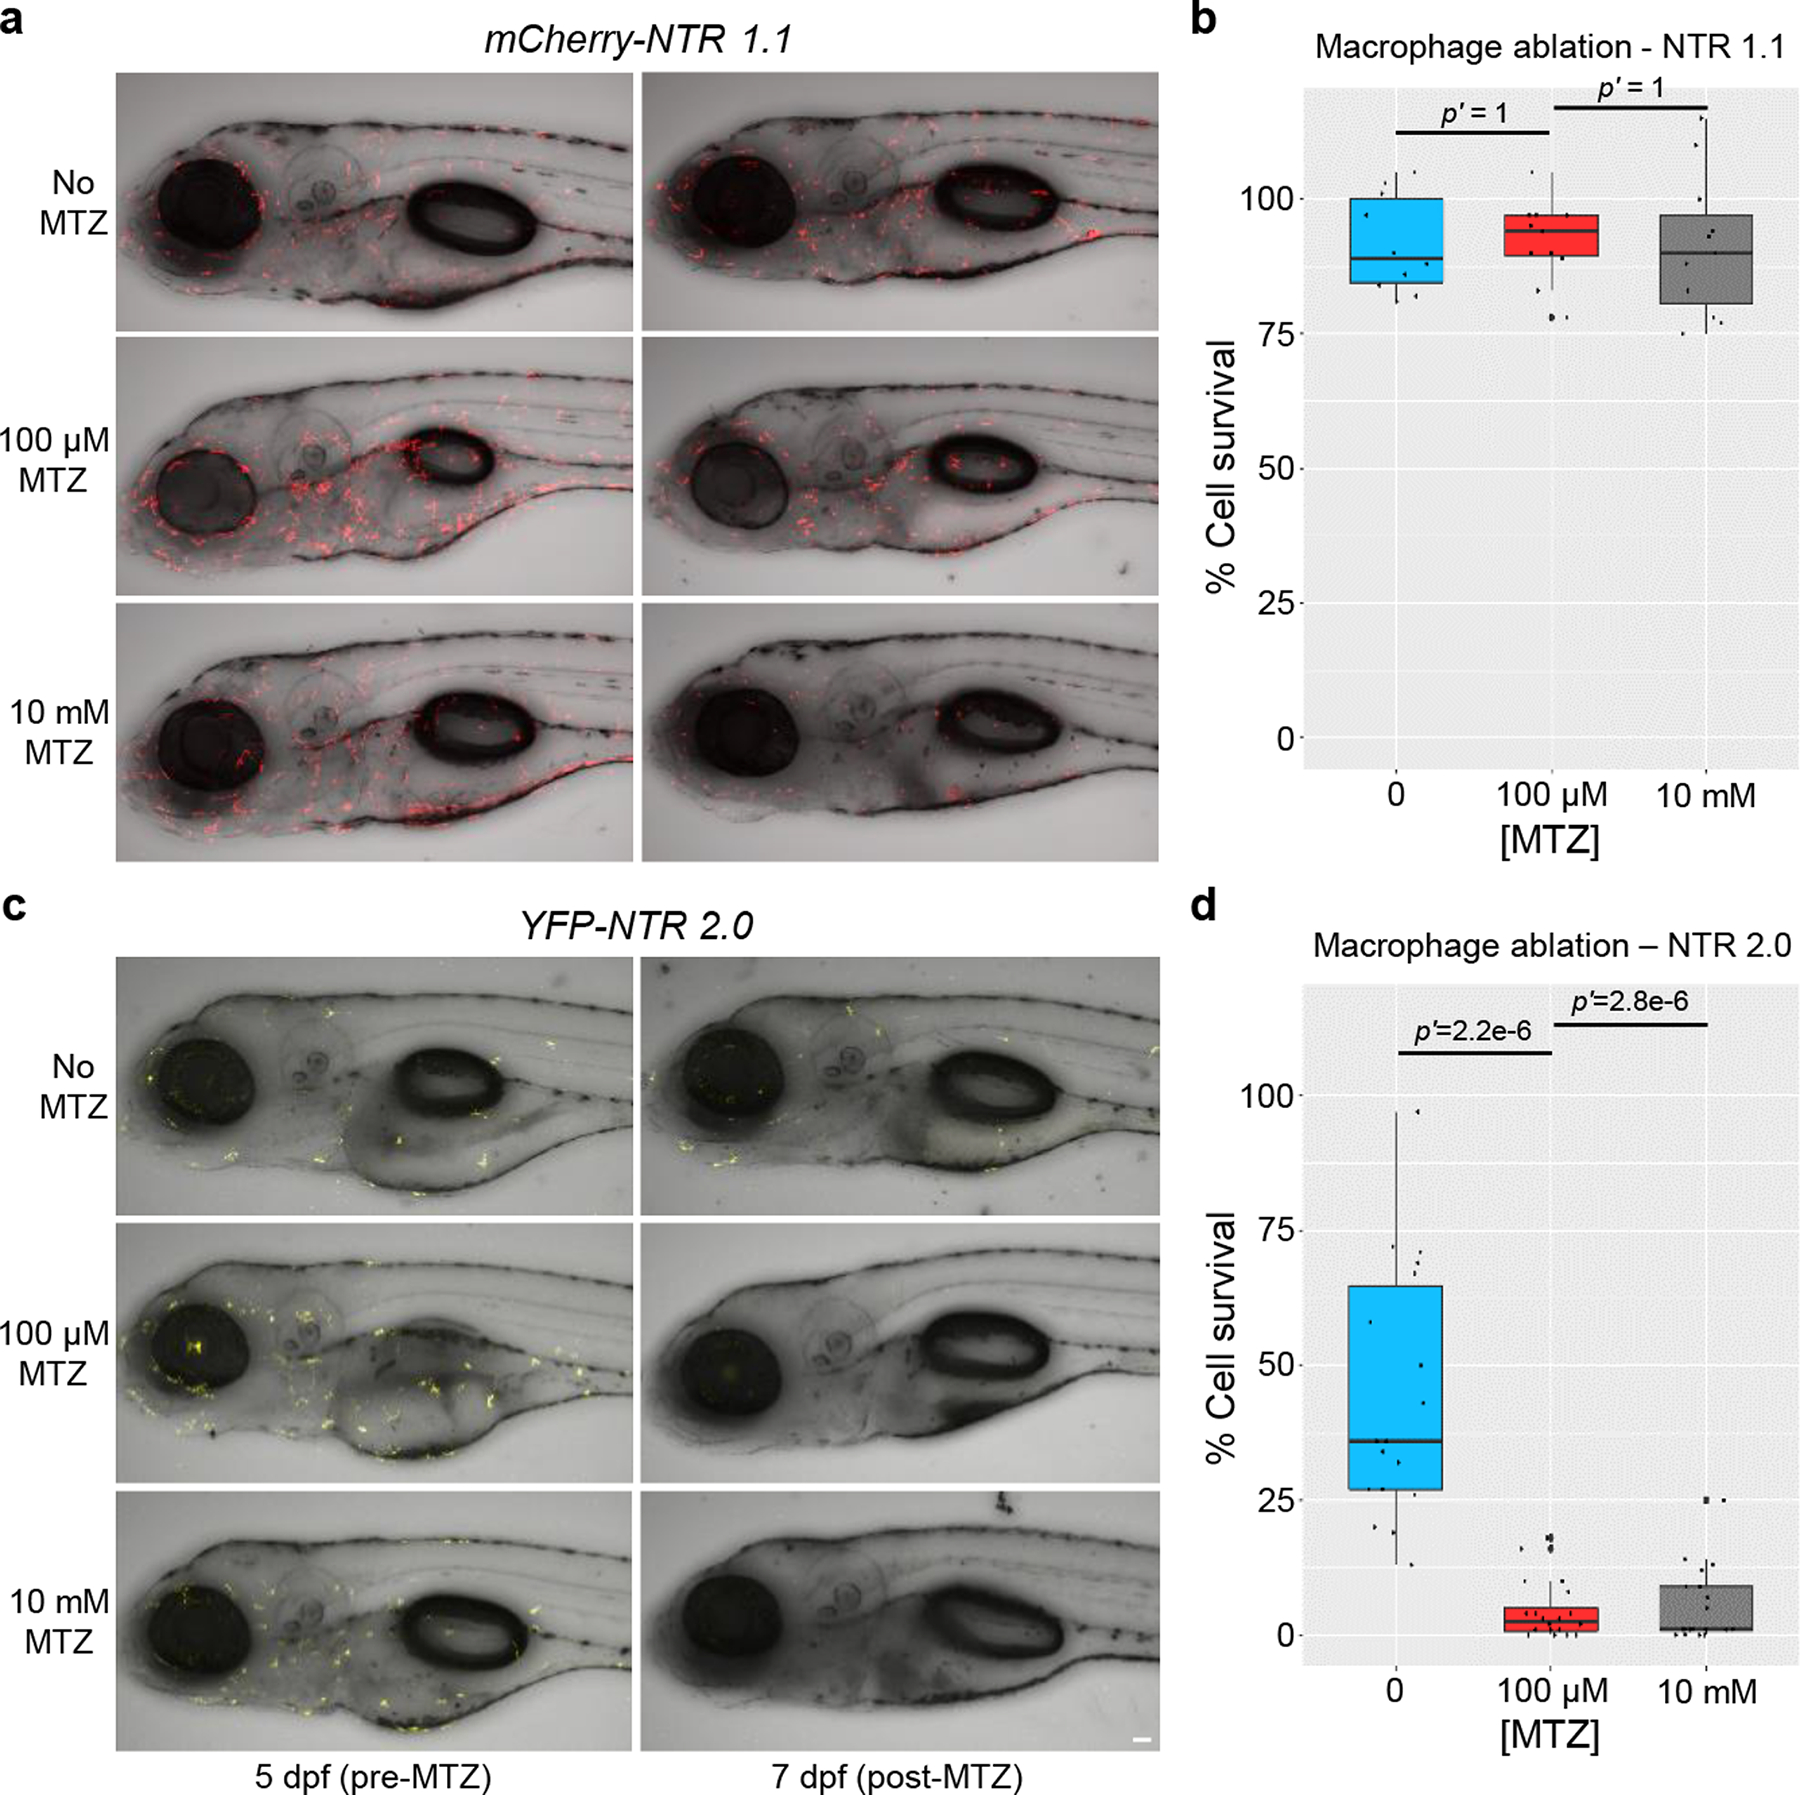
Transgenic expression of bacterial nitroreductase (NTR) enzymes sensitizes eukaryotic cells to prodrugs such as metronidazole (MTZ), enabling selective cell-ablation paradigms that have expanded studies of cell function and regeneration in vertebrates. However, first-generation NTRs required confoundingly toxic prodrug treatments to achieve effective cell ablation, and some cell types have proven resistant. Here we used rational engineering and cross-species screening to develop an NTR variant, NTR 2.0, which exhibits ~100-fold improvement in MTZ-mediated cell-specific ablation efficacy, eliminating the need for near-toxic prodrug treatment regimens. NTR 2.0 therefore enables sustained cell-loss paradigms and ablation of previously resistant cell types. These properties permit enhanced interrogations of cell function, extended challenges to the regenerative capacities of discrete stem cell niches, and novel modeling of chronic degenerative diseases. Accordingly, we have created a series of bipartite transgenic reporter/effector resources to facilitate dissemination of NTR 2.0 to the research community.


Conflict of interest statement

Competing Interests Statement

J.S.M. has been awarded patents for the creation (US patent #7,514,595) and use of zebrafish expressing nitroreductase enzymes for gene (US patent #8,071,838) and drug discovery (US patent #8,431,768) applications. M.T.S. is the President and Scientific Director at Luminomics, a biotechnology start-up that offers ARQiv-based screening services. M.T.S. owns stock in Luminomics and J.S.M. serves as a consultant at Luminomics. The remaining authors declare no competing interests.

Figures

Extended Data Fig. 1
Extended Data Fig. 1. NfsB_Vv_F70A/F108Y-expressing cells post-MTZ treatment
Merged GFP (green), mCherry (magenta), and brightfield image of the MTZ-treated 60:40 co-culture shown in Fig. 2, n=3 biologically independent experiments. Zoomed brightfield and mCherry images of the boxed region show the remaining mCherry fluorescence corresponds to small, round, phase-bright material suggestive of dead or dying cells adhering to healthy GFP-expressing cells. Scale bar = 100 microns.
Extended Data Fig. 2
Extended Data Fig. 2. NTR 2.0/MTZ-induced targeted cell ablation in larval zebrafish
a-d, Transgenic zebrafish larvae co-expressing YFP and NTR 2.0 in rod photoreceptors were treated ±400 μM MTZ for 24 h (5–6 dpf). Retinas were then fixed at 7 dpf, sectioned and labeled with the nuclear stain DAPI (blue cells) and an α-rhodopsin antibody (α-rho, aka 1D1) specific to rods (red cells, a), or an α-arrestin 3a antibody (α-arr3a, aka zpr-1) specific to cones (red cells, c). Representative confocal images of YFP and antibody labeling show effective ablation of NTR 2.0-expressing rod photoreceptors (a, n=10 retinas imaged per condition) and maintenance of neighboring cone photoreceptors (c, n=15 and 14 retinas imaged for the 0 and 400 μM MTZ conditions, respectively). Manual quantification of cell numbers confirmed MTZ-induced loss of rod cells (b) and maintenance of neighboring cones (d). Violin plots show first quartiles (25th percentile), medians, third quartiles (75th percentile), and the full distribution of the data, with individual data points (number of measurements per condition) overlaid as a dot plot. A two-tailed nested t test (GraphPad, Prism 9) was used to calculate p-values comparing MTZ-treated and control larvae. Abbreviations: ONL, outer nuclear layer; INL, inner nuclear layer; GCL, ganglion cell layer. Scale bar = 50 microns.
Extended Data Fig. 3
Extended Data Fig. 3. NTR 2.0/MTZ-induced rod cell ablation in adult zebrafish
a-f, Transgenic adult zebrafish larvae co-expressing YFP and NTR 2.0 in rod photoreceptors were treated ±1 mM MTZ for 3 (a,b) or 7 days (c-f). Retinas were then fixed, sectioned and labeled with the nuclear stain DAPI (blue cells) and antibodies specific to rods, 4C12 (a and e) or α-rho (c). Representative confocal images of YFP (yellow cells) and antibody labeling (red cells) show effective MTZ-induced ablation of NTR 2.0/YFP-expressing rod photoreceptors and concomitant loss of rod-specific antibody labeling (a, c, and e, n=2 retinas imaged per condition). Manual quantification of cell numbers confirmed MTZ-induced loss of rod cells (b, d, and f. Violin plots show first quartiles (25th percentile), medians, third quartiles (75th percentile), and the full distribution of the data, with individual data points (number of measurements per condition) overlaid as a dot plot). A two-tailed nested t test (GraphPad, Prism 9) was used to calculate p-values comparing MTZ-treated and control larvae. Abbreviations: ONL, outer nuclear layer; INL, inner nuclear layer; GCL, ganglion cell layer. Scale bar = 50 microns.
Extended Data Fig. 4
Extended Data Fig. 4. NTR 2.0 does not enhance ablation efficacy with the prodrug nifurpirinol
a, Transgenic zebrafish larvae co-expressing YFP and NTR 2.0 in neurons (NRSE:KalTA4;UAS:YFP-NTR2.0) were exposed to the indicated concentrations of NFP for 24 h (5– 6 dpf) and YFP levels were quantified by plate reader at 7 dpf (n=3 biologically independent experiments, dot plots show the number of larvae examined). Box plots show first quartiles (25th percentile), medians, third quartiles (75th percentile), and whiskers = SD, with individual data points (larvae) overlaid as a dot plot. Fully detailed statistical comparisons (absolute effect sizes, 95% confidence intervals, Bonferroni-corrected p’-values derived from two-tailed t tests, and sample sizes) between NFP-treated and control conditions in graphs b and d are provided in Supp. Table 5.Symbols: #p’ > 0.05, *p’ ≤ 0.05, ****p’ ≤ 0.0001; ○ = outlier data points.
Fig. 1:
Fig. 1:. Rationally engineered NfsB-family NTRs for improved activation of MTZ.
a, Amino acid sequence identity cladogram of eleven NfsB orthologs, grouped according to percent shared amino acid identity with NfsB_Ec. The asterisk (*) marks where other NTR variants diverge from NfsB_Ec-like enzymes. b, E. coli host sensitivity conferred by NfsB variants to the compound SN33623, n=3 biologically independent experiments for all strains except those expressing NfsB_Pp, NfsB_Cs, FraseI_Vf, NfsB_Vh, YfkO_Bs and YdgI_Bs (n=4). c, E. coli host sensitivity conferred by NfsB variants to the compound MTZ, n=4 biologically independent experiments for all strains except those expressing NfsB_Ck and NfsB_St (n=3). b-c, Data are means ± SD, data without error bars indicate host cell sensitivity could not be observed within the tested concentration range. Insets: chemical structures of SN33623 and MTZ. d, Identification of ‘SN33623-blocking’ residues in NfsB_Ec-like NTRs. Partial protein alignment of NfsB_Ec and NfsB_Ec-like enzymes (residues 68 – 110) with ‘SN33623 blocking’ residues highlighted in red. Identical (*), conservative (:), and semi-conservative (.) amino acid differences are indicated. e, E. coli host sensitivity to MTZ conferred by wild-type or rationally engineered NfsB-like enzymes, n=4 biologically independent experiments for all strains except those expressing NfsB_Ck, NfsB_St, and NfsB_Kp Y70A/F108Y (n=3), NfsB_Ec F70A/F108Y (n=5), and NfsB_Ck F70A/F108Y (n=8). Data are means ± SD. f, Summary of MTZ EC50 values for E. coli strains expressing wild-type or rationally engineered NTRs. g, Michaelis-Menten reaction curves of purified NTR variants with MTZ. The indicated NTR enzymes were purified and assayed for MTZ conversion activity across a concentration range spanning from ca. 0.2× to 5× the KM for each variant, n=3 biologically independent experiments. Data presented are means ± SD. h, Michaelis-Menten kinetic parameters for the reduction of MTZ by purified His6-tagged NTRs, monitored at 340 nm, n=3 biologically independent experiments. Data are means ± SD. KM and kcat values were derived using GraphPad Prism 8.0. The asterisk (*) indicates that these are apparent kinetic parameters as measured at 100 μM NADPH.
Fig. 2:
Fig. 2:. Targeted ablation of mammalian cells is enhanced with NsfB_Vv F70A/F108Y.
a-b, MTZ dose-response cell viability assays of NTR variants in mammalian cells tested across the indicated MTZ concentrations. a, NTR variants stably expressed in HEK-293, n=5 biologically independent experiments for all cell lines other than wild-type HEK-293 cells (n=4) and those expressing NsfB_Vv F70A/F108Y (n=3) or NfsB_Vv (n=9). b, NTR variants stably expressed in CHO-K1 cells, n=3 biologically independent experiments. Survival rates were measured using MTS (a) or MTT (b) assays and data presented are means ± SD. c, MTZ EC50 values for mammalian HEK-293 and CHO-K1 cell lines stably over-expressing the indicated NTR enzyme variants. Data presented are means ± SD. d-e, Images and quantification of MTZ-induced ablation of transgenic HEK-293 cell lines. Cells expressing GFP or co-expressing mCherry and NfsB_Vv F70A/F108Y were cultured in isolation (d), or as a 60:40 co-culture of both cell lines (e). All cells were treated with 0.01% DMSO or 6 μM MTZ for 48 h and cell viability was assessed qualitatively by fluorescence microscopy and quantitatively by pixel counts (fluorescent pixels/total pixels), n=3 biologically independent experiments per condition. Merged brightfield and fluorescence images (e) confirm loss of NfsB_Vv F70A/F108Y expressing cells as opposed to loss of reporter expression. Scale bars = 100 microns.
Fig. 3:
Fig. 3:. NTR 2.0 enhances cell ablation efficacy in zebrafish.
a, Confocal images of 5 dpf NRSE:KalTA4;UAS:YFP-NTR2.0 larvae showing neuronally-restricted YFP expression (co-expressed with NTR 2.0), n=4 biologically independent experiments, 24 larvae examined. b-d, Dose-response tests of MTZ ablation efficacy. 5 dpf NRSE:KalTA4;UAS:YFP-NTR2.0 larvae were exposed to MTZ for 24 h (b), 48 h (c), or either 2 or 24 h (d). Fully detailed statistical comparisons (absolute effect sizes, 95% confidence intervals, Bonferroni-corrected p’-values derived from two-tailed t tests, sample sizes, and the number of biologically independent experiments) between MTZ-treated and control conditions in graphs b-d are provided in Supp. Table 1. e, Representative time series images showing changes in YFP fluorescence in NRSE:KalTA4;UAS:YFP-NTR2.0 larvae treated with 0, 40, or 400 μM MTZ from 5–6 dpf, n=2 biologically independent experiments, 16 larvae imaged per condition. f-g, Test of NTR 2.0 ablation specificity. f, Representative time-series images showing changes in YFP and CFP fluorescence in in NRSE:KalTA4;UAS:YFP-NTR2.0;UAS:CFP larvae treated with 100 μM MTZ from 5–6 dpf, n=4 biologically independent experiments, 24 larvae imaged per condition. g, Imaris-based quantification of changes in YFP and CFP fluorescence in control and MTZ-treated larvae, n=4 biologically independent experiments, dot plots show the number of larvae examined. h-i, Ablation efficacy comparison of NTR 1.0 and NTR 2.0. h, Representative time-series images shows changes in YFP and mCherry fluorescence in nyx:KalTA4; UAS:YFP-NTR2.0;UAS:NTR 1.0-mCherry larvae treated with 100 μM MTZ from 5–6 dpf changes, n=2 biologically independent experiments, 16 larvae imaged per condition. i, Imaris-based quantification of changes in YFP and mCherry fluorescence in control and MTZ-treated larvae, n=2 biologically independent experiments, dot plots show the number of images examined. A two-tailed t test was used to calculate p-values comparing MTZ-treated larvae to corresponding controls per genotype in g and i. All box plots show first quartiles (25th percentile), medians, third quartiles (75th percentile), and whiskers = SD, with individual data points (larvae or images) overlaid as a dot plot. Symbols: #p’ > 0.05, *p’ ≤ 0.05, **p’ ≤ 0.01, ***p’ ≤ 0.001, ****p’ ≤0.0001 ○ = outlier data points. Scale bars = 50 microns.
Fig. 4:
Fig. 4:. Dose-response test of cell ablation efficacy – NTR 1.0 versus NTR 2.0.
a-b, Transgenic larvae co-expressing either NTR 1.0 and YFP (a,c; rho:YFP-NTR 1.0) or NTR 2.0 and YFP (b,d; rho:YFP NTR 2.0) in rod photoreceptors were treated with MTZ across a 5-fold dilution series (5 mM – 320 nM) for 48 h (5–7 dpf) and YFP levels quantified by plate reader assay (n=4 biologically independent experiments, dot plots show the number of larvae examined). Box plots show first quartiles (25th percentile), medians, third quartiles (75th percentile), and whiskers = SD. EC50 values suggest a 180-fold improvement in NTR 2.0-mediated ablation efficacy. Fully detailed statistical comparisons (absolute effect sizes, 95% confidence intervals, Bonferroni-corrected p’-values derived from two-tailed t tests, sample sizes, and the number of biologically independent experiments) between MTZ-treated and control conditions in graphs a-b are provided in Supp. Table 2. Symbols: #p’ > 0.05, *p’ ≤ 0.05, **p’ ≤ 0.01, ***p’ ≤ 0.001, ****p’ ≤ 0.0001; ○ = outlier data points. c-d, Representative confocal images of YFP expression at 7 dpf (post-MTZ) showing differential effects of 40 μM MTZ treatments in NTR 1.0 (c) and NTR 2.0 (d) expressing larvae, n=4 larvae imaged per condition. Scale bar = 50 microns.
Fig. 5:
Fig. 5:. Prolonged MTZ treatments are non-toxic and retain targeted ablation specificity in adults.
a, Survival of juvenile zebrafish incubated with the indicated concentration of MTZ for 36 days, from 15–51 dpf (n=66 or 65 larvae examined per condition – see inset, n=3 biologically independent experiments). Log-rank (Mantel-Cox) tests and Gehan-Breslow-Wilcoxon tests showed no statistically significant differences between No MTZ controls and 0.1 or 1 mM MTZ conditions. Comparisons between No MTZ controls and the 10 mM condition produced chi-squares of 123 and 97, respectively, and a Bonferroni corrected p’-value of <0.0001 for both tests. b-c, Test of fecundity (b) and offspring survival (c) rates of long-term MTZ exposed fish (n=3 independent mating sessions). Box plots show first quartiles (25th percentile), medians, third quartiles (75th percentile), and whiskers = SD, with individual data points (successful matings) overlaid as a dot plot. Fully detailed statistical comparisons (absolute effect sizes, 95% confidence intervals, Bonferroni-corrected p’-values derived from two-tailed t tests, and sample sizes) between MTZ-treated and control conditions in graphs b-c are provided in Supp. Table 3. d-g, Test of NTR 2.0/MTZ-induced ablation efficacy and specificity in adult zebrafish (n=2 zebrafish per condition). Transgenic rho:YFP-NTR2.0 adult zebrafish were treated ±1 mM MTZ for 3 days. Retinas were then fixed, sectioned, and labeled with the nuclear stain DAPI (blue cells) and an antibody specific to rod (α-rho, red cells, d), or cone photoreceptors (α-arr3a, red cells, f). Representative confocal images of YFP-expressing rods (yellow cells, d and f) and antibody labeling show effective ablation of NTR 2.0-expressing rod photoreceptors (d) and maintenance of neighboring cone photoreceptors (f). Manual quantification of YFP-expressing rod cells and either α-rho stained rods (e) or α-arr3a stained cones. Violin plots show first quartiles (25th percentile), medians, third quartiles (75th percentile), and the full distribution of the data, with individual data points (number of measurements per condition) overlaid as a dot plot. A two-tailed nested t test (GraphPad, Prism 9) was used to calculate p-values comparing MTZ-treated and control larvae. Abbreviations: ONL, outer nuclear layer; INL, inner nuclear layer; GCL, ganglion cell layer. Scale bars = 50 microns.
Fig. 6:
Fig. 6:. NTR 2.0 enables ablation of “resistant” cell types.
Transgenic larvae co-expressing either mCherry and NTR 1.1 (a,b) or YFP and NTR 2.0 (c,d) in macrophages were treated with 0, 0.1, or 10 mM MTZ from 5–7 dpf, n=3 biologically independent experiments for both assays. a,c, Intravital time series imaging was performed pre-MTZ (5 dpf) and post-MTZ (7 dpf). b,d, Manual counts of macrophage numbers were performed on pre- and post-treatment images. The percent change in cell number was calculated by normalizing day 7 to day 5 image values per each fish. No change in cell number was observed in NTR 1.1 expressing fish (b) due to the persistence of small rounded cells (n=10, 11, and 11 larvae examined, for 0, 0.1, and 10 mM MTZ conditions, respectively). Conversely, both treatment conditions led to near complete ablation of NTR 2.0-expressing macrophages (d; n=18, 20, and 19 larvae examined, for 0, 0.1, and 10 mM MTZ conditions, respectively). Fully detailed statistical comparisons (absolute effect sizes, 95% confidence intervals, Bonferroni-corrected p’-values derived from two-tailed t tests, and sample sizes) between MTZ-treated and control conditions in graphs b and d are provided in Supp. Table 4. Scale bar = 50 microns.

References

    1. Williams EM et al. Nitroreductase gene-directed enzyme prodrug therapy: insights and advances toward clinical utility. Biochem. J 471, 131–153 (2015). - PubMed
    1. Roldán MD, Pérez-Reinado E, Castillo F & Moreno-Vivián C Reduction of polynitroaromatic compounds: the bacterial nitroreductases. FEMS Microbiol. Rev 32, 474–500 (2008). - PubMed
    1. Venitt S & Crofton-Sleigh C The toxicity and mutagenicity of the anti-tumour drug 5-aziridino-2,4-dinitrobenzamide (CB1954) is greatly reduced in a nitroreductase-deficient strain of E. coli. Mutagenesis 2, 375–81 (1987). - PubMed
    1. Knox RJ et al. The nitroreductase enzyme in Walker cells that activates 5-(aziridin-1-yl)-2,4-dinitrobenzamide (CB 1954) to 5-(aziridin-1-yl)-4-hydroxylamino-2-nitrobenzamide is a form of NAD(P)H dehydrogenase (quinone) (EC 1.6.99.2). Biochem. Pharmacol 37, 4671–7 (1988). - PubMed
    1. Lewis K Platforms for antibiotic discovery. Nat. Rev. Drug Discov 12, 371–387 (2013). - PubMed

Publication types

MeSH terms