. 2022 Jun;40(6):855-861.
doi: 10.1038/s41587-021-01188-9. Epub 2022 Feb 7.

Cell types of origin of the cell-free transcriptome

Collaborators, Affiliations

Cell types of origin of the cell-free transcriptome

Sevahn K Vorperian et al. Nat Biotechnol. 2022 Jun.

Erratum in

Abstract

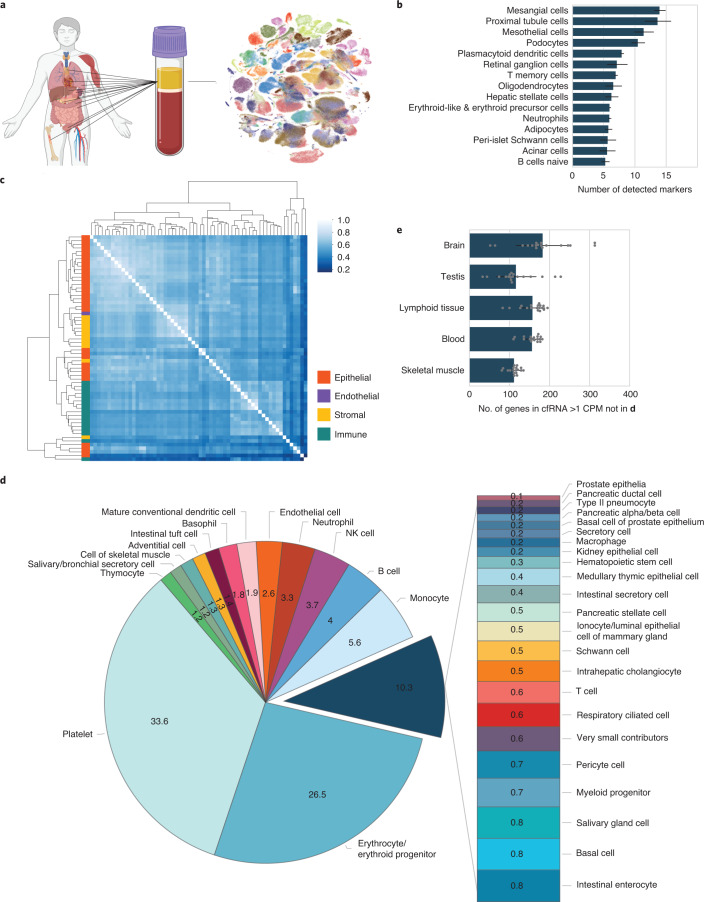
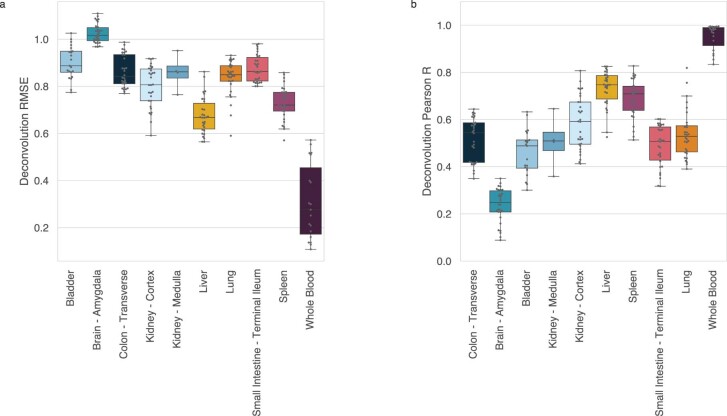
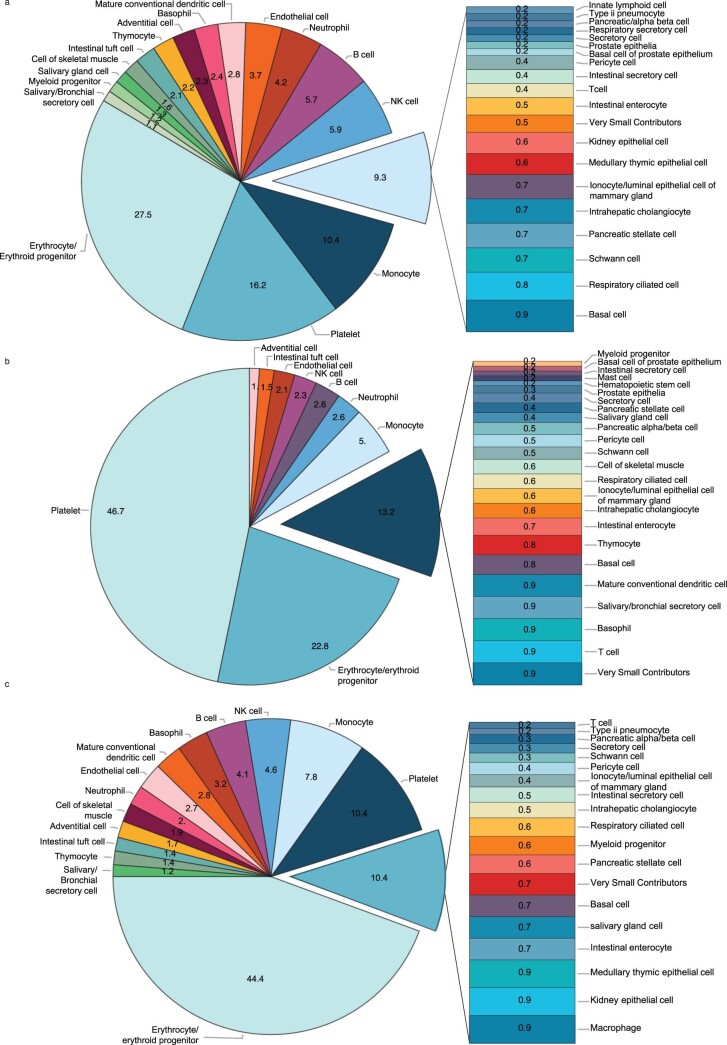
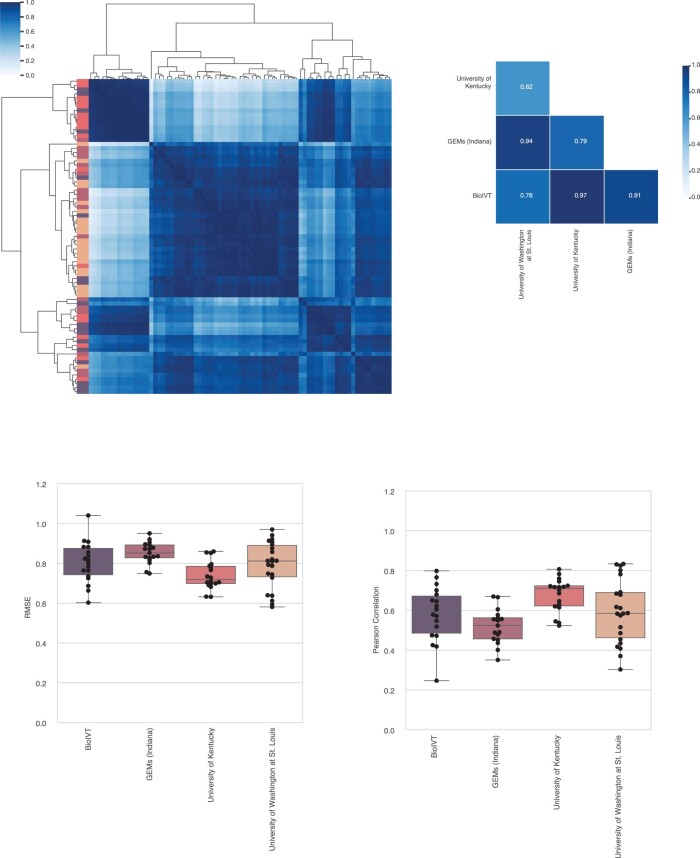
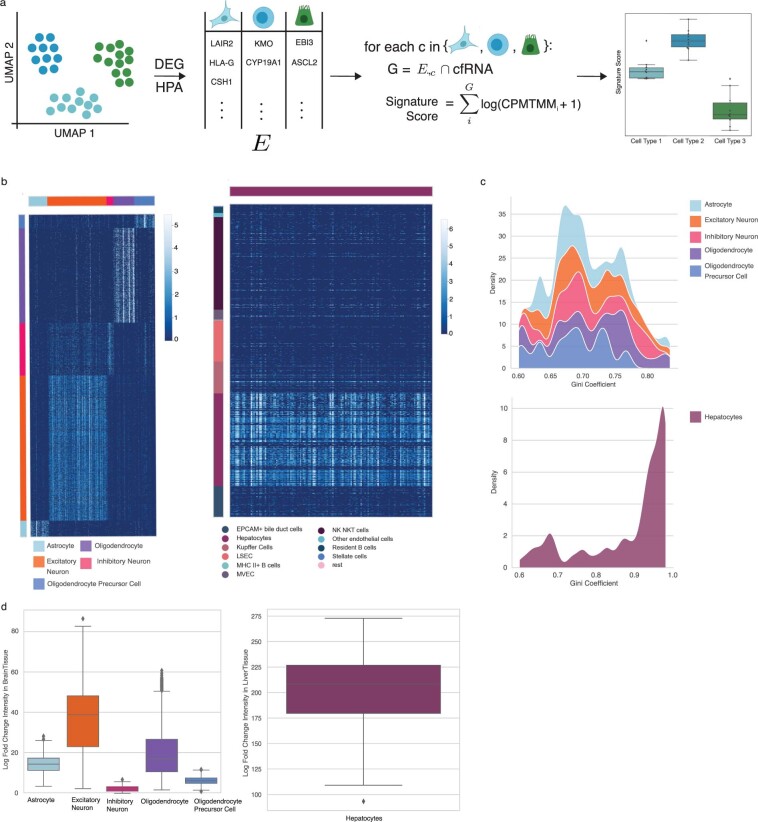
Cell-free RNA from liquid biopsies can be analyzed to determine disease tissue of origin. We extend this concept to identify cell types of origin using the Tabula Sapiens transcriptomic cell atlas as well as individual tissue transcriptomic cell atlases in combination with the Human Protein Atlas RNA consensus dataset. We define cell type signature scores, which allow the inference of cell types that contribute to cell-free RNA for a variety of diseases.


Conflict of interest statement

S.R.Q. is a founder and shareholder of Molecular Stethoscope and Mirvie. M.N.M. is also a shareholder of Mirvie. S.K.V., M.N.M. and S.R.Q. are inventors on a patent application covering the methods and compositions to detect specific cell types using cfRNA submitted by the Chan Zuckerberg Biohub and Stanford University.

Figures

Fig. 1
Fig. 1. Cell type decomposition of the plasma cell-free transcriptome using Tabula Sapiens.
a, Integration of tissue of origin and single-cell transcriptomics to identify cell types of origin in cfRNA. b, Cell-type-specific markers defined in context of the human body identified in plasma cfRNA. Error bars denote the s.d. of number of cell-type-specific markers (n = 75 patients); the measure of center is the mean. CPM-TMM counts for a given gene across technical replicates were averaged before intersection. c, Cluster heat map of Spearman correlations of the cell type basis matrix column space derived from Tabula Sapiens. Color bar denotes correlation value. d, Mean fractional contributions of cell-type-specific RNA in the plasma cell-free transcriptome (n = 18 patients). e, Top tissues in cfRNA not captured by basis matrix (the set difference of all genes detected in a given cfRNA sample and the row space of the basis matrix intersection with HPA tissue-specific genes). Error bars denote the s.d. of number of HPA tissue-specific genes with NX counts >10 and cell-free CPM expression ≥ 1 (n = 18 patients); the measure of center is the mean.
Fig. 2
Fig. 2. Cellular pathophysiology is non-invasively resolvable in cfRNA.
For a given box plot, any cell type signature score is the sum of log-transformed CPM-TMM normalized counts. The horizontal line denotes the median; the lower hinge indicates the 25th percentile; the upper hinge indicates the 75th percentile; whiskers indicate the 1.5 interquartile range; and points outside the whiskers indicate outliers. All P values were determined by a Mann–Whitney U-test; sidedness is specified in the subplot caption. *P < 0.05, **P < 10−2, ***P < 10−4, ****P < 10−5. a, Neuronal and glial cell type signature scores in healthy cfRNA plasma (n = 18) on a logarithmic scale. b, Comparison of the proximal tubule signature score in CKD stages 3+ (n = 51 samples; nine patients) and healthy controls (n = 9 samples; three patients) (P = 9.66 × 10⁻³, U = 116, one sided). Dot color denotes each patient. c, Hepatocyte signature score between healthy (n = 16) and both NAFLD (n = 46) (P = 3.15 × 10⁻⁴, U = 155, one sided) and NASH (n = 163) (P = 4.68 × 10⁻⁶, U = 427, one sided); NASH versus NAFLD (P = 0.464, U = 3483, two sided). Color reflects sample collection center. d, Neuronal and glial signature scores in AD (n = 40) and NCI (n = 18) cohorts. Excitatory neuron (P = 4.94 × 10⁻³, U = 206, one sided), oligodendrocyte (P = 2.28 × 10⁻³, U = 178, two sided), oligodendrocyte progenitor (P = 2.27 × 10⁻², U = 224, two sided) and astrocyte (P = 6.11 × 10⁻⁵, U = 121, two sided). Ast, astrocyte; Ex, excitatory neuron; In, inhibitory neuron; Oli, oligodendrocyte; Opc, oligodendrocyte precursor cell. Source data
Extended Data Fig. 1
Extended Data Fig. 1. Cell-free RNA Sample Quality Control.
Quality control metrics (3′ bias fraction, ribosomal fraction, and DNA contamination) were determined for each cfRNA sample downloaded from a given SRA accession number. Samples with outlier values are highlighted in red and were not considered in subsequent analyses (see Methods section ‘Sample quality filtering’). (a) Ibarra et al (n = 285) (b) Toden et al (n = 339) (c) Chalasani et al (n = 500). Box plot: horizonal line, median; lower hinge, 25th percentile; upper hinge, 75th percentile; whiskers span the 1.5 interquartile range; points outside the whiskers indicate outliers. Each point corresponds to a downloaded cfRNA sample from the corresponding SRA accession number.
Extended Data Fig. 2
Extended Data Fig. 2. Hierarchical clustering on non-immune Tabula Sapiens organ compartments.
Dashed line indicates the height at which tree was cut. Dendrograms correspond with the cell type annotations belonging to (a) the epithelial compartment, (b) the endothelial compartment (c) the stromal compartment.
Extended Data Fig. 3
Extended Data Fig. 3. Tabula Sapiens basis matrix performance on GTEx bulk RNA samples using nu-SVR.
GTEx tissue samples possessing cell types wholly present and absent from the basis matrix column space were selected. For box plots: horizonal line, median; lower hinge, 25th percentile; upper hinge, 75th percentile; whiskers, 1.5 interquartile range; points outside the whiskers indicate outliers. There are 30 bulk RNA seq samples for a given tissue except for the Bladder (n = 21), Kidney – Medulla (n = 4), and Whole Blood (n = 19). (a) Root mean square error between predicted expression and measured expression in a given GTEx tissue. Units are zero-mean unit variance scaled CPM counts. Tissues present in TSP have reduced RMSE compared to those that are absent (Kidney – Medulla and Brain). Tissues with high cellular heterogeneity (for example Lung, Bladder, Small Intestine, Kidney) exhibit reduced deconvolution performance compared to less heterogeneous tissues (for example Whole Blood, Spleen, Liver). (b) Pearson correlation between predicted expression and measured expression in a given GTEx tissue.
Extended Data Fig. 4
Extended Data Fig. 4. Deconvolution of healthy plasma samples from Toden et al using Tabula Sapiens.
Pie charts denote mean fractional cell type specific RNA contributions for (a) University of Indiana (n = 17), (b) University of Kentucky (n = 18), (c) Washington University in St. Louis (n = 22).
Extended Data Fig. 5
Extended Data Fig. 5. nuSVR decomposition of the plasma cell free transcriptome with Tabula Sapiens.
For boxplots, horizonal line, median; lower hinge, 25th percentile; upper hinge, 75th percentile; whiskers span the 1.5 interquartile range; points outside the whiskers indicate outliers. Each point corresponds to a patient in a given cohort; University of Indiana (n = 17), University of Kentucky (n = 18), Washington University in St. Louis (n = 22), and BioIVT (n = 18). For heatmaps or clustermaps, the scale bar denotes the pearson correlation value. (a) Complete linkage clustermap of pairwise pearson correlation of deconvolved cell type fractions between patients from a given center; row color denotes a given center (n = 75 patients). (b) Heatmap of pairwise pearson correlation of the mean cell type coefficients per center. (c) Deconvolution RMSE between predicted vs. measured expression for all biological replicates across all centers. (d) Deconvolution pearson correlation between predicted vs. measured expression for all biological replicates across all centers.
Extended Data Fig. 6
Extended Data Fig. 6. Establishing gene profile cell type specificity in context of the whole body using single cell and bulk RNA-seq data.
(a) Cell type signature scoring procedure; please see the ‘Signature Scoring’ in the Methods for the full derivation procedure of a given cell type gene profile. (b) Single cell heatmaps for gene cell type profiles within the corresponding tissue cell atlas, demonstrating that a cell type specific profile is unique to a given cell type across those within a given tissue. Columns denote marker genes for a given cell type; rows indicate individual cells. The color bar scale corresponds to log-transformed counts-per-ten thousand. (c) Gini coefficient density plot for genes in cell type profiles derived from brain and liver single cell atlases using HPA NX counts. The area under the curve for a given cell type sums to one. (d) Log fold change in bulk RNA-seq data of a given cell type profile, demonstrating that the predominant expression of the cell type signature in its native tissue is highest relative to other non-native tissues. Values are the log-fold change of the signature score of a given cell type profile in the native tissue (indicated by the y-axis) to the mean expression in the remaining non-native tissues. Box plot: horizontal line, median; lower hinge, 25th percentile; upper hinge, 75th percentile; whiskers span the 1.5 interquartile range; points outside the whiskers indicate outliers (n = 2462 GTEx brain samples for box plot on left; n = 226 GTEx liver samples, right).
Extended Data Fig. 7
Distribution of Gini coefficient and Tau for all genes denoted by HPA as specific to the brain, liver, placenta, and kidney.
Extended Data Fig. 8
Extended Data Fig. 8. Comprehensive placental and renal cell type gene profile specificity at single cell and whole body resolution.
For box plots in f, g: horizontal line, median; lower hinge, 25th percentile; upper hinge, 75th percentile; whiskers span the 1.5 interquartile range; points outside whiskers indicate outliers. (a) Violin plot of derived syncytiotrophoblast and extravillous trophoblast gene profiles from Vento-Tormo et al. (b) Violin plot of derived syncytiotrophoblast and extravillous trophoblast gene profiles from Suryawanshi et al. (c) Violin plot of derived proximal tubule gene profile (d) Gini coefficient distribution for placental trophoblast cell types in (a) and (b) (e) Gini coefficient distribution for renal cell type in (c) (f) Distribution of placental trophoblast signature scores across all GTEx tissues. Note: given that the placenta is not in GTEx, the box plots correspond to the distribution of signature scores across non-placental tissues (sum of log-transformed counts-per-ten thousand) (n = 17382 non-placenta GTEx samples) (g) Log-fold change of renal cell type signature score in GTEx Kidney Cortex/Medulla samples relative to the mean non-kidney signature score, demonstrating that the predominant expression of the cell type signature in its native tissue is highest relative to other non-native tissues. Values are the log ratio of the signature score in the kidney to the mean signature score in the remaining non-kidney GTEx tissue samples (n = 89 GTEx renal cortex or medulla samples).
Extended Data Fig. 9
Extended Data Fig. 9. Expression distribution of Tsang et al trophoblast gene profiles in placenta scRNA atlases and in preeclampsia cfRNA.
Derived trophoblast signature scores in the (a) iPEC dataset (mothers with no complications, n = 73 patients; mothers with preeclampsia, n = 40 patients) and (b) PEARL-PEC (n = 12 patients for each early/late-onset PE cohorts and gestationally- age matched healthy controls) datasets from Munchel et al. Box plot: horizontal line, median; lower hinge, 25th percentile; upper hinge, 75th percentile; whiskers span the 1.5 interquartile range; points outside the whiskers indicate outliers. Stacked violin plot of the genes comprising the extravillous trophoblast and syncytiotrophoblast gene profiles from Tsang et al. intersecting with the measured genes in (c) Suryawanshi et al and (d) Vento-Tormo et al, reflecting the expression distribution across all observed placental cell types.
Extended Data Fig. 10
Extended Data Fig. 10. Assessment of cell type gene profile discriminatory power during signature scoring.
(a) Density of p-values over 10,000 trial permutation test to assess p-value calibration for a given signature score. In all cases, the distribution is uniform, as expected under the null. (b) Density of U values over 10,000 trial permutation test; red line indicates the U value corresponding to the experimental comparison reported in Fig. 2. (c) Donut plot reflecting the number of genes in the hepatocyte cell type gene profile that intersect with the reported NAFLD DEG in Chalasani et al. (d) Density plot reflecting the Gini coefficient distribution corresponding to DEG in NAFLD that are liver or hepatocyte specific. The Gini coefficient is computed using the mean expression per liver cell type in Aizarani et al (Methods). Area under each curve sums to one. (e) Donut plots reflecting the number of genes in brain cell type gene profiles that intersect with the reported AD DEG in Toden et al. (f) Density plot reflecting the Gini coefficient distribution corresponding to DEG in AD that are brain or brain cell type specific. The Gini coefficient is computed using the mean expression per brain cell type in the ‘Normal’ samples of Mathys et al (Methods). Area under each curve sums to one.

Similar articles

  • The Tabula Sapiens: A multiple-organ, single-cell transcriptomic atlas of humans.
    Tabula Sapiens Consortium*; Jones RC, Karkanias J, Krasnow MA, Pisco AO, Quake SR, Salzman J, Yosef N, Bulthaup B, Brown P, Harper W, Hemenez M, Ponnusamy R, Salehi A, Sanagavarapu BA, Spallino E, Aaron KA, Concepcion W, Gardner JM, Kelly B, Neidlinger N, Wang Z, Crasta S, Kolluru S, Morri M, Tan SY, Travaglini KJ, Xu C, Alcántara-Hernández M, Almanzar N, Antony J, Beyersdorf B, Burhan D, Calcuttawala K, Carter MM, Chan CKF, Chang CA, Chang S, Colville A, Culver RN, Cvijović I, D'Amato G, Ezran C, Galdos FX, Gillich A, Goodyer WR, Hang Y, Hayashi A, Houshdaran S, Huang X, Irwin JC, Jang S, Juanico JV, Kershner AM, Kim S, Kiss B, Kong W, Kumar ME, Kuo AH, Li B, Loeb GB, Lu WJ, Mantri S, Markovic M, McAlpine PL, de Morree A, Mrouj K, Mukherjee S, Muser T, Neuhöfer P, Nguyen TD, Perez K, Puluca N, Qi Z, Rao P, Raquer-McKay H, Schaum N, Scott B, Seddighzadeh B, Segal J, Sen S, Sikandar S, Spencer SP, Steffes LC, Subramaniam VR, Swarup A, Swift M, Van Treuren W, Trimm E, Veizades S, Vijayakumar S, Vo KC, Vorperian SK, Wang W, Weinstein HNW, Winkler J, Wu TTH, Xie J, Yung AR, Zhang Y, Detweiler AM, Mekonen H, Neff NF, Sit RV, Tan M, Yan J, Bean GR, Charu V, Forgó E, Martin BA, Ozawa MG,… See abstract for full author list ➔ Tabula Sapiens Consortium*, et al. Science. 2022 May 13;376(6594):eabl4896. doi: 10.1126/science.abl4896. Epub 2022 May 13. Science. 2022. PMID: 35549404 Free PMC article.
  • Characterizing the Cell-Free Transcriptome in a Humanized Diffuse Large B-Cell Lymphoma Patient-Derived Tumor Xenograft Model for RNA-Based Liquid Biopsy in a Preclinical Setting.
    Decruyenaere P, Daneels W, Morlion A, Verniers K, Anckaert J, Tavernier J, Offner F, Vandesompele J. Decruyenaere P, et al. Int J Mol Sci. 2024 Sep 16;25(18):9982. doi: 10.3390/ijms25189982. Int J Mol Sci. 2024. PMID: 39337470 Free PMC article.
  • Towards Tabula Gallus.
    Yamagata M. Yamagata M. Int J Mol Sci. 2022 Jan 6;23(2):613. doi: 10.3390/ijms23020613. Int J Mol Sci. 2022. PMID: 35054796 Free PMC article. Review.
  • Integrative single-cell and cell-free plasma RNA transcriptomics elucidates placental cellular dynamics.
    Tsang JCH, Vong JSL, Ji L, Poon LCY, Jiang P, Lui KO, Ni YB, To KF, Cheng YKY, Chiu RWK, Lo YMD. Tsang JCH, et al. Proc Natl Acad Sci U S A. 2017 Sep 12;114(37):E7786-E7795. doi: 10.1073/pnas.1710470114. Epub 2017 Aug 22. Proc Natl Acad Sci U S A. 2017. PMID: 28830992 Free PMC article.
  • Nucleic acid liquid biopsies in cardiovascular disease: Cell-free RNA liquid biopsies in cardiovascular disease.
    Sharma S, Artner T, Preissner KT, Lang IM. Sharma S, et al. Atherosclerosis. 2024 Nov;398:118584. doi: 10.1016/j.atherosclerosis.2024.118584. Epub 2024 Sep 5. Atherosclerosis. 2024. PMID: 39306538 Review.

Cited by

References

    1. Koh W, et al. Noninvasive in vivo monitoring of tissue-specific global gene expression in humans. Proc. Natl Acad. Sci. USA. 2014;111:7361–7366. doi: 10.1073/pnas.1405528111. - DOI - PMC - PubMed
    1. Ibarra A, et al. Non-invasive characterization of human bone marrow stimulation and reconstitution by cell-free messenger RNA sequencing. Nat. Commun. 2020;11:400. doi: 10.1038/s41467-019-14253-4. - DOI - PMC - PubMed
    1. Larson MH, et al. A comprehensive characterization of the cell-free transcriptome reveals tissue- and subtype-specific biomarkers for cancer detection. Nat. Commun. 2021;12:2357. doi: 10.1038/s41467-021-22444-1. - DOI - PMC - PubMed
    1. Ngo, T. T. M., Moufarrej, M. N. & Rasmussen, M. L. H. Noninvasive blood tests for fetal development predict gestational age and preterm delivery. Science360, 1133–1136 (2018). - PMC - PubMed
    1. Munchel, S. et al. Circulating transcripts in maternal blood reflect a molecular signature of early-onset preeclampsia. Sci. Transl. Med. 12, eaaz0131 (2020). - PubMed

Publication types

Substances