

A High-Density Genetic Map Enables Genome Synteny and QTL Mapping of Vegetative Growth and Leaf Traits in Gardenia
- PMID: 35132310
- PMCID: PMC8817757
- DOI: 10.3389/fgene.2021.802738
A High-Density Genetic Map Enables Genome Synteny and QTL Mapping of Vegetative Growth and Leaf Traits in Gardenia
Abstract
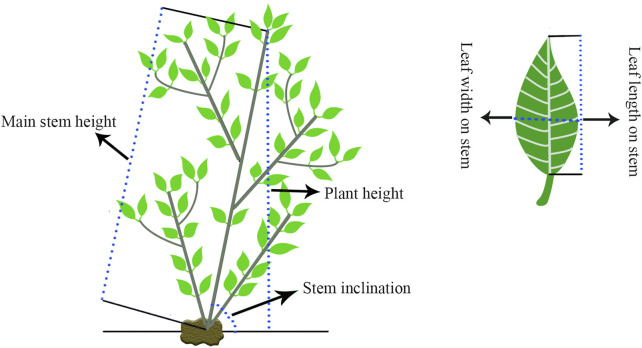
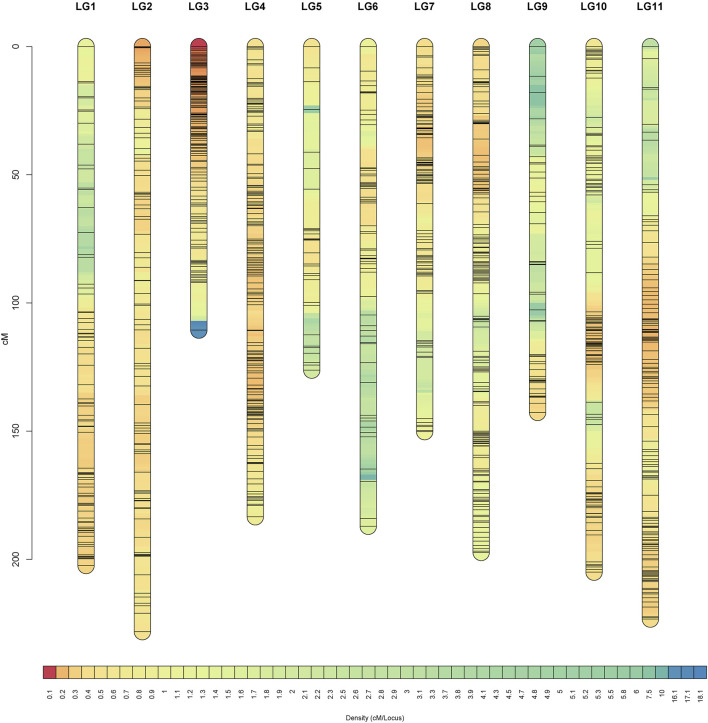
The gardenia is a traditional medicinal horticultural plant in China, but its molecular genetic research has been largely hysteretic. Here, we constructed an F1 population with 200 true hybrid individuals. Using the genotyping-by-sequencing method, a high-density sex-average genetic map was generated that contained 4,249 SNPs with a total length of 1956.28 cM and an average genetic distance of 0.46 cM. We developed 17 SNP-based Kompetitive Allele-Specific PCR markers and found that 15 SNPs were successfully genotyped, of which 13 single-nucleotide polymorphism genotypings of 96 F1 individuals showed genotypes consistent with GBS-mined genotypes. A genomic collinearity analysis between gardenia and the Rubiaceae species Coffea arabica, Coffea canephora and Ophiorrhiza pumila showed the relativity strong conservation of LG11 with NC_039,919.1, HG974438.1 and Bliw01000011.1, respectively. Lastly, a quantitative trait loci analysis at three phenotyping time points (2019, 2020, and 2021) yielded 18 QTLs for growth-related traits and 31 QTLs for leaf-related traits, of which qBSBN7-1, qCD8 and qLNP2-1 could be repeatably detected. Five QTL regions (qCD8 and qSBD8, qBSBN7 and qSI7, qCD4-1 and qLLLS4, qLNP10 and qSLWS10-2, qSBD10 and qLLLS10) with potential pleiotropic effects were also observed. This study provides novel insight into molecular genetic research and could be helpful for further gene cloning and marker-assisted selection for early growth and development traits in the gardenia.
Keywords: QTL; gardenia; genetic map; genotyping-by-sequencing; growth-and leaf-related traits; synteny.
Copyright © 2022 Cui, Fan, Xu, Sheng, Xu and Wang.
Conflict of interest statement
YX was employed by Adsen Biotechnology Co., Ltd. The remaining authors declare that the research was conducted in the absence of any commercial or financial relationships that could be construed as a potential conflict of interest.
Figures


Similar articles
-
A consensus and saturated genetic map provides insight into genome anchoring, synteny of Solanaceae and leaf- and fruit-related QTLs in wolfberry (Lycium Linn.).BMC Plant Biol. 2021 Jul 24;21(1):350. doi: 10.1186/s12870-021-03115-1. BMC Plant Biol. 2021. PMID: 34303361 Free PMC article.
-
High-resolution genetic linkage map of European pear (Pyrus communis) and QTL fine-mapping of vegetative budbreak time.BMC Plant Biol. 2018 Aug 31;18(1):175. doi: 10.1186/s12870-018-1386-2. BMC Plant Biol. 2018. PMID: 30165824 Free PMC article.
-
Construction of a high-density genetic map and QTL mapping of leaf traits and plant growth in an interspecific F1 population of Catalpa bungei × Catalpa duclouxii Dode.BMC Plant Biol. 2019 Dec 30;19(1):596. doi: 10.1186/s12870-019-2207-y. BMC Plant Biol. 2019. PMID: 31888555 Free PMC article.
-
High-density linkage map construction and QTL analyses for fiber quality, yield and morphological traits using CottonSNP63K array in upland cotton (Gossypium hirsutum L.).BMC Genomics. 2019 Nov 21;20(1):889. doi: 10.1186/s12864-019-6214-z. BMC Genomics. 2019. PMID: 31771502 Free PMC article.
-
A high-density genetic map of extra-long staple cotton (Gossypium barbadense) constructed using genotyping-by-sequencing based single nucleotide polymorphic markers and identification of fiber traits-related QTL in a recombinant inbred line population.BMC Genomics. 2018 Jun 25;19(1):489. doi: 10.1186/s12864-018-4890-8. BMC Genomics. 2018. PMID: 29940861 Free PMC article.
Cited by
-
From single- to multi-omics: future research trends in medicinal plants.Brief Bioinform. 2023 Jan 19;24(1):bbac485. doi: 10.1093/bib/bbac485. Brief Bioinform. 2023. PMID: 36416120 Free PMC article.
References
-
- Adams J., Qiu Y., Xu Y., Schnable J. C. (2020). Plant Segmentation by Supervised Machine Learning Methods. Plant phenome j. 3, e20001. 10.1002/ppj2.20001 - DOI
-
- Anagbogu C. F., Bhattacharjee R., Ilori C., Tongyoo P., Dada K. E., Muyiwa A. A., et al. (2019). Genetic Diversity and Re-classification of Coffee (Coffea Canephora Pierre Ex A. Froehner) from South Western Nigeria through Genotyping-By-Sequencing-Single Nucleotide Polymorphism Analysis. Genet. Resour. Crop Evol. 66, 685–696. 10.1007/s10722-019-00744-2 - DOI
-
- Ao N., Ma J., Xu T., Su J., Yang X., Guan Z., et al. (2019). Genetic Variation and QTL Mapping for Cold Tolerance in a chrysanthemum F1 Population at Different Growth Stages. Euphytica 215, 88. 10.1007/s10681-019-2412-7 - DOI
LinkOut - more resources
Full Text Sources