[Preprint]. 2022 Feb 4:rs.3.rs-1287631.
doi: 10.21203/rs.3.rs-1287631/v1.

A Model for Network-Based Identification and Pharmacological Targeting of Aberrant, Replication-Permissive Transcriptional Programs Induced by Viral Infection

Affiliations

A Model for Network-Based Identification and Pharmacological Targeting of Aberrant, Replication-Permissive Transcriptional Programs Induced by Viral Infection

Pasquale Laise et al. Res Sq. .

Update in

Abstract

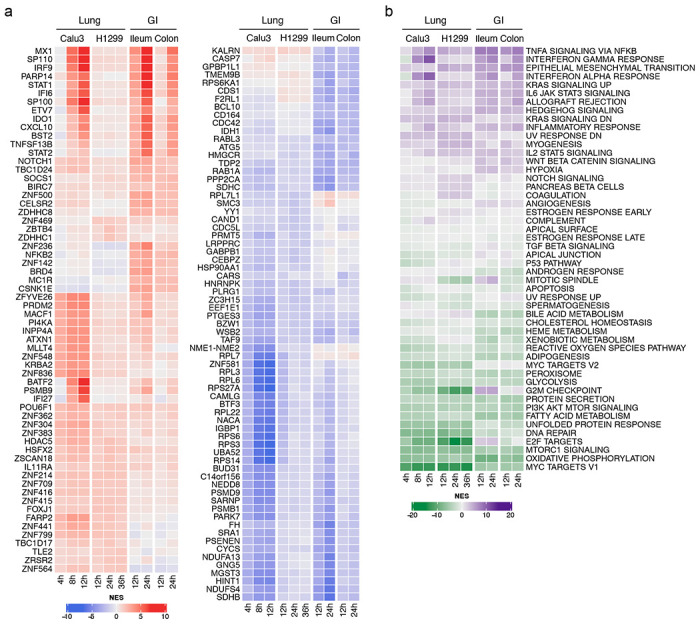
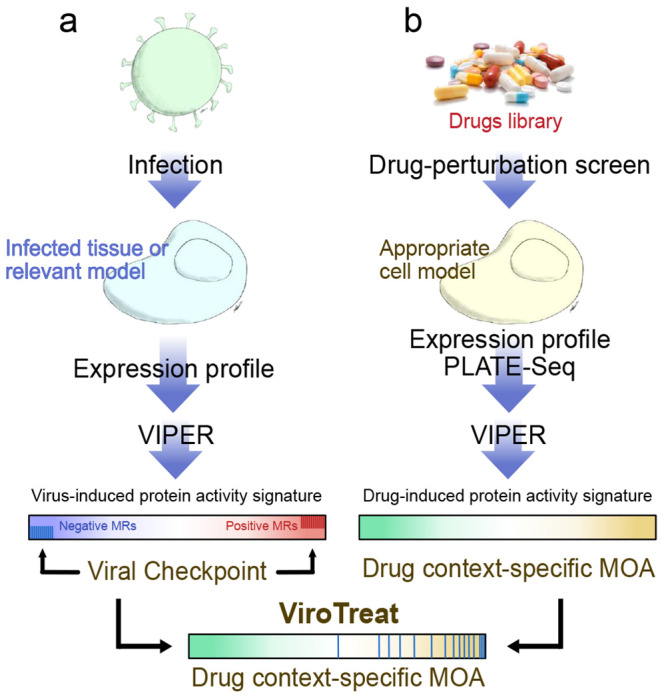
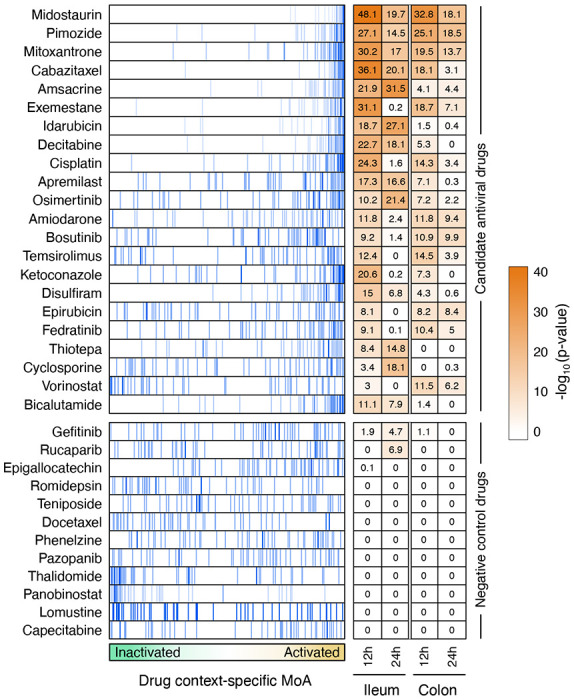
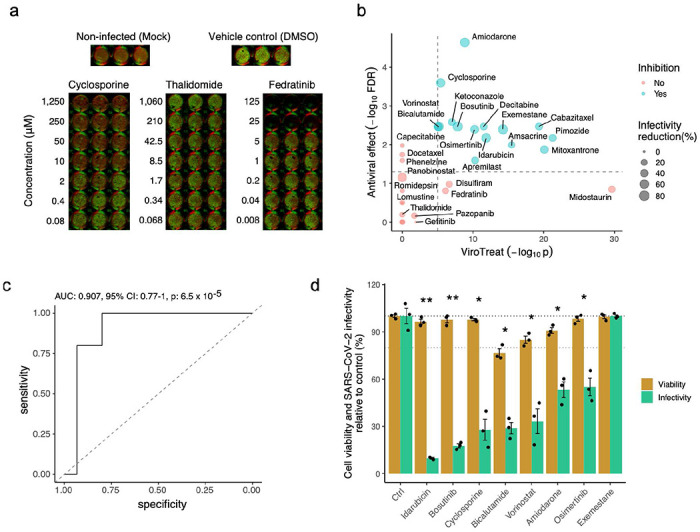
Precise characterization and targeting of host cell transcriptional machinery hijacked by viral infection remains challenging. Here, we show that SARS-CoV-2 hijacks the host cell transcriptional machinery to induce a phenotypic state amenable to its replication. Specifically, analysis of Master Regulator (MR) proteins representing mechanistic determinants of the gene expression signature induced by SARS-CoV-2 in infected cells revealed coordinated inactivation of MRs enriched in physical interactions with SARS-CoV-2 proteins, suggesting their mechanistic role in maintaining a host cell state refractory to virus replication. To test their functional relevance, we measured SARS-CoV-2 replication in epithelial cells treated with drugs predicted to activate the entire repertoire of repressed MRs, based on their experimentally elucidated, context-specific mechanism of action. Overall, >80% of drugs predicted to be effective by this methodology induced significant reduction of SARS-CoV-2 replication, without affecting cell viability. This model for host-directed pharmacological therapy is fully generalizable and can be deployed to identify drugs targeting host cell-based MR signatures induced by virtually any pathogen.


Conflict of interest statement

Competing Financial Interest Statement P.L. is Director of Single-Cell Systems Biology at DarwinHealth, Inc., a company that has licensed some of the algorithms used in this manuscript from Columbia University. G.B. is founder, CEO and equity holder of DarwinHealth, Inc. X.S. is Senior Computational Biologist at DarwinHealth, Inc. A.C. is founder, equity holder, and consultant of DarwinHealth Inc. M.J.A. is CSO and equity holder of DarwinHealth, Inc. Columbia University is also an equity holder in DarwinHealth Inc.

Figures

Figure 1.
Figure 1.. Changes in host cell protein activity in response to SARS-CoV-2 virus infection.
a. Left, heatmap showing the activity of the top 10 most activated proteins in response to SARS-CoV-2 infection in each of the models and time-points profiled at the single-cell level. Right, heatmap showing the activity of the top 10 most inactivated proteins in response to SARS-CoV-2 infection in each of the models and time-points profiled at the single-cell level. b. Heatmap showing the enrichment of biological hallmarks in the SARS-CoV-2-induced protein activity signatures. Shown is the Normalized Enrichment Score (NES) estimated by the aREA algorithm, with purple color indicating enrichment in the over activated proteins and green color indicating enrichment in the inactivated proteins.
Figure 2.
Figure 2.. Schematic representation of the ViroTreat algorithm.
a. Virus-induced MR proteins—the Viral Checkpoint—dissected by VIPER analysis of a gene expression signature, obtained by comparing an infected tissue or relevant model with non-infected mock controls. b. Context-specific drug MoA database, generated by perturbing an appropriate cell model with therapeutically relevant drug concentrations, followed by VIPER analysis of the drug-induced gene expression signatures to infer the drug-induced protein activity signature. ViroTreat prioritizes drugs able to activate the Viral Checkpoint’s negative MR proteins by quantifying the enrichment of such proteins on the drugs’ context-specific MoA.
Figure 3.
Figure 3.. ViroTreat results for the GI models.
Shown are the enrichment plot for the top 50 most inactivated (blue vertical lines) proteins, in response to SARS-CoV-2 infection (the negative component of the viral Checkpoint) of the ileum organoid for 12h, on the protein activity signature induced by the drug perturbations—drug context-specific MoA, represented by the green-orange color scale in the x-axis—of LoVo colon adenocarcinoma cells. The heatmap shows the Bonferroni’s corrected −log10(p-value) estimated by ViroTreat. Shown are all the 22 candidate drugs (ViroTreat p < 10−5) and 12 drugs selected as negative controls (ViroTreat p > 0.01) in both ileum and colon-derived organoids at 12 and 24 hours post-infection.
Figure 4.
Figure 4.. Experimental validation of ViroTreat predictions.
a. Representative immunofluorescence images of non-infected (Mock) Caco-2 cells, vehicle control (DMSO) treated and SARS-CoV-2 infected cells, and representative examples of a drug showing significant antiviral effect (Cyclosporine), of a drug showing non-significant antiviral effect (Thalidomide) and a drug showing non-significant antiviral effect and cell toxicity (Fedratinib). Drug concentration (μM) is indicated to the left of the images showing triplicated experiments. Cells were stained with DNA dye Draq5 (red) and anti-dsRNA antibody (green). b. Scatterplot showing the ViroTreat results (x-axis) compared to the specific antiviral effect (y-axis) experimentally evaluated in Caco-2 colon adenocarcinoma cells. The vertical and horizontal dashed lines represent the thresholds for statistical significance for ViroTreat (p-value = 10−5, BC) and specific antiviral effect (FDR = 0.05), respectively. c. ROC analysis for the ViroTreat predictions, considering as positive response a specific antiviral effect at FDR < 0.05 with at least 20% reduction in virus replication. Estimated AUC, 95% confidence interval (CI) and p-value are indicated in the plots. d. Effect of 8 drugs, showing the strongest reduction in SARS-CoV-2 replication in Caco-2 cells, on cell viability and SARS-CoV-2 replication in GI organoid-derived 2D primary cell cultures. Bars indicate the mean ± SEM. Antiviral effect: * FDR < 0.05, ** FDR < 0.01.

Similar articles

References

    1. Bojkova D. et al. Proteomics of SARS-CoV-2-infected host cells reveals therapy targets. Nature 583, 469–472, doi:10.1038/s41586-020-2332-7 (2020). - DOI - PMC - PubMed
    1. Gordon D. E. et al. A SARS-CoV-2 protein interaction map reveals targets for drug repurposing. Nature 583, 459–468, doi:10.1038/s41586-020-2286-9 (2020). - DOI - PMC - PubMed
    1. Daniloski Z. et al. Identification of Required Host Factors for SARS-CoV-2 Infection in Human Cells. Cell 184, 92–105 e116, doi:10.1016/j.cell.2020.10.030 (2021). - DOI - PMC - PubMed
    1. Schneider W. M. et al. Genome-Scale Identification of SARS-CoV-2 and Pan-coronavirus Host Factor Networks. Cell 184, 120–132 e114, doi:10.1016/j.cell.2020.12.006 (2021). - DOI - PMC - PubMed
    1. Wang R. et al. Genetic Screens Identify Host Factors for SARS-CoV-2 and Common Cold Coronaviruses. Cell 184, 106–119 e114, doi:10.1016/j.cell.2020.12.004 (2021). - DOI - PMC - PubMed

Publication types