[Preprint]. 2023 Jan 28:2022.02.01.478677.
doi: 10.1101/2022.02.01.478677.

Assessing functional connectivity differences and work-related fatigue in surviving COVID-negative patients

Affiliations

Assessing functional connectivity differences and work-related fatigue in surviving COVID-negative patients

Rakibul Hafiz et al. bioRxiv. .

Abstract

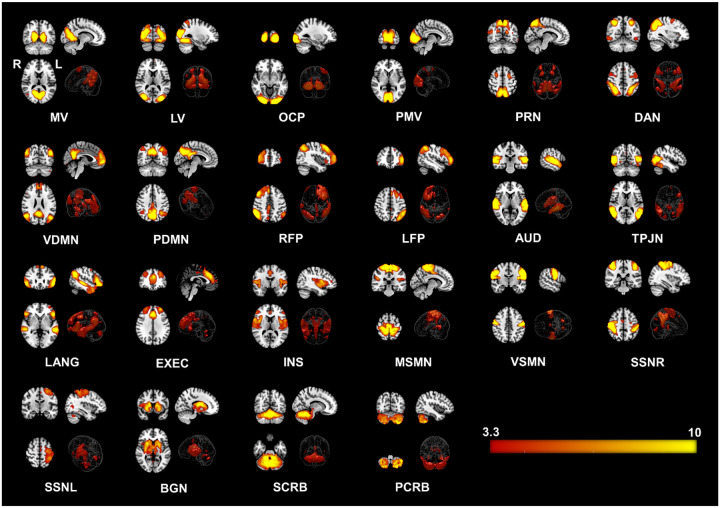
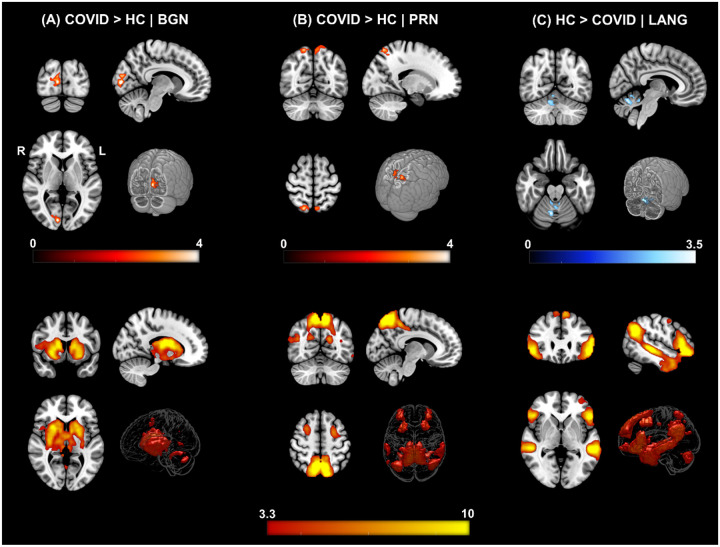
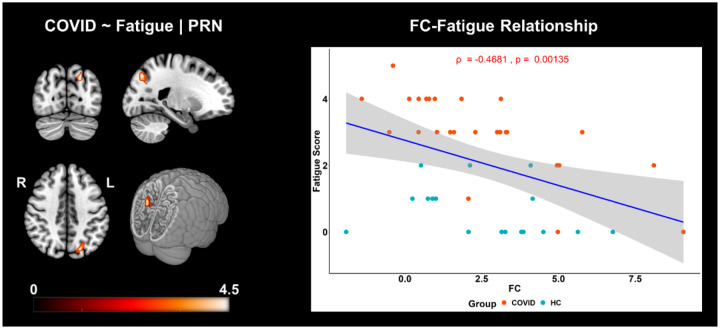
The Coronavirus Disease 2019 (COVID-19) has affected all aspects of life around the world. Neuroimaging evidence suggests the novel coronavirus can attack the central nervous system (CNS), causing cerebro-vascular abnormalities in the brain. This can lead to focal changes in cerebral blood flow and metabolic oxygen consumption rate in the brain. However, the extent and spatial locations of brain alterations in COVID-19 survivors are largely unknown. In this study, we have assessed brain functional connectivity (FC) using resting-state functional MRI (RS-fMRI) in 38 (25 males) COVID patients two weeks after hospital discharge, when PCR negative and 31 (24 males) healthy subjects. FC was estimated using independent component analysis (ICA) and dual regression. When compared to the healthy group, the COVID group demonstrated significantly enhanced FC in the basal ganglia and precuneus networks (family wise error (fwe) corrected, pfwe < 0.05), while, on the other hand, reduced FC in the language network (pfwe < 0.05). The COVID group also experienced higher fatigue levels during work, compared to the healthy group (p < 0.001). Moreover, within the precuneus network, we noticed a significant negative correlation between FC and fatigue scores across groups (Spearman's ρ = -0.47, p = 0.001, r2 = 0.22). Interestingly, this relationship was found to be significantly stronger among COVID survivors within the left parietal lobe, which is known to be structurally and functionally associated with fatigue in other neurological disorders.

Keywords: COVID; Fatigue; Functional Connectivity; ICA; RS-fMRI.


Conflict of interest statement

Conflict of interest statement: The authors declare no competing financial interests.

Figures

Figure 1.
Figure 1.. Twenty-two Resting State Networks (RSNs) identified from group ICA using ‘melodic’.
Abbreviated names of each network are shown at the bottom of each image. Three orthogonal slices are shown for each network along with a volume rendered image to show depth and three-dimensional view of the RSNs. Statistical estimates (Z-scores) are embedded into a colorbar at the bottom-right. Keys: MV = Medial Visual, LV = Lateral Visual, OCP = Occipital Pole, PMV = Primary Visual Network, PRN = Precuneus Network, DAN = Dorsal Attention, VDMN = Ventral Default Mode Network (DMN), PDMN = Posterior DMN, RFP = Right Fronto Parietal, LFP = Left Fronto Parietal, AUD = Auditory, TPJN = Temporo-Parietal Junction Network, LANG = Language Network, EXEC = Executive Control Network, INS = Insular Network, MSMN = Medial Sensory-Motor Network (SMN), VSMN = Ventral SMN, SSNR = Somatosensory Network - Right, SMNL = Somatosensory Network - Left,, BGN = Basal Ganglia Network, SCRB = Superior Cerebellar Network, PCRB = Posterior Cerebellar Network; R = Right Hemisphere of the Brain, L = Left Hemisphere of the Brain.
Figure 2.
Figure 2.. ΔFC | Functional Connectivity differences between COVID survivors and healthy controls.
[top row] (A) COVID > HC: Enhanced FC in COVID compared to HCs observed in the Basal Ganglia Network (BGN) network. Three orthogonal slices (left) along with a cut-to-depth volume rendered image to show the effects in the right Calc, Cu and LiG. The colorbar represents t – score values. Cluster information include - cluster peak: [9 −84 6], and cluster size = 69 voxels. (B) COVID > HC: Enhanced FC in COVID compared to HCs observed in the Precuneus (PRC) network, demonstrating a significant difference in FC in the bilateral SPL and PCu regions. Cluster information include - cluster peak: [21 −57 54] and cluster size = 90 voxels. Please note, enhanced FC among COVID survivors in both (A) and (B) is represented with a hot iron colormap and corresponding colorbar. (C) HC > COVID: Reduced FC in COVID compared to HC group observed in the Language (LANG) network demonstrating significant FC differences in several vermal layers of the Cerebellum. The electric blue colormap and corresponding colorbar are used to indicate that FC is reduced in the COVID group. Cluster information include - cluster peak: [9 −63 −24] and cluster size = 57 voxels. [bottom row] Corresponding group level ICA networks from which FC differences are shown on the top row. The colorbar represents z-scores.
Figure 3.
Figure 3.. FC is negatively correlated with self-reported fatigue scores in COVID and HC individuals.
The three orthogonal slices on the left, shows the cluster withing the PRN network, along with a cut-to-depth volume rendered image consisting of Superior Parietal Lobule (SPL), Superior Occipital Gyrus (SOG), Angular Gyrus (AnG), Precuneus (PCu). This cluster demonstrated significantly negative correlation with fatigue. The colorbar represents tscore values. The cluster consisted of 46 voxels and the peak was located at MNI coordinates:[−21 −72 42]. The peak t-score of the cluster was, tpeak = 4.40, and corrected for multiple comparisons by controlling false discovery rates, at pfdr < 0.05. The graph on the right shows the linear relationship between FC within the significant cluster and self-reported fatigue scores across all groups. The x-axis represents the residuals plus the average FC (z-scores) across groups from the cluster and the y-axis represents the fatigue scores. The light pink dots represent the COVID group, and the cyan dots represent the HC group. The shaded gray area represents the 95% confidence interval. The blue line represents the least squares regression line of best fit.

Similar articles

Cited by

References

    1. (WHO), W. H. O. (2020, 10/21/2021, 4:46pm CET). WHO Coronavirus Disease (COVID-19) Dashboard. Retrieved 10/21/2021 from https://covid19.who.int/table
    1. Altmann A., Ng B., Landau S. M., Jagust W. J., & Greicius M. D. (2015). Regional brain hypometabolism is unrelated to regional amyloid plaque burden. Brain, 138(Pt 12), 3734–3746. 10.1093/brain/awv278 - DOI - PMC - PubMed
    1. Amunts K., Kedo O., Kindler M., Pieperhoff P., Mohlberg H., Shah N. J., Habel U., Schneider F., & Zilles K. (2005). Cytoarchitectonic mapping of the human amygdala, hippocampal region and entorhinal cortex: intersubject variability and probability maps. Anatomy and Embryology, 210(5), 343–352. 10.1007/s00429-005-0025-5 - DOI - PubMed
    1. Ashburner J. (2007). A fast diffeomorphic image registration algorithm. Neuroimage, 38(1), 95–113. 10.1016/j.neuroimage.2007.07.007 - DOI - PubMed
    1. Behzadi Y., Restom K., Liau J., & Liu T. T. (2007). A component based noise correction method (CompCor) for BOLD and perfusion based fMRI. Neuroimage, 37(1), 90–101. 10.1016/j.neuroimage.2007.04.042 - DOI - PMC - PubMed

Publication types