The Spectral Extent of Phasic Suppression of Loudness and Distortion-Product Otoacoustic Emissions by Infrasound and Low-Frequency Tones
- PMID: 35132510
- PMCID: PMC8964881
- DOI: 10.1007/s10162-021-00830-2
The Spectral Extent of Phasic Suppression of Loudness and Distortion-Product Otoacoustic Emissions by Infrasound and Low-Frequency Tones
Abstract
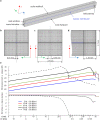
We investigated the effect of a biasing tone close to 5, 15, or 30 Hz on the response to higher-frequency probe tones, behaviorally, and by measuring distortion-product otoacoustic emissions (DPOAEs). The amplitude of the biasing tone was adjusted for criterion suppression of cubic DPOAE elicited by probe tones presented between 0.7 and 8 kHz, or criterion loudness suppression of a train of tone-pip probes in the range 0.125-8 kHz. For DPOAEs, the biasing-tone level for criterion suppression increased with probe-tone frequency by 8-9 dB/octave, consistent with an apex-to-base gradient of biasing-tone-induced basilar membrane displacement, as we verified by computational simulation. In contrast, the biasing-tone level for criterion loudness suppression increased with probe frequency by only 1-3 dB/octave, reminiscent of previously published data on low-side suppression of auditory nerve responses to characteristic frequency tones. These slopes were independent of biasing-tone frequency, but the biasing-tone sensation level required for criterion suppression was ~ 10 dB lower for the two infrasound biasing tones than for the 30-Hz biasing tone. On average, biasing-tone sensation levels as low as 5 dB were sufficient to modulate the perception of higher frequency sounds. Our results are relevant for recent debates on perceptual effects of environmental noise with very low-frequency content and might offer insight into the mechanism underlying low-side suppression.
Keywords: biasing; cochlear mechanics; human cochlea; infrasound; low-frequency hearing.
© 2022. The Author(s).
Conflict of interest statement
The authors declare no competing interests.
Figures


Similar articles
-
Two-tone suppression and distortion production on the basilar membrane in the hook region of cat and guinea pig cochleae.Hear Res. 1993 Mar;66(1):31-45. doi: 10.1016/0378-5955(93)90257-2. Hear Res. 1993. PMID: 8473244
-
Impact of infrasound on the human cochlea.Hear Res. 2007 Nov;233(1-2):67-76. doi: 10.1016/j.heares.2007.07.004. Epub 2007 Jul 29. Hear Res. 2007. PMID: 17761395
-
Age-related shifts in distortion product otoacoustic emissions peak-ratios and amplitude modulation spectra.Hear Res. 2015 Sep;327:186-98. doi: 10.1016/j.heares.2015.07.017. Epub 2015 Jul 29. Hear Res. 2015. PMID: 26232530 Free PMC article.
-
Weakened Cochlear Nonlinearity During Human Aging and Perceptual Correlates.Ear Hear. 2021 July/Aug;42(4):832-845. doi: 10.1097/AUD.0000000000001014. Ear Hear. 2021. PMID: 33886169 Free PMC article.
-
Cochlear compression estimates from measurements of distortion-product otoacoustic emissions.J Acoust Soc Am. 2003 Sep;114(3):1499-507. doi: 10.1121/1.1604122. J Acoust Soc Am. 2003. PMID: 14514203
Cited by
-
Intense low-frequency sound transiently biases human sound lateralisation.PLoS One. 2025 Jun 30;20(6):e0327525. doi: 10.1371/journal.pone.0327525. eCollection 2025. PLoS One. 2025. PMID: 40587519 Free PMC article.
References
-
- Allen JB, Sen D (2000) Is tectorial membrane filtering required to explain two tone suppression and the upward spread of masking? In: Wada H (ed) Proceedings of The International Symposium on Recent Developments in Auditory Mechanics. Sendai, Japan pp 137–143
-
- Alves JA, Silva LT, Remoaldo PCC. The influence of low-frequency noise pollution on the quality of life and place in sustainable cities: a case study from northern Portugal. Sustainability. 2015;7:13920–13946. doi: 10.3390/su71013920. - DOI
Publication types
MeSH terms
Grants and funding
LinkOut - more resources
Full Text Sources
Miscellaneous

