

Spatial frequency equalization does not prevent spatial-numerical associations
- PMID: 35132580
- PMCID: PMC8821778
- DOI: 10.3758/s13423-022-02060-w
Spatial frequency equalization does not prevent spatial-numerical associations
Abstract
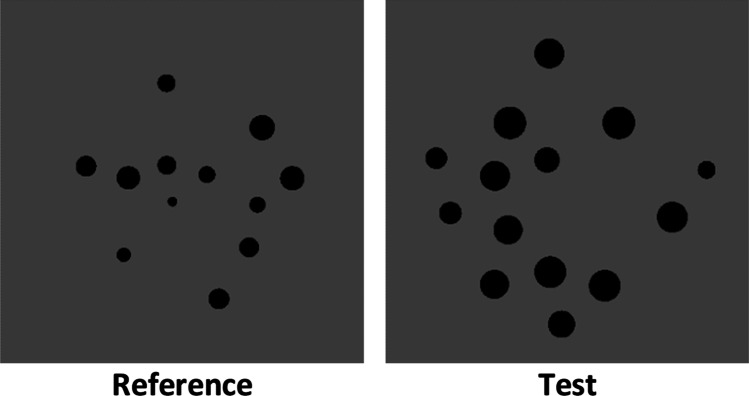
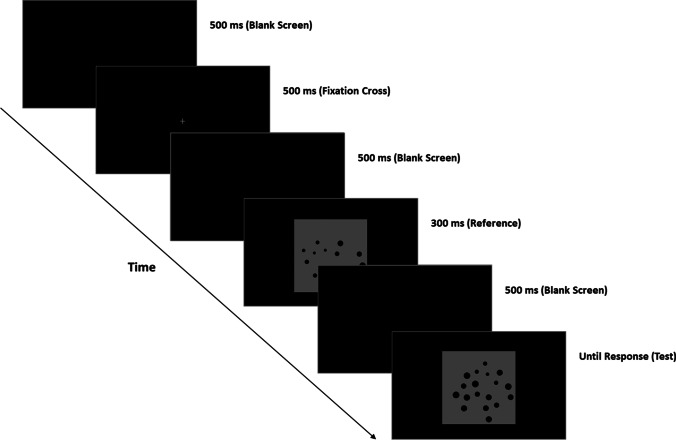
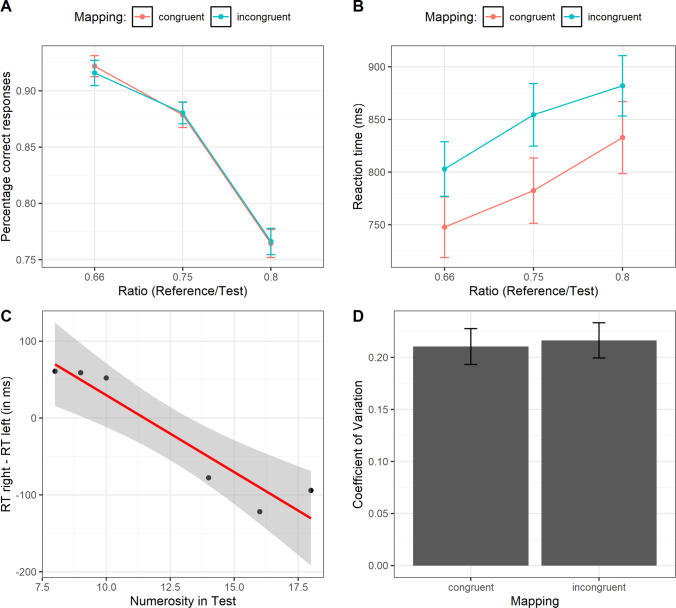
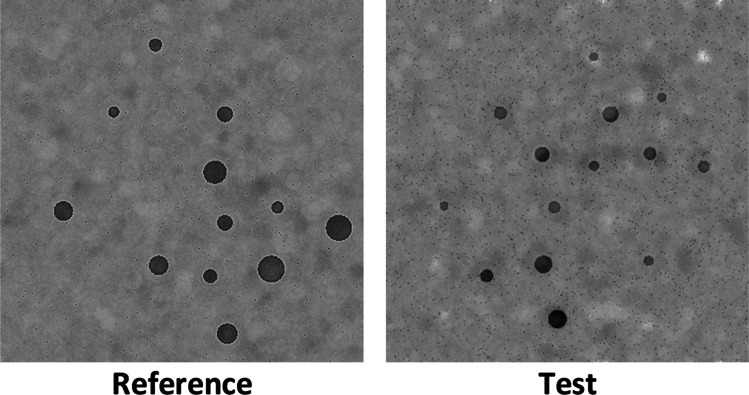
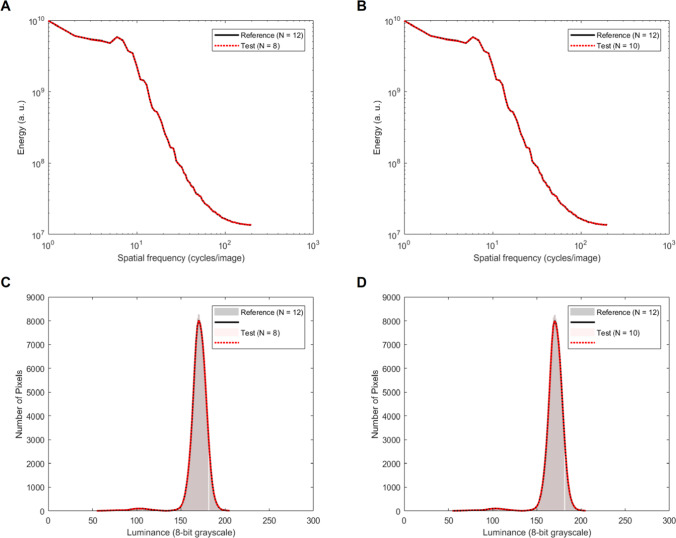
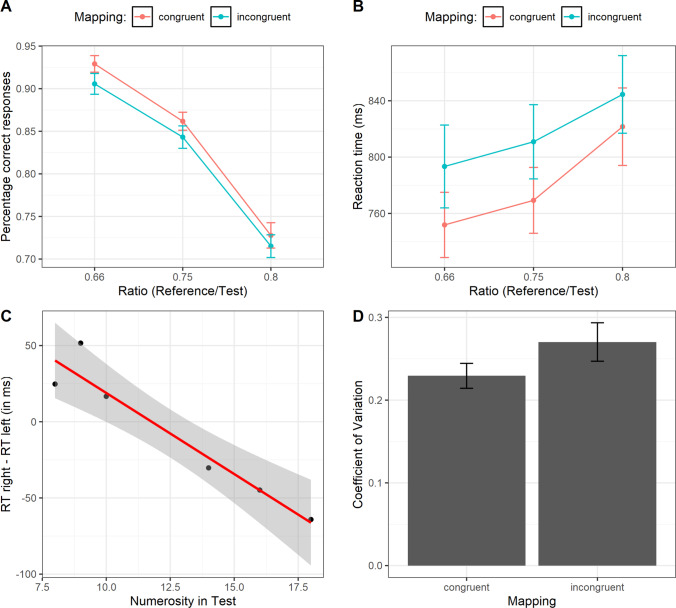
There is an intense debate surrounding the origin of spatial-numerical associations (SNAs), according to which small numbers are mapped onto the left side of the space and large numbers onto the right. Despite evidence suggesting that SNAs would emerge as an innate predisposition to map numerical information onto a left-to-right spatially oriented mental representation, alternative accounts have challenged these proposals, maintaining that such a mapping would be the result of a mere spatial frequency (SF) coding of any visual image. That is, any smaller or larger array of objects would naturally contain more low or high SF information and, accordingly, each hemisphere would be preferentially tuned only for one SF range (e.g., right hemisphere tuned for low SF and left hemisphere tuned for high SF). This would determine the typical SNA (e.g., faster RTs for small numerical arrays with the left hand and for large numerical arrays with the right hand). To directly probe the role of SF coding in SNAs, we tested participants in a typical dot-arrays comparison task with two numerical sets: one in which SFs were confounded with numerosity (Experiment 1) and one in which the full SF power spectrum was equalized across all stimuli, keeping this cue uninformative about numerosity (Experiment 2). We found that SNAs emerged in both experiments, independently of whether SF was confounded or not with numerosity. Taken together, these findings suggest that SNAs cannot simply originate from SF power spectrum alone, and, thus, they rule out the brain's asymmetric SF tuning as a primary cause of such an effect.
Keywords: Hemispheric asymmetries; Numerical processing; Spatial frequency; Spatial–numerical association.
© 2022. The Author(s).
Conflict of interest statement
The authors declare that they have no conflicts of interest.
Figures
References
-
- Adriano A, Girelli L, Rinaldi L. Nonsymbolic numerosity encoding escapes spatial frequency equalization. Psychological Research. 2021;85:3061–3074. - PubMed
-
- Adriano A, Girelli L, Rinaldi L. The ratio effect in visual numerosity comparisons is preserved despite spatial frequency equalisation. Vision Research. 2021;183:41–52. - PubMed
-
- Anobile G, Cicchini GM, Burr DC. Separate mechanisms for perception of numerosity and density. Psychological Science. 2014;25(1):265–270. - PubMed
-
- Anobile G, Cicchini GM, Pomè A, Burr DC. Connecting visual objects reduces perceived numerosity and density for sparse but not dense patterns. Journal of Numerical Cognition. 2017;3(2):133–146.
-
- Bulf H, de Hevia MD, Macchi Cassia V. Small on the left, large on the right: Numbers orient visual attention onto space in preverbal infants. Developmental Science. 2016;19(3):394–401. - PubMed
MeSH terms
LinkOut - more resources
Full Text Sources
Research Materials
