

TCF7L2 transcriptionally regulates Fgf15 to maintain bile acid and lipid homeostasis through gut-liver crosstalk
- PMID: 35133032
- PMCID: PMC9624374
- DOI: 10.1096/fj.202101607R
TCF7L2 transcriptionally regulates Fgf15 to maintain bile acid and lipid homeostasis through gut-liver crosstalk
Erratum in
-
Erratum.FASEB J. 2022 Mar;36(3):e22217. doi: 10.1096/fsb2.22217. FASEB J. 2022. PMID: 35182398 No abstract available.
Abstract
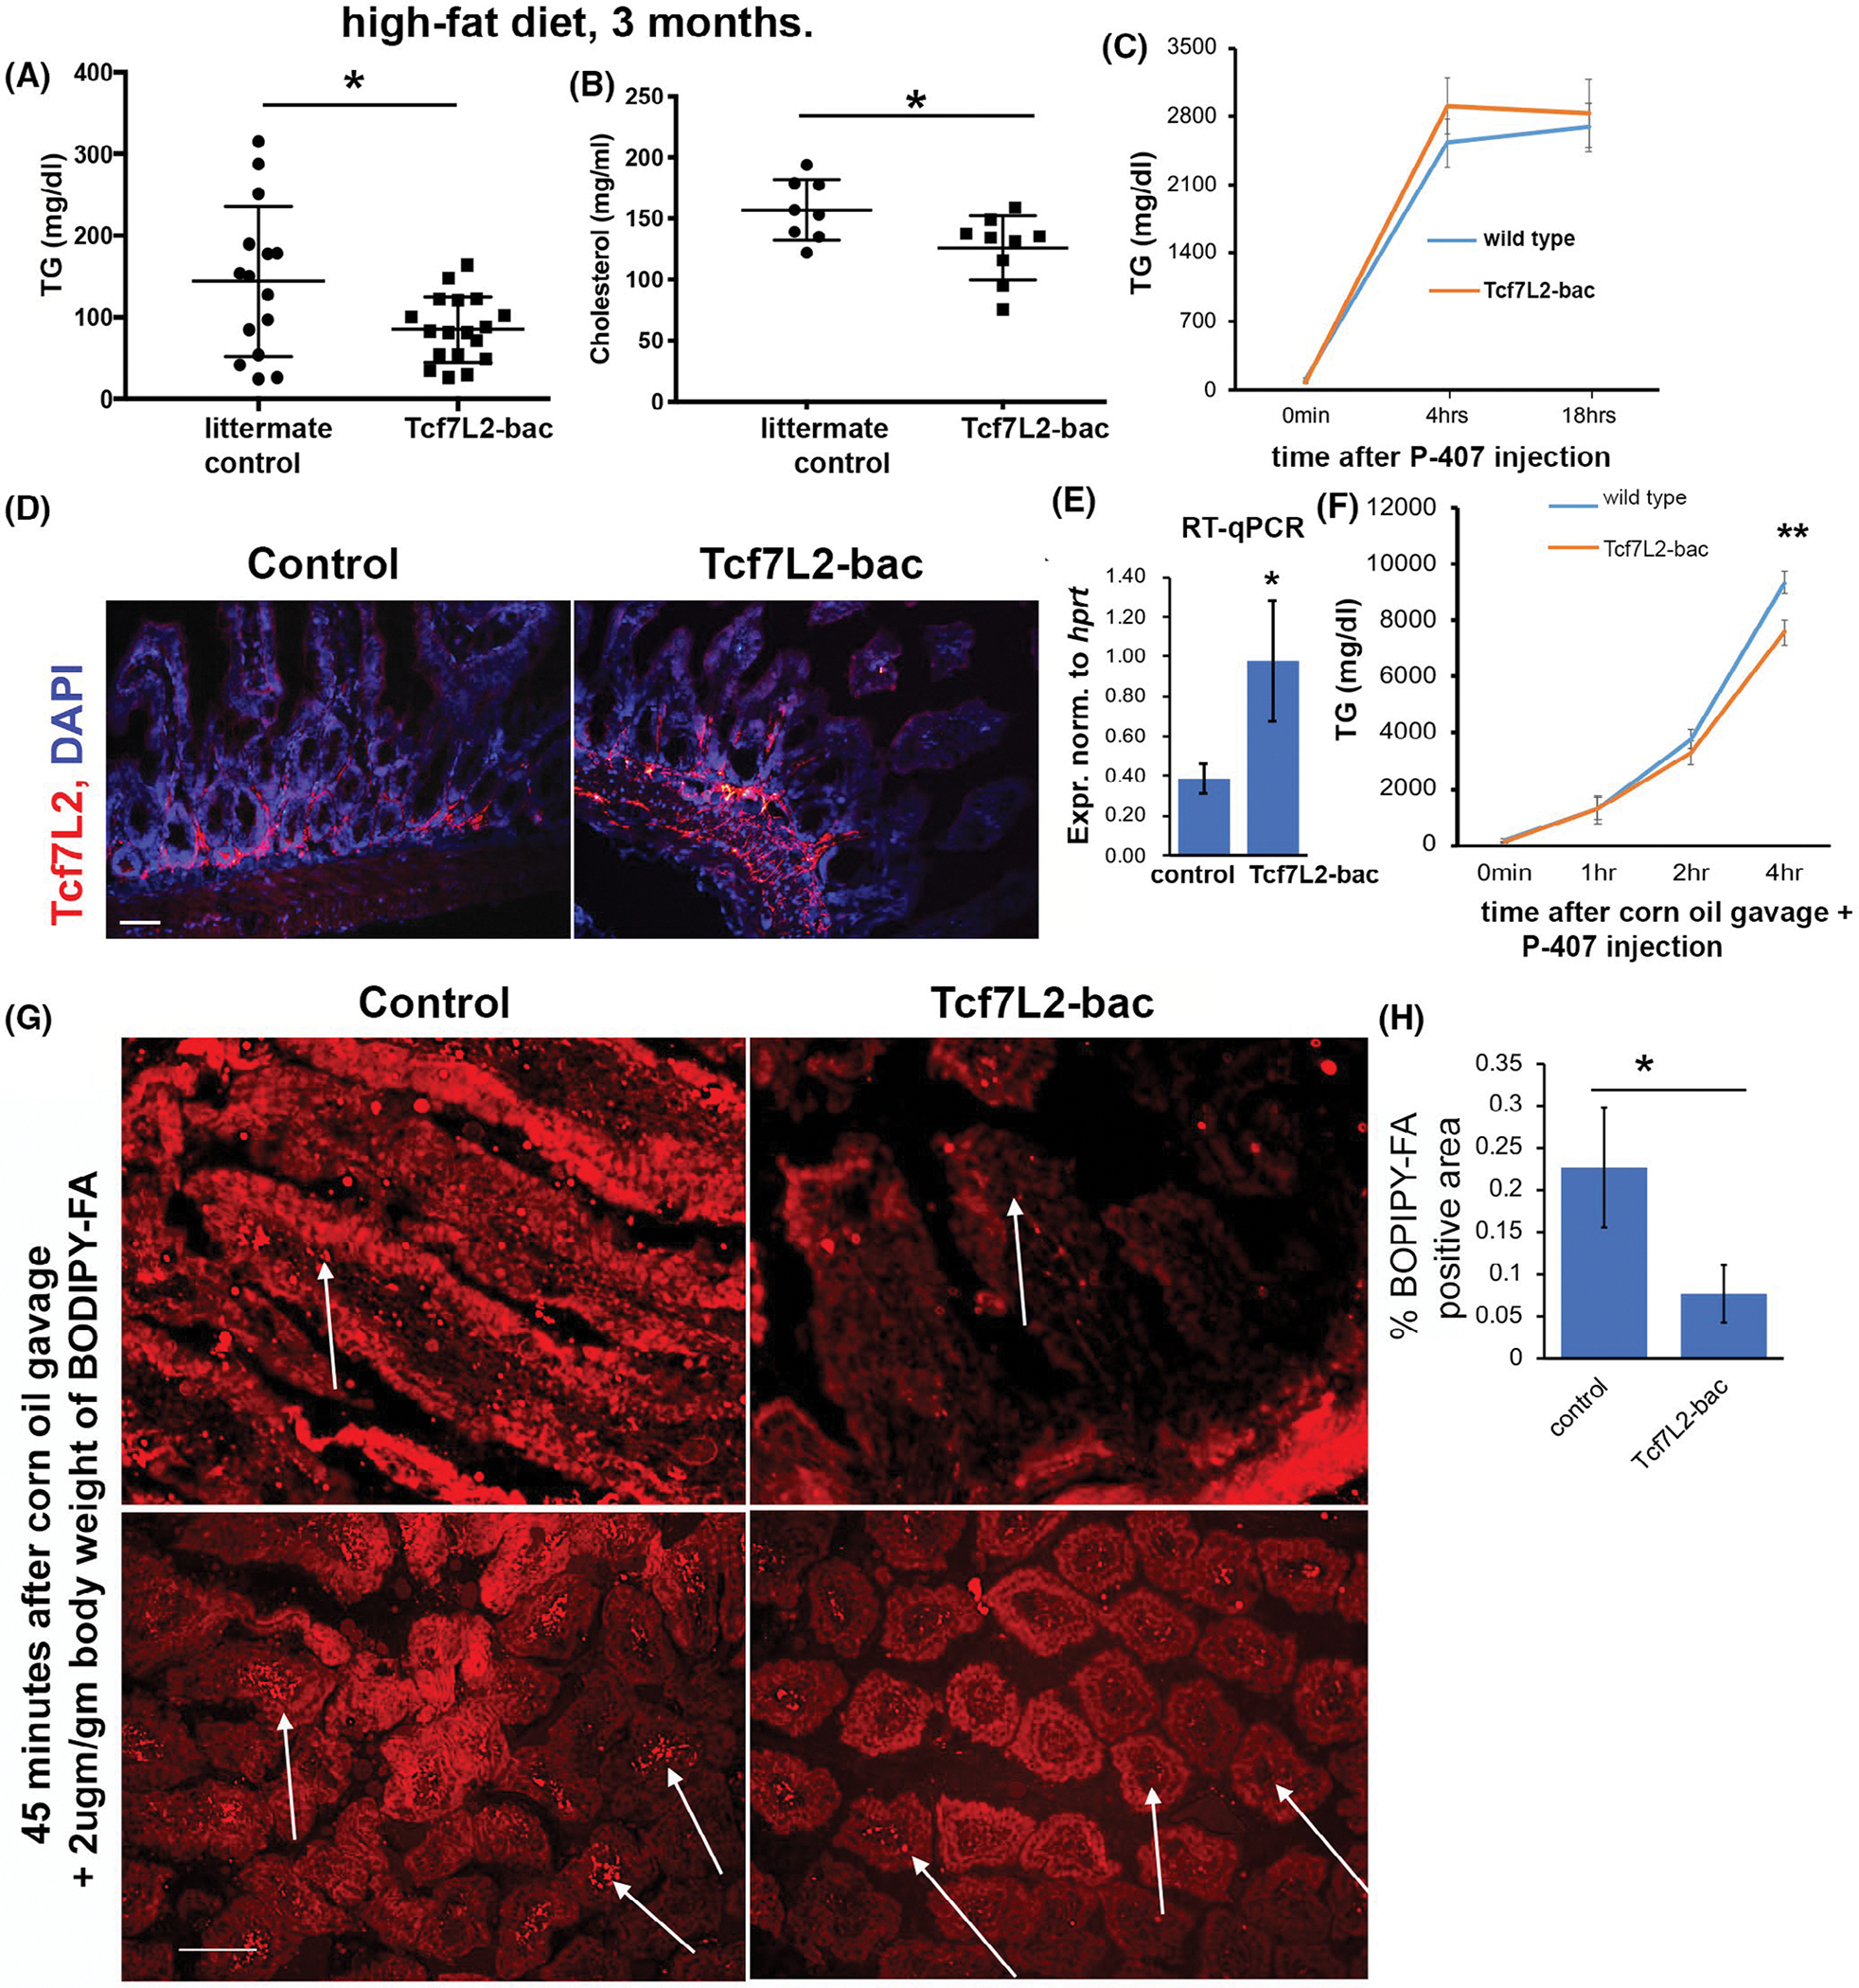
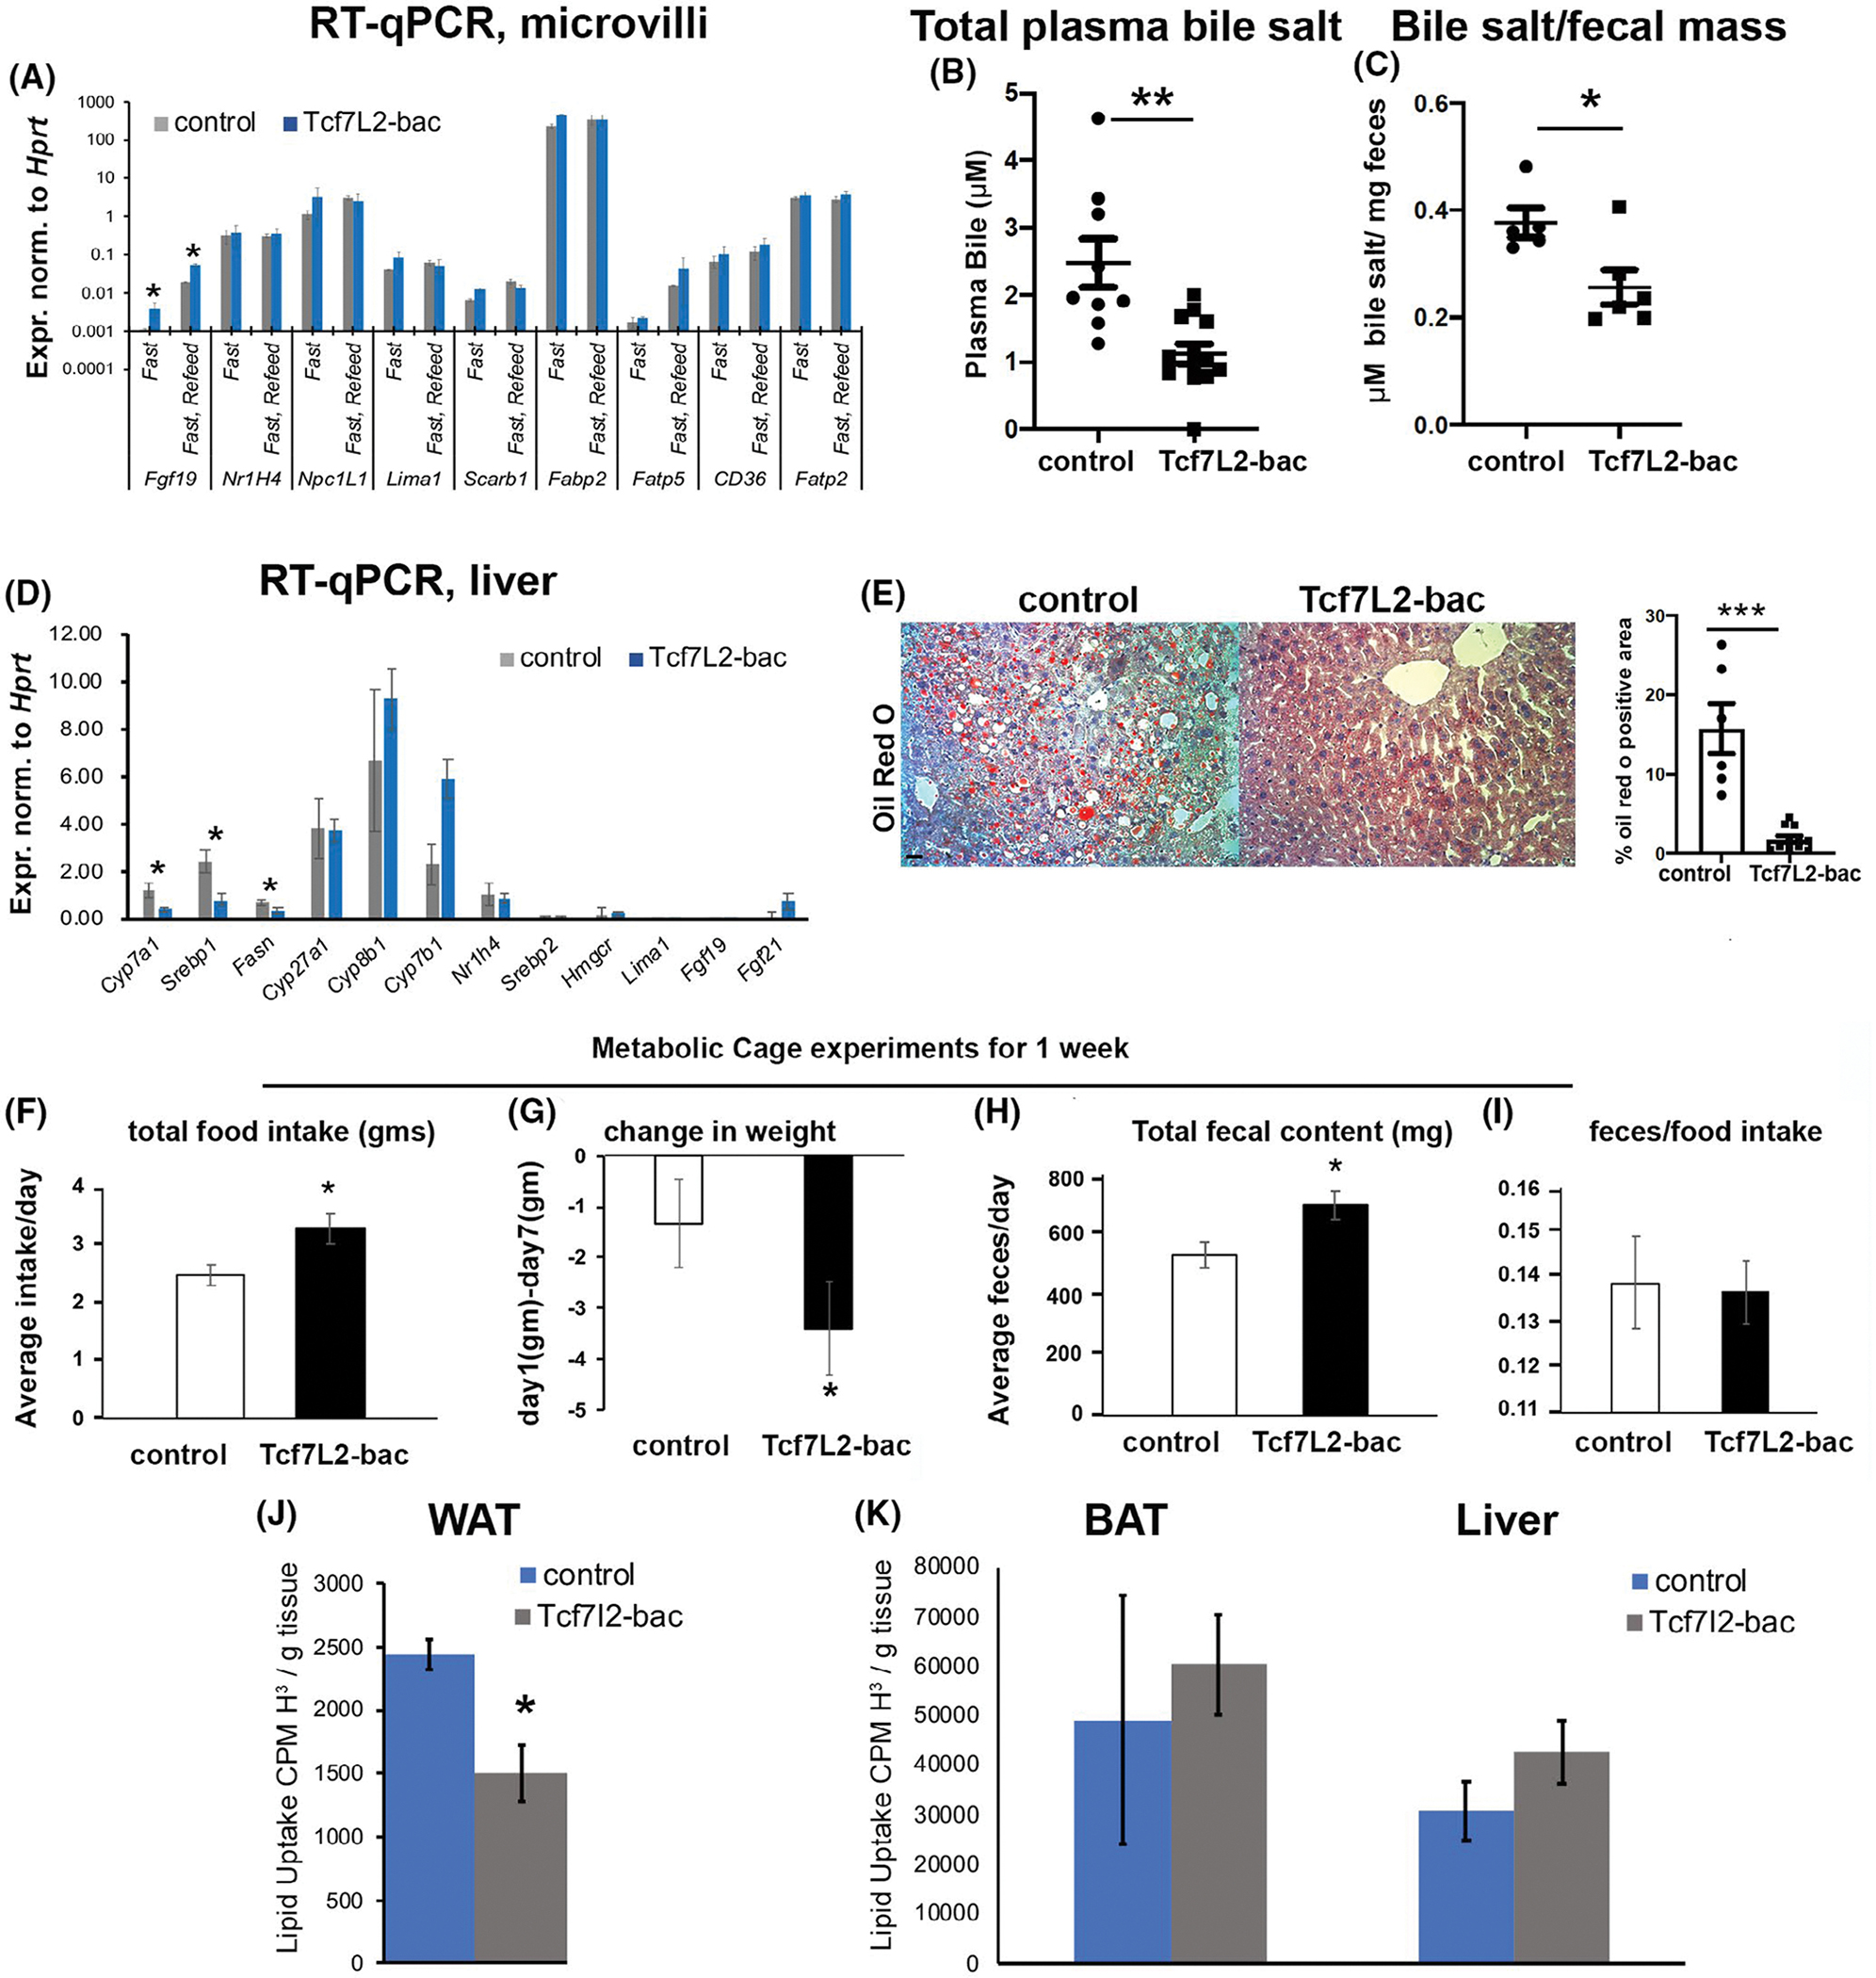
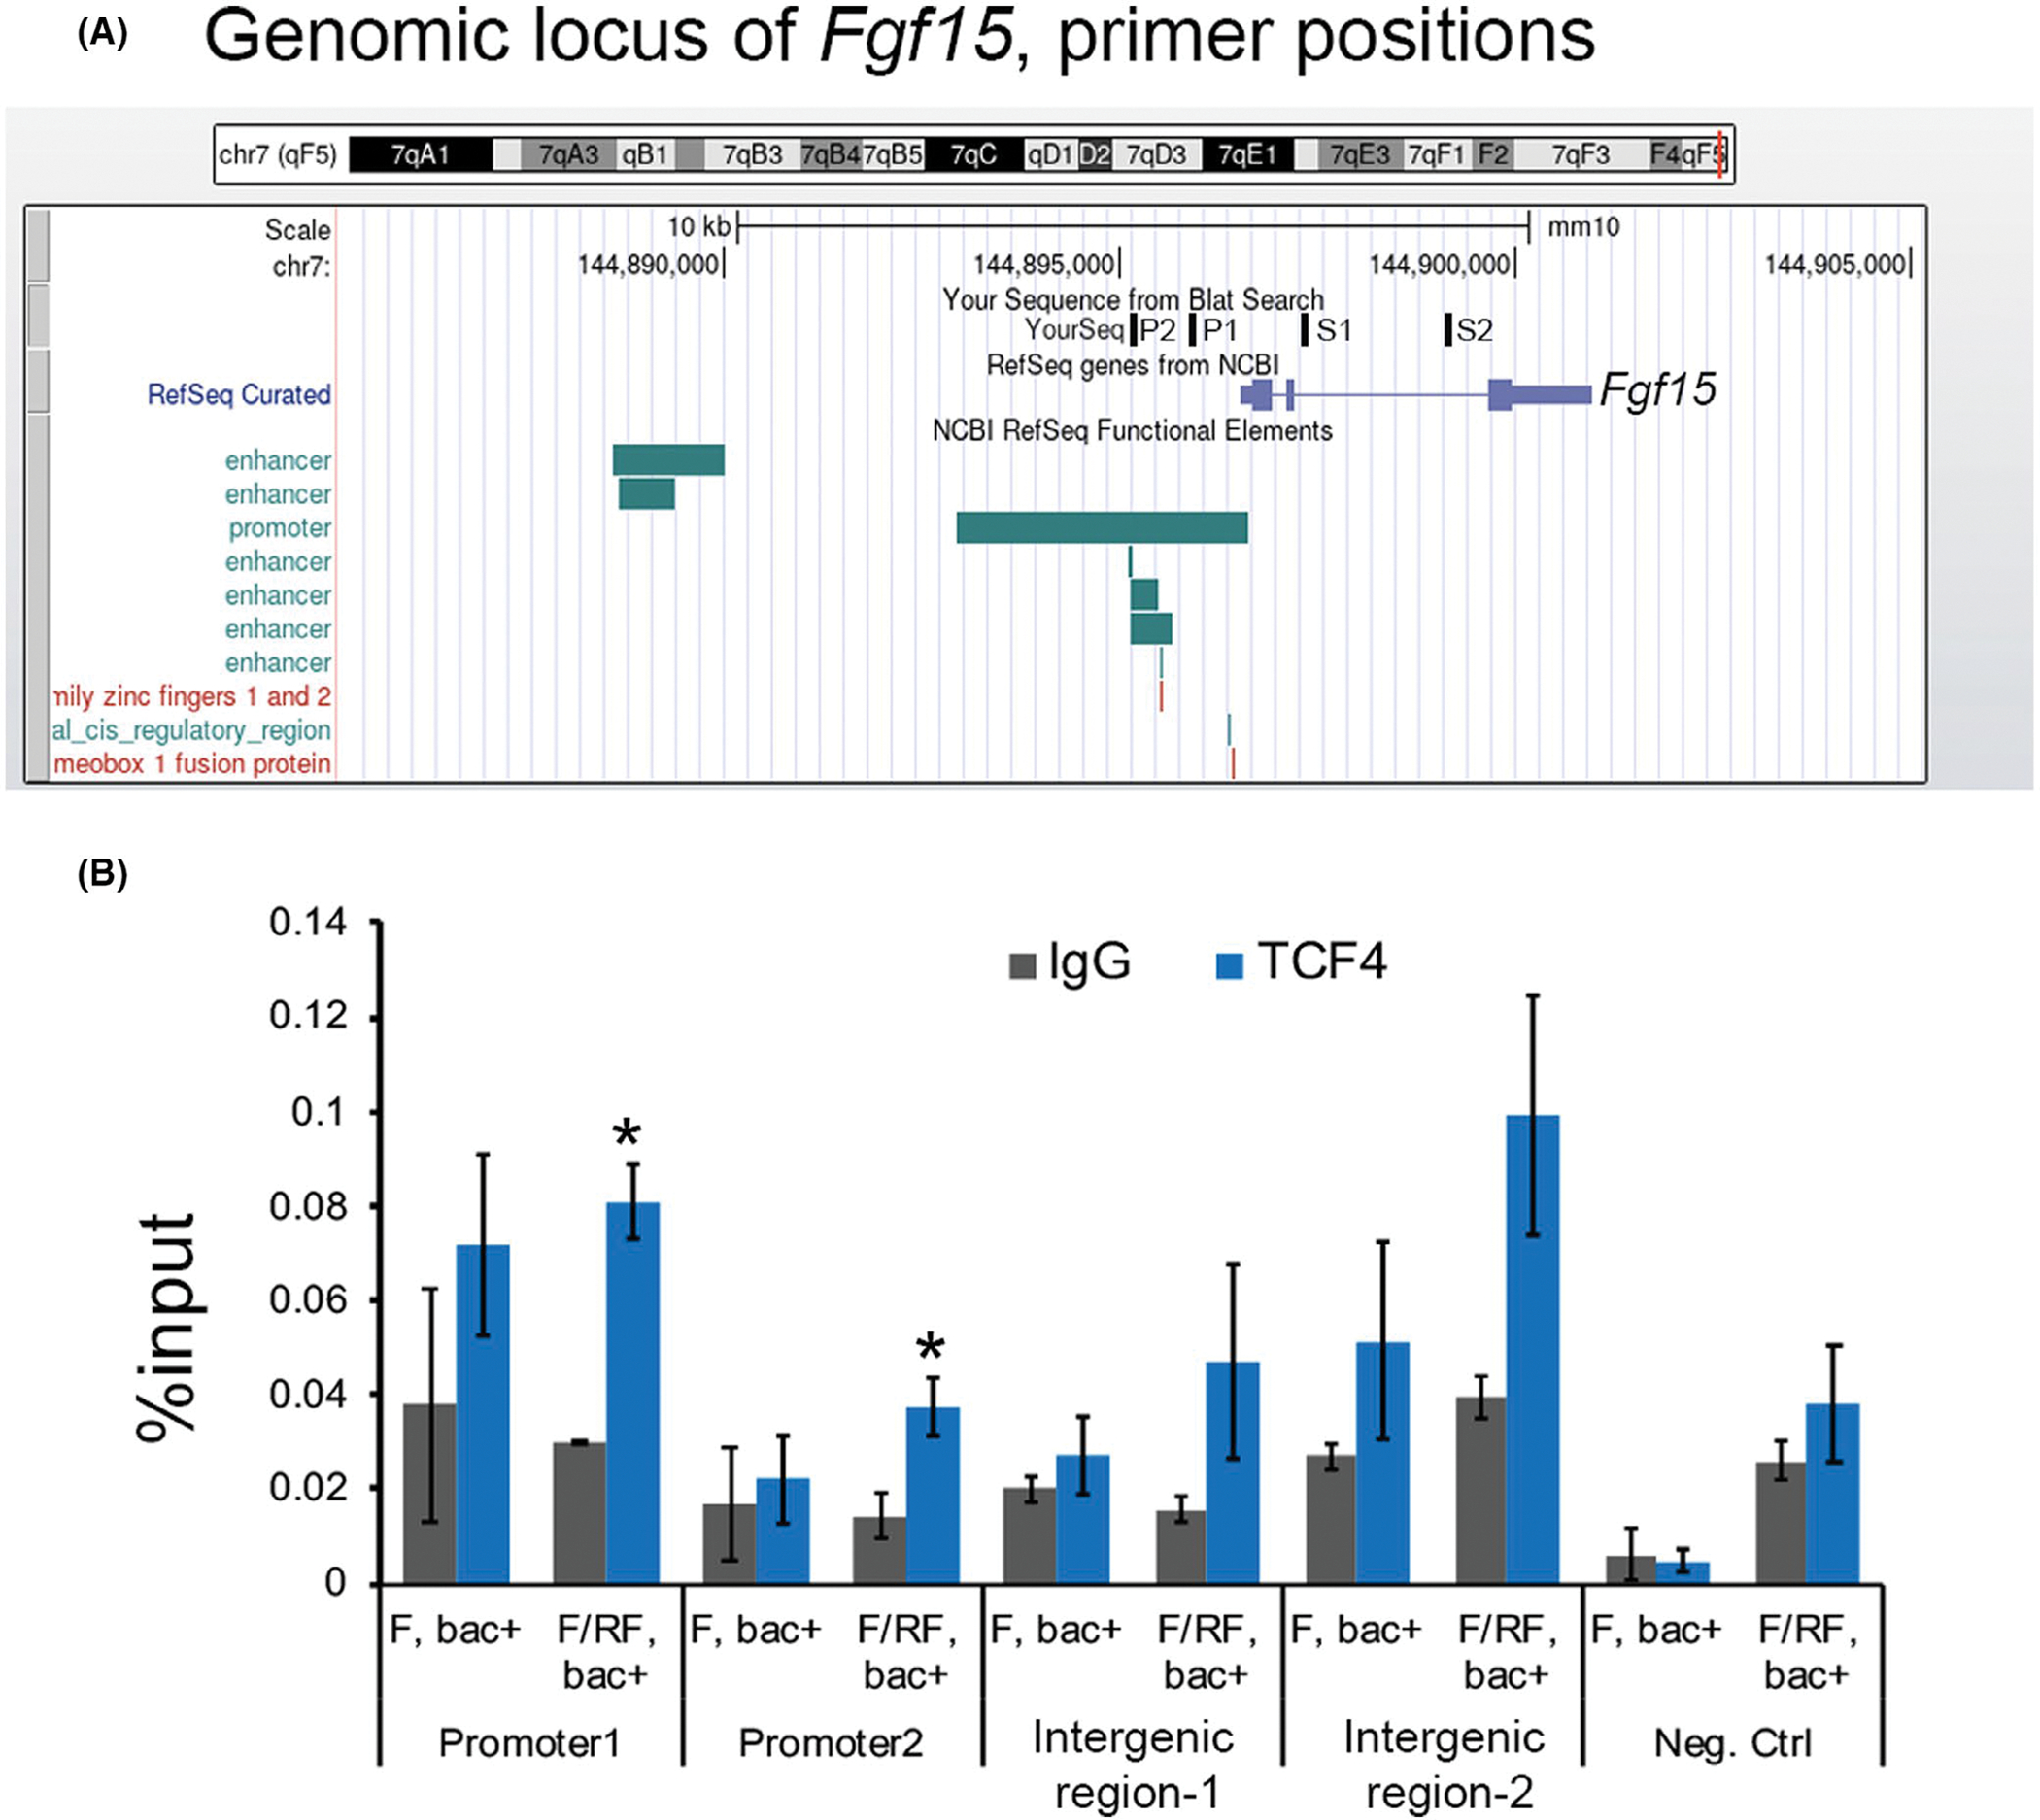
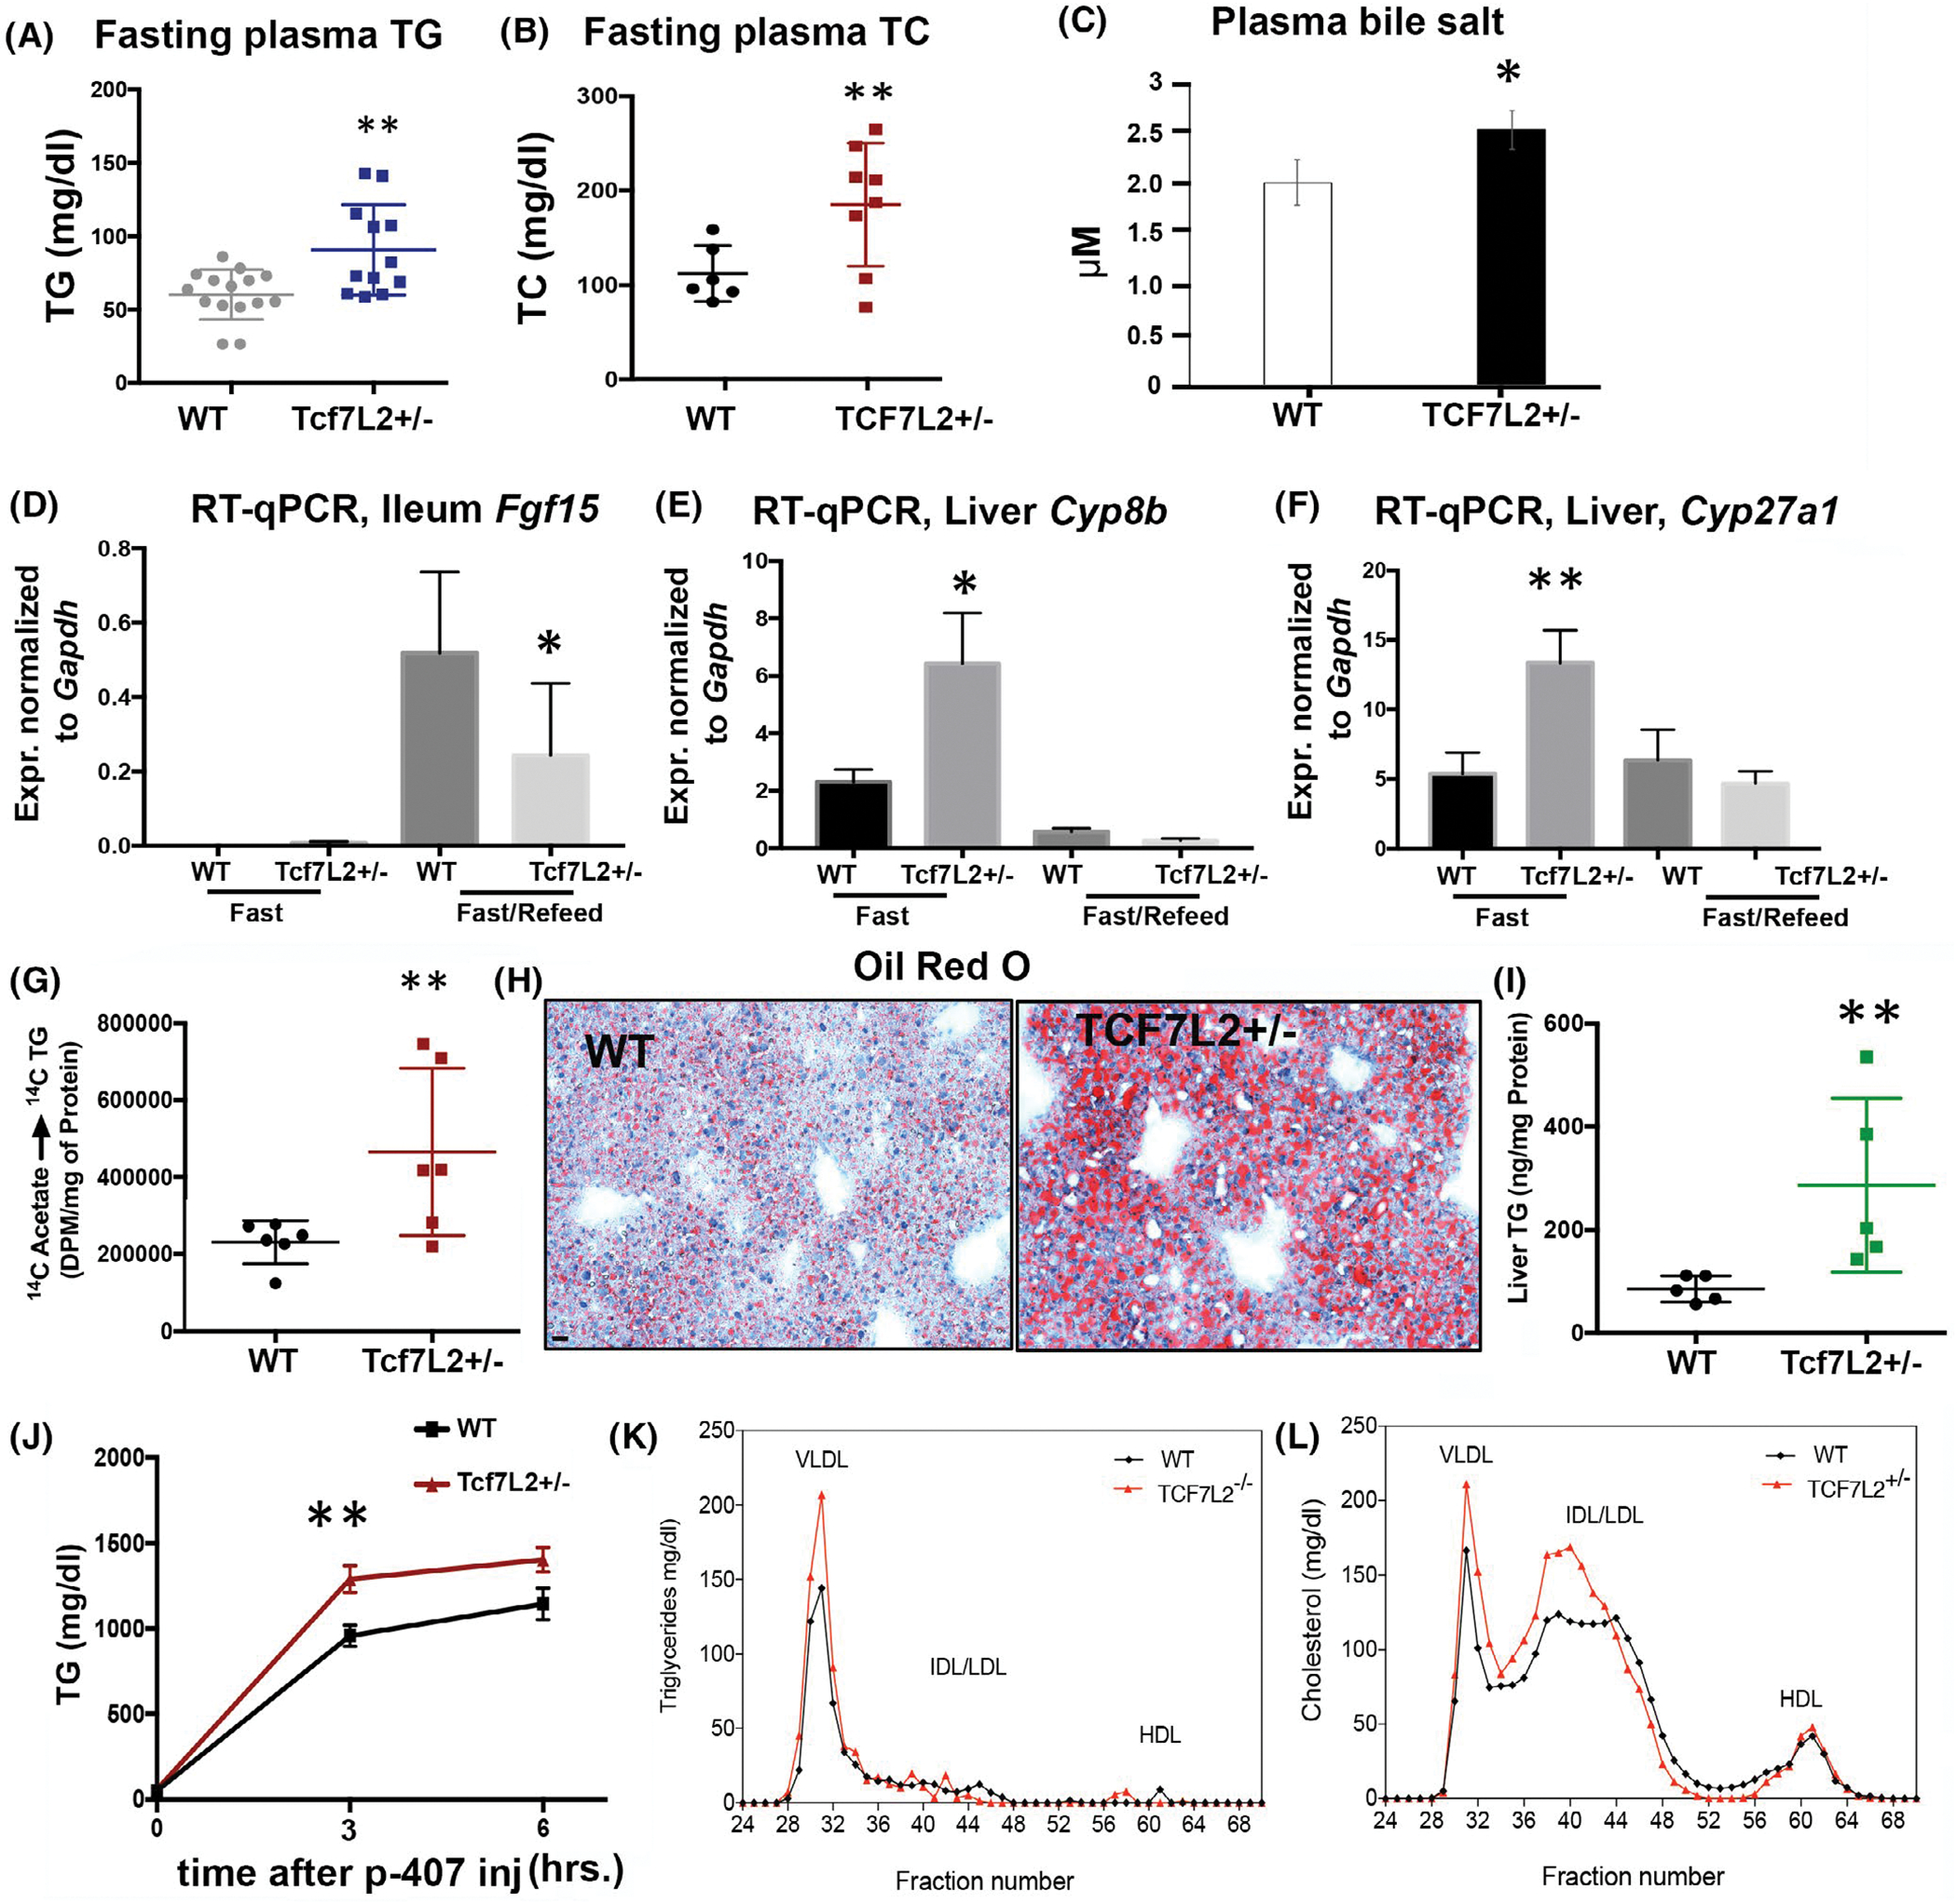
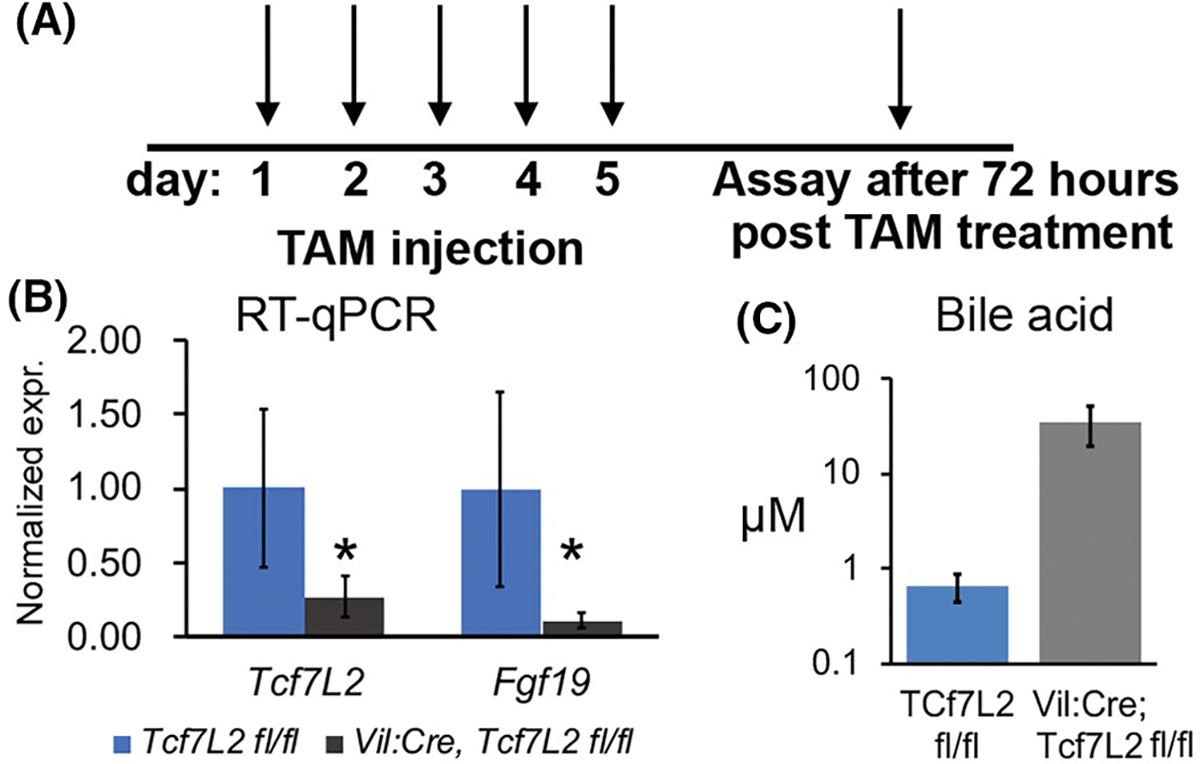
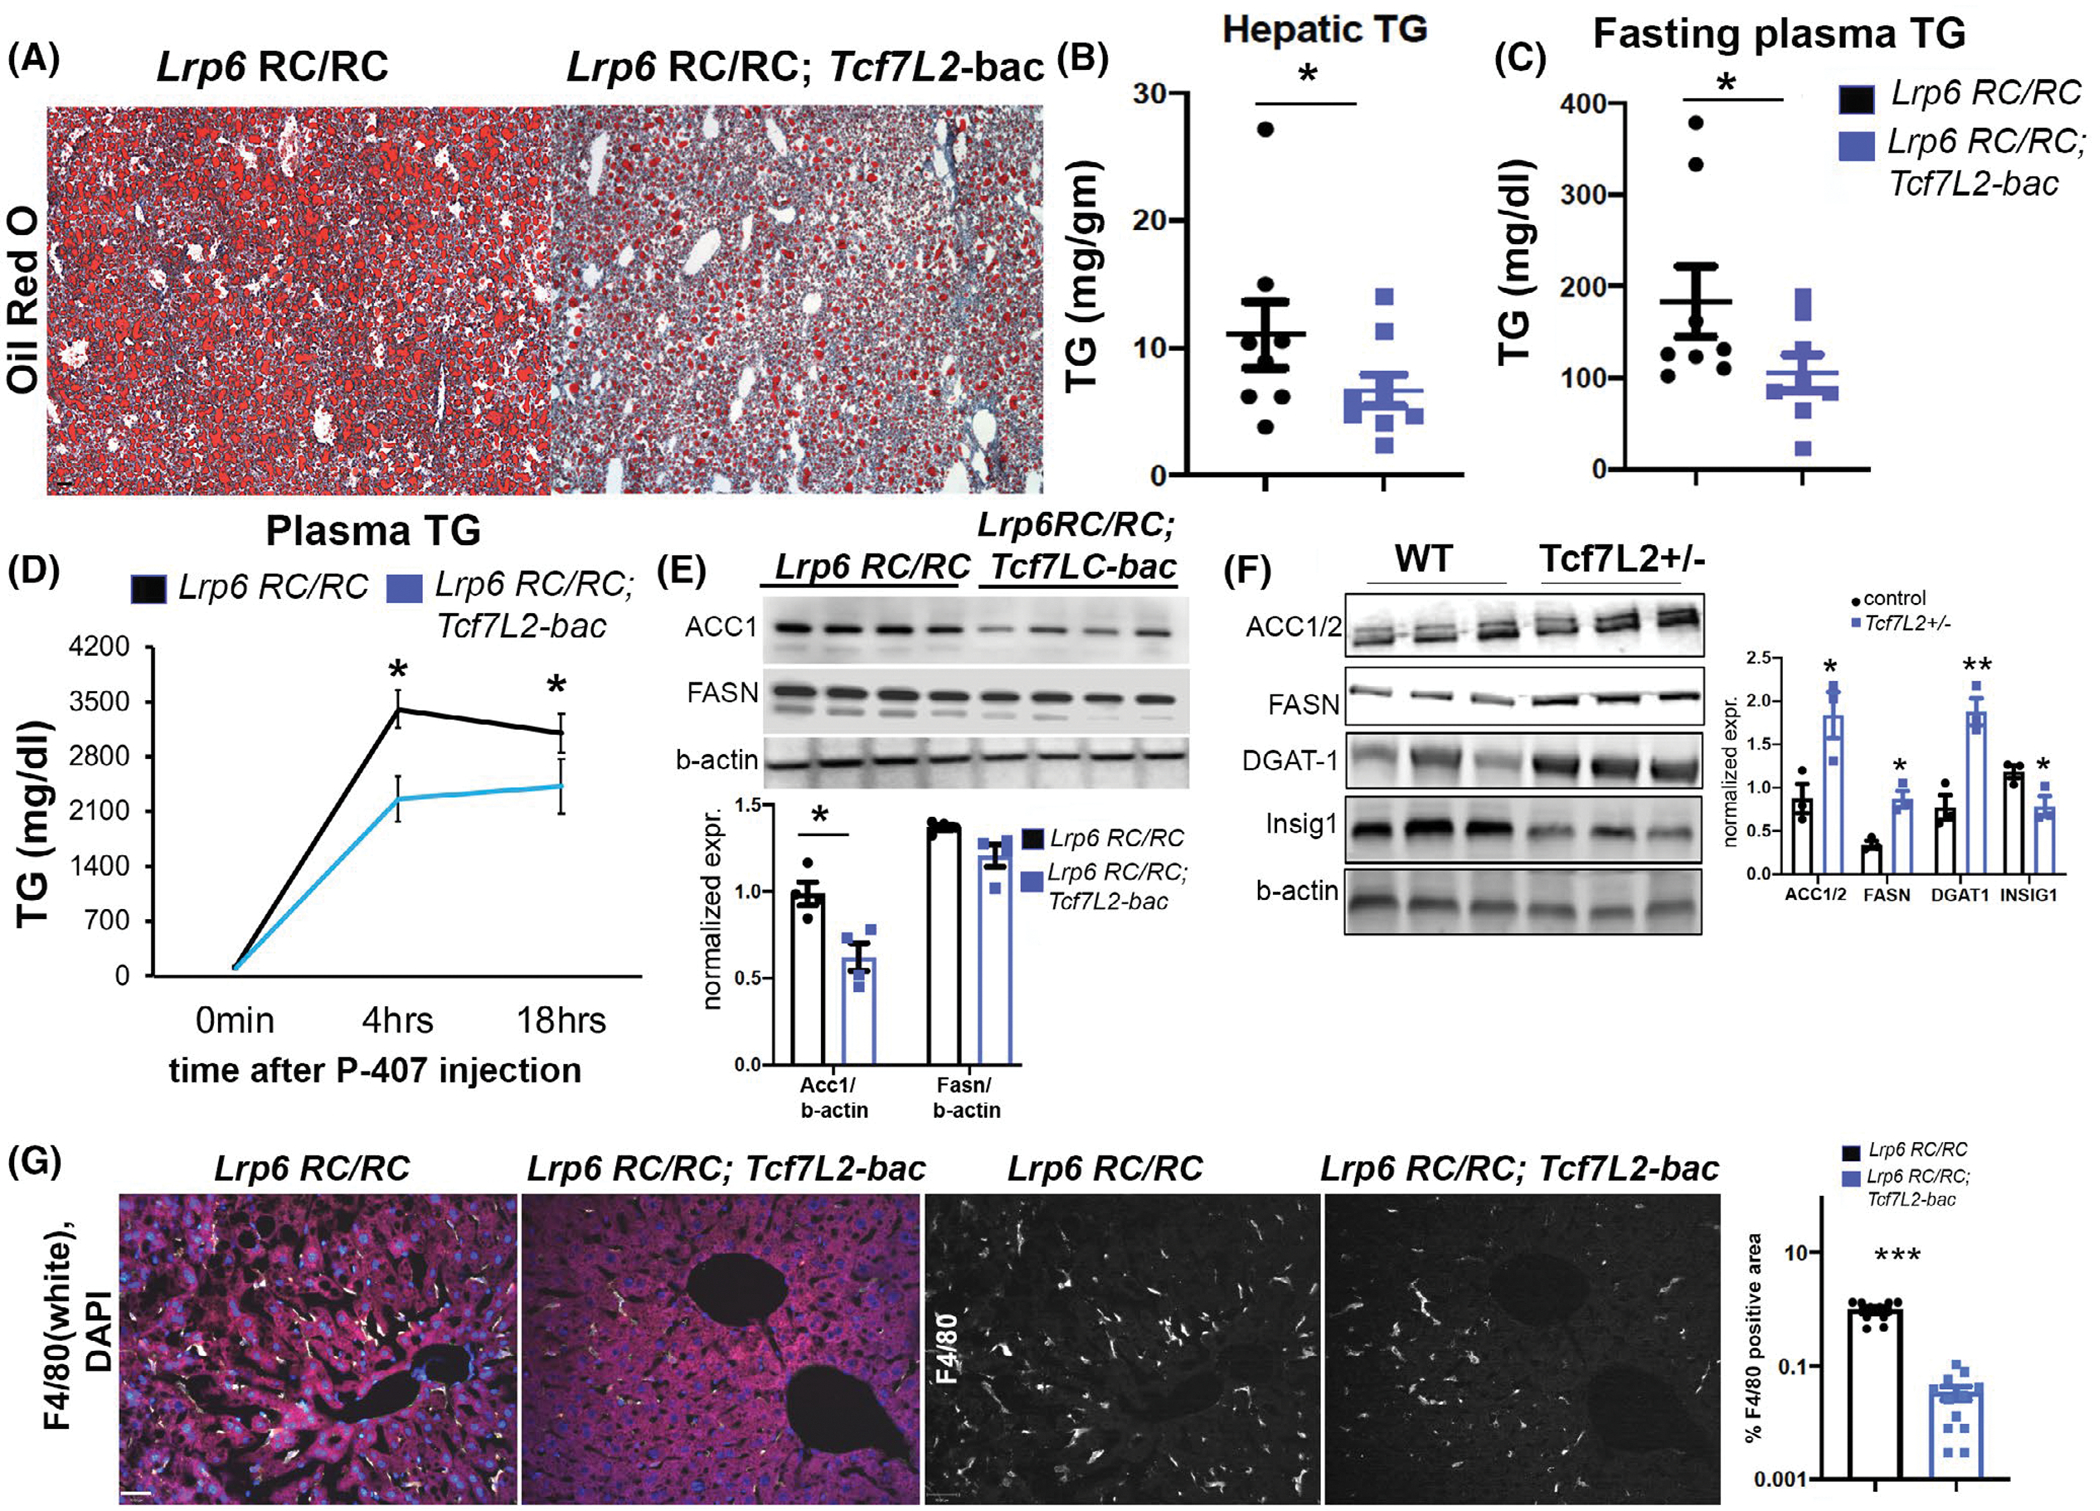
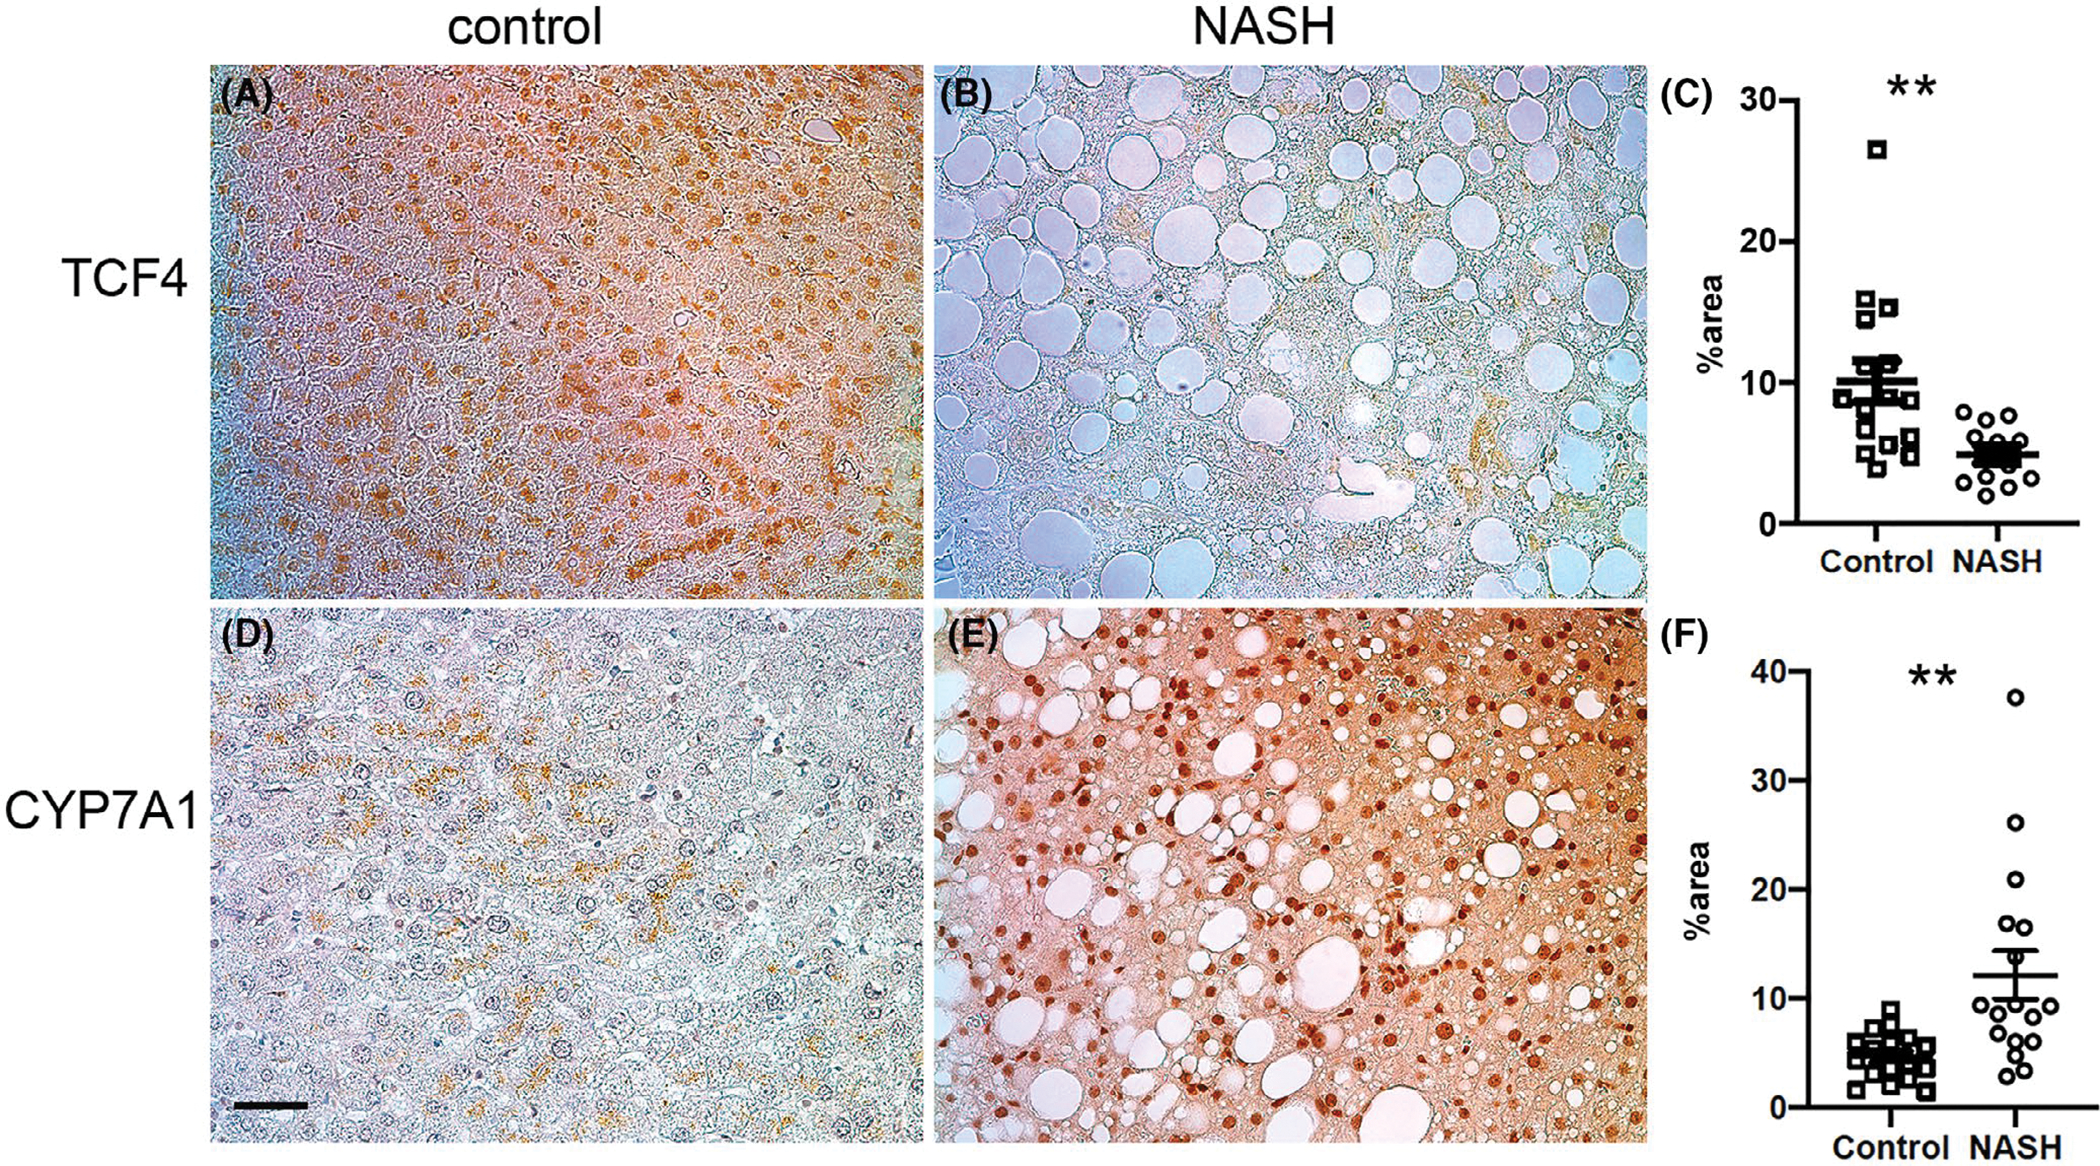
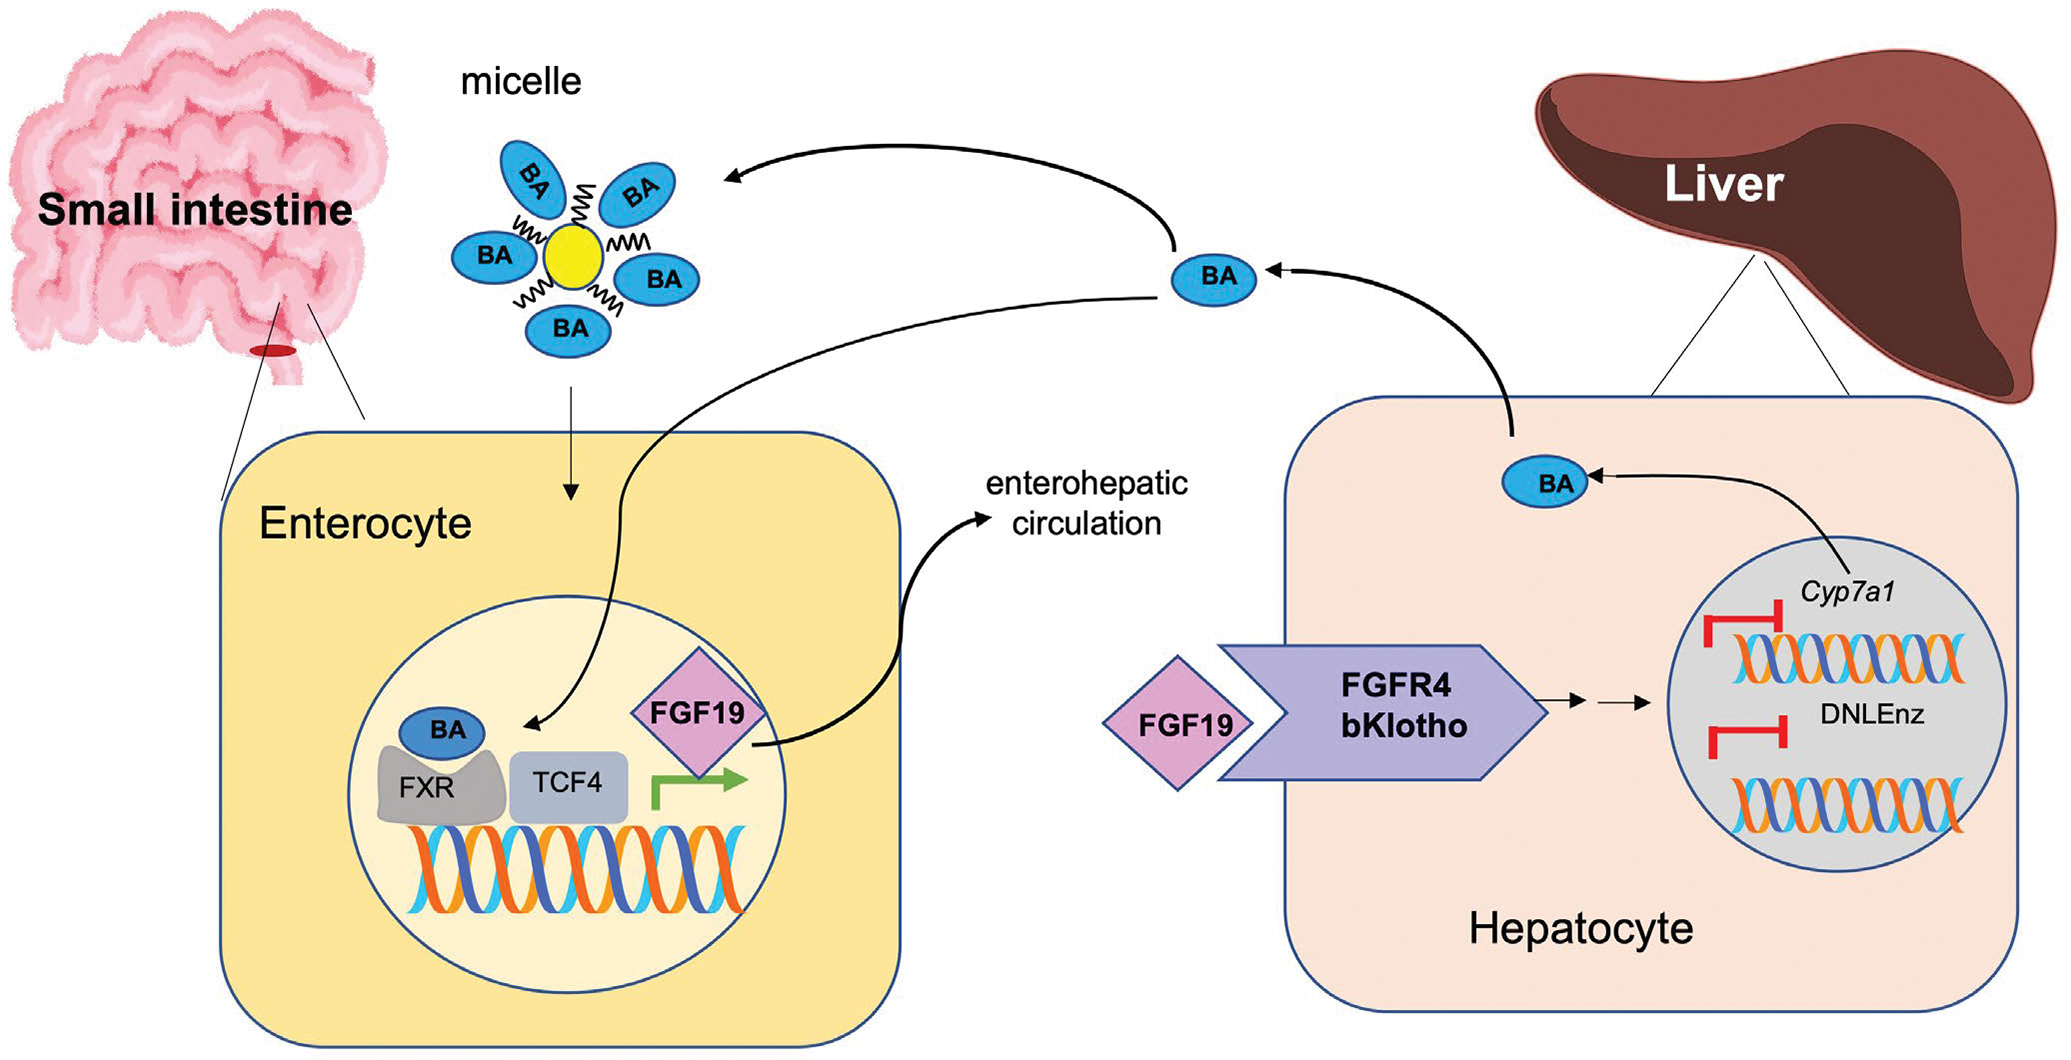
FGF19/FGF15 is an endocrine regulator of hepatic bile salt and lipid metabolism, which has shown promising effects in the treatment of NASH in clinical trials. FGF19/15 is transcribed and released from enterocytes of the small intestine into enterohepatic circulation in response to bile-induced FXR activation. Previously, the TSS of FGF19 was identified to bind Wnt-regulated TCF7L2/encoded transcription factor TCF4 in colorectal cancer cells. Impaired Wnt signaling and specifical loss of function of its coreceptor LRP6 have been associated with NASH. We, therefore, examined if TCF7L2/TCF4 upregulates Fgf19 in the small intestine and restrains NASH through gut-liver crosstalk. We examined the mice globally overexpressing, haploinsufficient, and conditional knockout models of TCF7L2 in the intestinal epithelium. The TCF7L2+/- mice exhibited increased plasma bile salts and lipids and developed diet-induced fatty liver disease while mice globally overexpressing TCF7L2 were protected against these traits. Comprehensive in vivo analysis revealed that TCF7L2 transcriptionally upregulates FGF15 in the gut, leading to reduced bile synthesis and diminished intestinal lipid uptake. Accordingly, VilinCreert2 ; Tcf7L2fl/fl mice showed reduced Fgf19 in the ileum, and increased plasma bile. The global overexpression of TCF7L2 in mice with metabolic syndrome-linked LRP6R611C substitution rescued the fatty liver and fibrosis in the latter. Strikingly, the hepatic levels of TCF4 were reduced and CYP7a1 was increased in human NASH, indicating the relevance of TCF4-dependent regulation of bile synthesis to human disease. These studies identify the critical role of TCF4 as an upstream regulator of the FGF15-mediated gut-liver crosstalk that maintains bile and liver triglyceride homeostasis.
Keywords: Fgf19; NASH; lipid absorption; tcf7l2.
© 2022 Federation of American Societies for Experimental Biology.
Conflict of interest statement
DISCLOSURES
The authors declare no conflict of interest.
Figures
Similar articles
-
Mouse species-specific control of hepatocarcinogenesis and metabolism by FGF19/FGF15.J Hepatol. 2017 Jun;66(6):1182-1192. doi: 10.1016/j.jhep.2017.01.027. Epub 2017 Feb 9. J Hepatol. 2017. PMID: 28189755
-
Hepatic uptake of conjugated bile acids is mediated by both sodium taurocholate cotransporting polypeptide and organic anion transporting polypeptides and modulated by intestinal sensing of plasma bile acid levels in mice.Hepatology. 2017 Nov;66(5):1631-1643. doi: 10.1002/hep.29251. Epub 2017 Sep 29. Hepatology. 2017. PMID: 28498614 Free PMC article.
-
Fibroblast Growth Factor 21 Response in a Preclinical Alcohol Model of Acute-on-Chronic Liver Injury.Int J Mol Sci. 2021 Jul 23;22(15):7898. doi: 10.3390/ijms22157898. Int J Mol Sci. 2021. PMID: 34360670 Free PMC article.
-
Bile Acids as Hormones: The FXR-FGF15/19 Pathway.Dig Dis. 2015;33(3):327-31. doi: 10.1159/000371670. Epub 2015 May 27. Dig Dis. 2015. PMID: 26045265 Free PMC article. Review.
-
Bile acids: regulation of synthesis.J Lipid Res. 2009 Oct;50(10):1955-66. doi: 10.1194/jlr.R900010-JLR200. Epub 2009 Apr 3. J Lipid Res. 2009. PMID: 19346330 Free PMC article. Review.
Cited by
-
Dysregulation of Lipid and Glucose Metabolism in Nonalcoholic Fatty Liver Disease.Nutrients. 2023 May 16;15(10):2323. doi: 10.3390/nu15102323. Nutrients. 2023. PMID: 37242206 Free PMC article. Review.
-
Crosstalk Between Bile Acids and Intestinal Epithelium: Multidimensional Roles of Farnesoid X Receptor and Takeda G Protein Receptor 5.Int J Mol Sci. 2025 Apr 29;26(9):4240. doi: 10.3390/ijms26094240. Int J Mol Sci. 2025. PMID: 40362481 Free PMC article. Review.
-
Histone serotonylation promotes pancreatic cancer development via lipid metabolism remodeling.Nat Commun. 2025 Jul 1;16(1):5947. doi: 10.1038/s41467-025-61197-z. Nat Commun. 2025. PMID: 40593695 Free PMC article.
-
Treatment of liver fibrosis: Past, current, and future.World J Hepatol. 2023 Jun 27;15(6):755-774. doi: 10.4254/wjh.v15.i6.755. World J Hepatol. 2023. PMID: 37397931 Free PMC article. Review.
References
-
- Chalasani N, Younossi Z, Lavine JE, et al. The diagnosis and management of nonalcoholic fatty liver disease: practice guidance from the American Association for the Study of Liver Diseases. Hepatology. 2018;67:328–357. - PubMed
-
- Inagaki T, Choi M, Moschetta A, et al. Fibroblast growth factor 15 functions as an enterohepatic signal to regulate bile acid homeostasis. Cell Metab. 2005;2:217–225. - PubMed
-
- Schreuder TC, Marsman HA, Lenicek M, et al. The hepatic response to FGF19 is impaired in patients with nonalcoholic fatty liver disease and insulin resistance. Am J Physiol Gastrointest Liver Physiol. 2010;298:G440–G445. - PubMed
-
- Jones S Mini-review: endocrine actions of fibroblast growth factor 19. Mol Pharm. 2008;5:42–48. - PubMed
Publication types
MeSH terms
Substances
Grants and funding
LinkOut - more resources
Full Text Sources
Medical
Molecular Biology Databases
