DNA-Mediated Protein Shuttling between Coacervate-Based Artificial Cells
- PMID: 35133040
- PMCID: PMC9303767
- DOI: 10.1002/anie.202115041
DNA-Mediated Protein Shuttling between Coacervate-Based Artificial Cells
Abstract
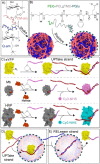
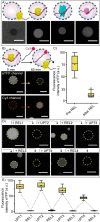
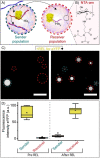
The regulation of protein uptake and secretion is crucial for (inter)cellular signaling. Mimicking these molecular events is essential when engineering synthetic cellular systems. A first step towards achieving this goal is obtaining control over the uptake and release of proteins from synthetic cells in response to an external trigger. Herein, we have developed an artificial cell that sequesters and releases proteinaceous cargo upon addition of a coded chemical signal: single-stranded DNA oligos (ssDNA) were employed to independently control the localization of a set of three different ssDNA-modified proteins. The molecular coded signal allows for multiple iterations of triggered uptake and release, regulation of the amount and rate of protein release and the sequential release of the three different proteins. This signaling concept was furthermore used to directionally transfer a protein between two artificial cell populations, providing novel directions for engineering lifelike communication pathways inside higher order (proto)cellular structures.
Keywords: Coacervates; DNA; Proteins; Supramolecular Signalling; Synthetic Cells.
© 2022 The Authors. Angewandte Chemie International Edition published by Wiley-VCH GmbH.
Conflict of interest statement
The authors declare no conflict of interest.
Figures


Similar articles
-
Supramolecular Nanoscaffolds within Cytomimetic Protocells as Signal Localization Hubs.J Am Chem Soc. 2020 May 20;142(20):9106-9111. doi: 10.1021/jacs.0c01732. Epub 2020 May 7. J Am Chem Soc. 2020. PMID: 32356660 Free PMC article.
-
Spatiotemporal Control Over Protein Release from Artificial Cells via a Light-Activatable Protease.Adv Biol (Weinh). 2025 May;9(5):e2400353. doi: 10.1002/adbi.202400353. Epub 2024 Sep 27. Adv Biol (Weinh). 2025. PMID: 39334525 Free PMC article.
-
Photoswitchable Phase Separation and Oligonucleotide Trafficking in DNA Coacervate Microdroplets.Angew Chem Int Ed Engl. 2019 Oct 7;58(41):14594-14598. doi: 10.1002/anie.201909228. Epub 2019 Sep 5. Angew Chem Int Ed Engl. 2019. PMID: 31408263
-
Biocatalytic self-assembled synthetic vesicles and coacervates: From single compartment to artificial cells.Adv Colloid Interface Sci. 2022 Jan;299:102566. doi: 10.1016/j.cis.2021.102566. Epub 2021 Nov 25. Adv Colloid Interface Sci. 2022. PMID: 34864354 Review.
-
The engineering of artificial cellular nanosystems using synthetic biology approaches.Wiley Interdiscip Rev Nanomed Nanobiotechnol. 2014 Jul-Aug;6(4):369-83. doi: 10.1002/wnan.1265. Epub 2014 Mar 25. Wiley Interdiscip Rev Nanomed Nanobiotechnol. 2014. PMID: 24668724 Review.
Cited by
-
Synthetic Cells Revisited: Artificial Cells Construction Using Polymeric Building Blocks.Adv Sci (Weinh). 2024 Feb;11(8):e2305837. doi: 10.1002/advs.202305837. Epub 2023 Nov 20. Adv Sci (Weinh). 2024. PMID: 37984885 Free PMC article. Review.
-
Biomimetic behaviors in hydrogel artificial cells through embedded organelles.Proc Natl Acad Sci U S A. 2023 Aug 29;120(35):e2307772120. doi: 10.1073/pnas.2307772120. Epub 2023 Aug 21. Proc Natl Acad Sci U S A. 2023. PMID: 37603747 Free PMC article.
-
Complex Coacervate Materials as Artificial Cells.Acc Mater Res. 2023 Feb 13;4(3):287-298. doi: 10.1021/accountsmr.2c00239. eCollection 2023 Mar 24. Acc Mater Res. 2023. PMID: 37009061 Free PMC article.
-
Coacervate Droplets as Biomimetic Models for Designing Cell-Like Microreactors.Macromol Rapid Commun. 2024 Dec;45(24):e2400626. doi: 10.1002/marc.202400626. Epub 2024 Nov 26. Macromol Rapid Commun. 2024. PMID: 39588807 Free PMC article. Review.
-
Tuning interfacial fluidity and colloidal stability of membranized coacervate protocells.Commun Chem. 2024 Jun 3;7(1):122. doi: 10.1038/s42004-024-01193-4. Commun Chem. 2024. PMID: 38831043 Free PMC article.
References
Publication types
MeSH terms
Substances
LinkOut - more resources
Full Text Sources

