. 2022 Apr;113(4):1182-1194.
doi: 10.1111/cas.15294. Epub 2022 Feb 26.

CHIP-associated mutant ASXL1 in blood cells promotes solid tumor progression

Affiliations

CHIP-associated mutant ASXL1 in blood cells promotes solid tumor progression

Xiaoxiao Liu et al. Cancer Sci. 2022 Apr.

Abstract

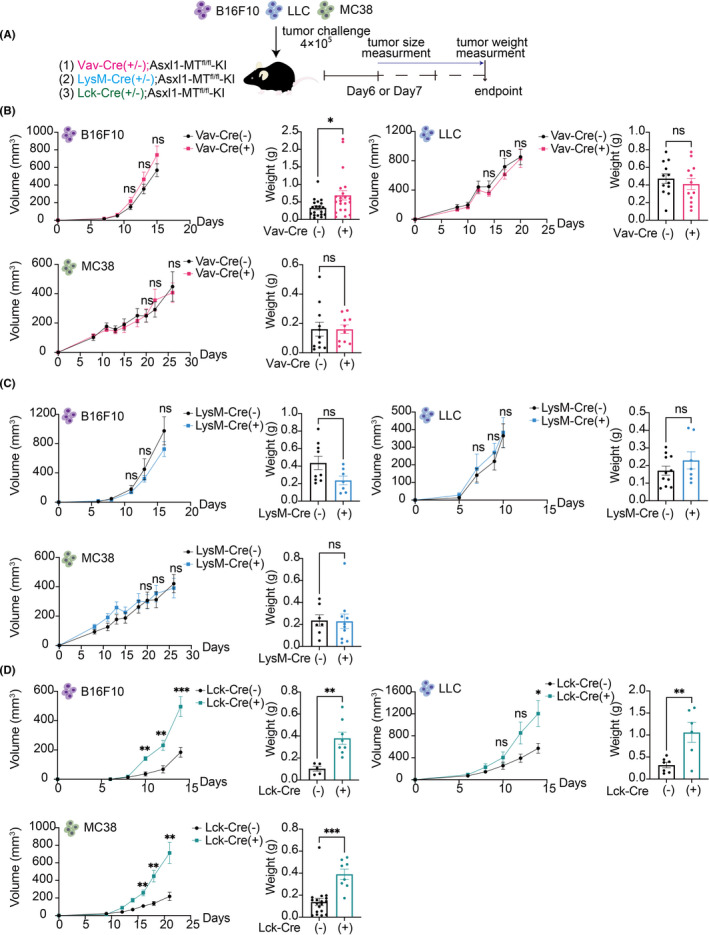
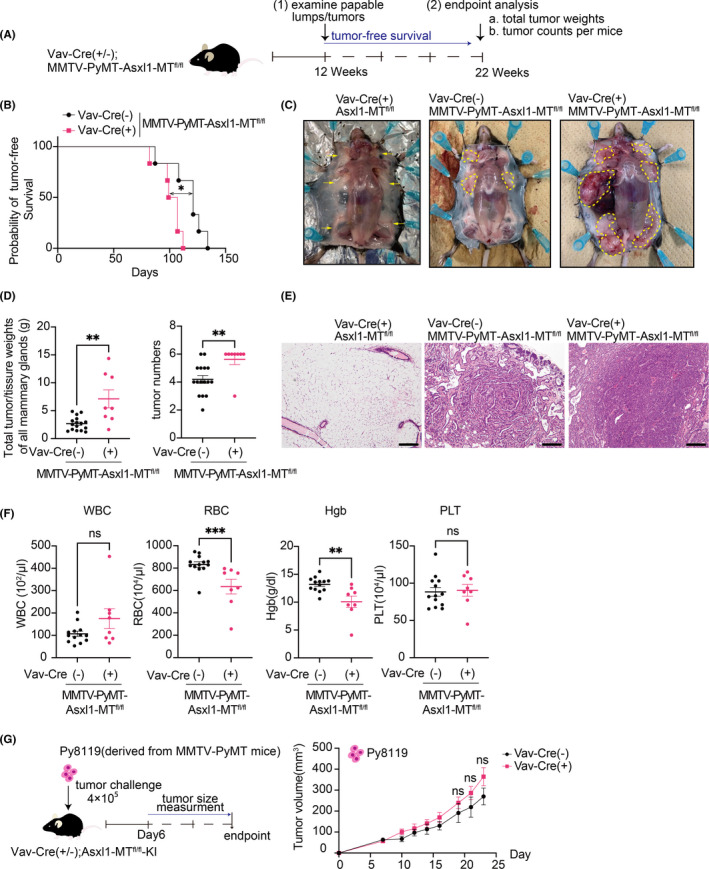
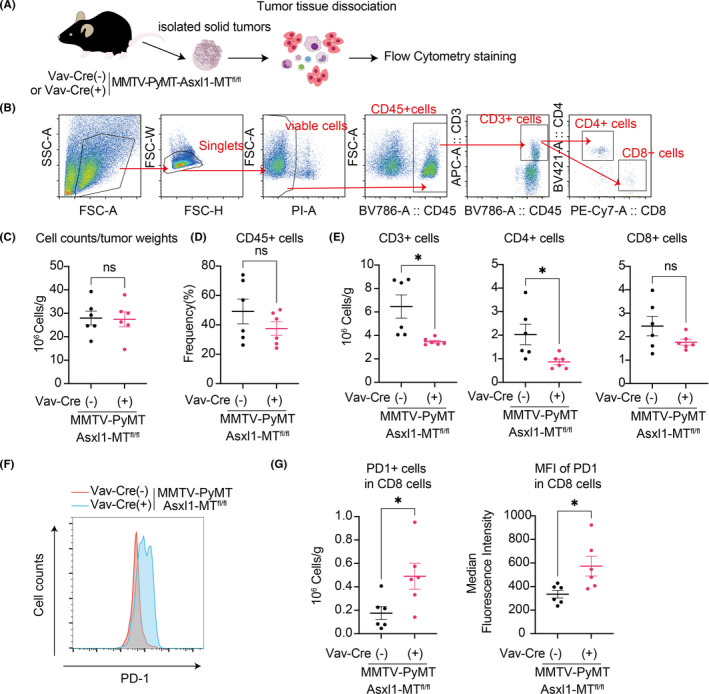
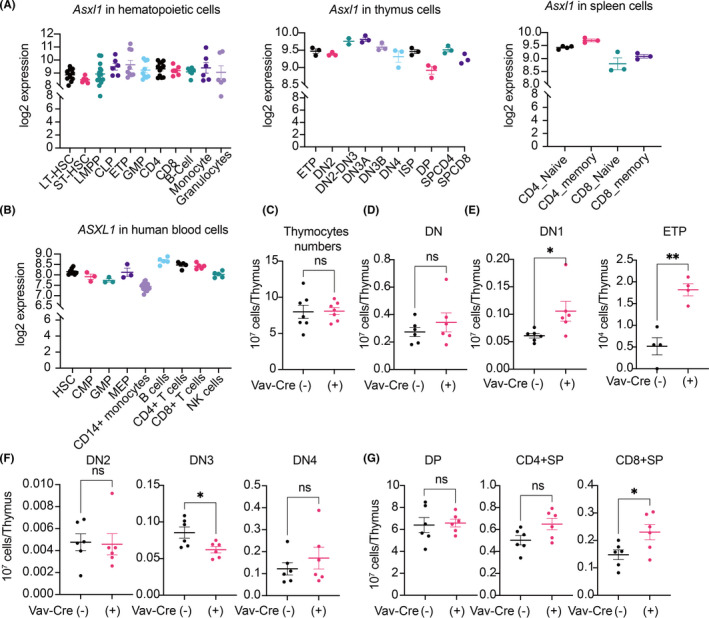
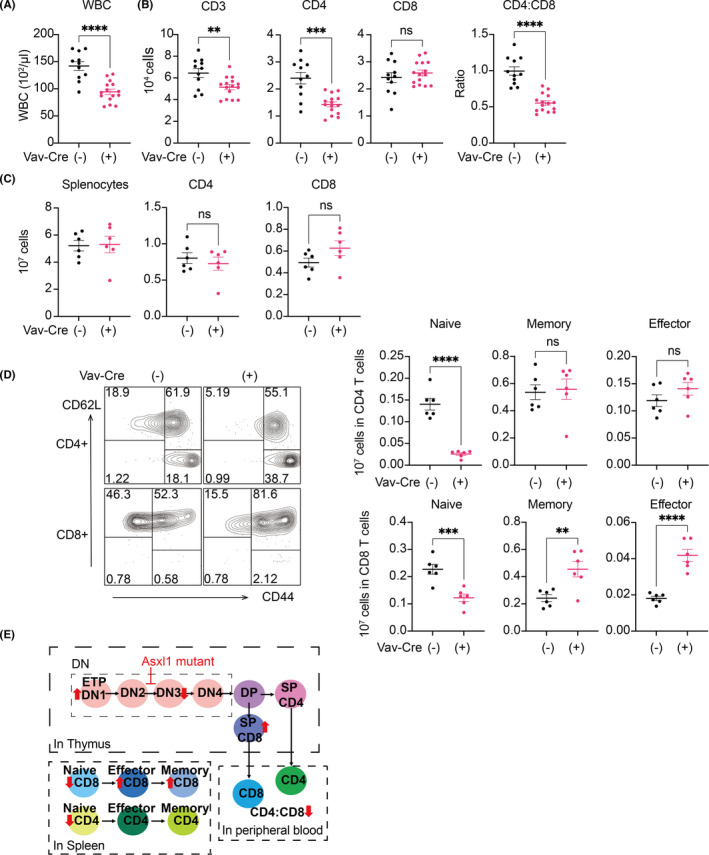
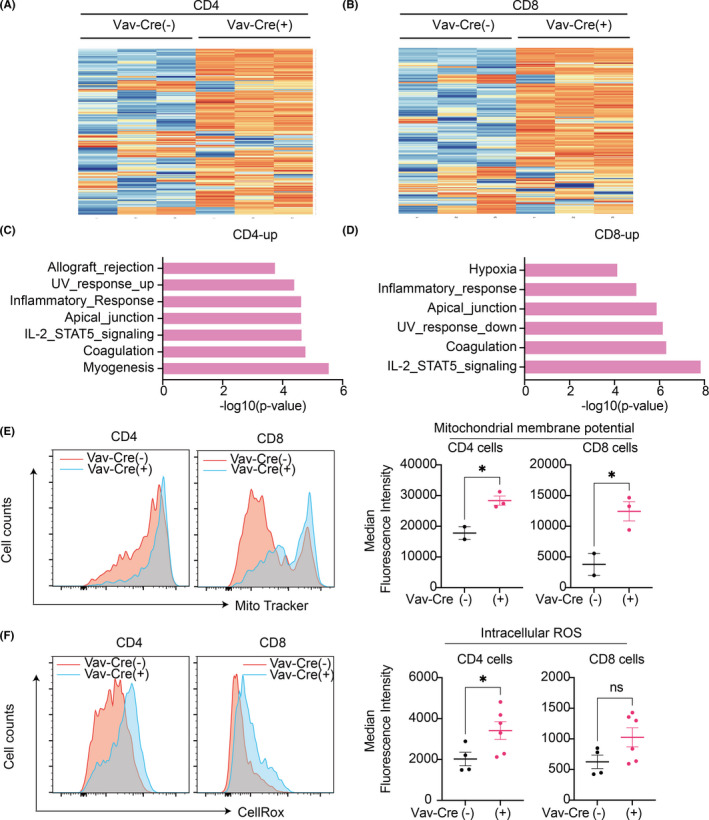
Clonal hematopoiesis of indeterminate potential (CHIP) is an age-associated phenomenon characterized by clonal expansion of blood cells harboring somatic mutations in hematopoietic genes, including DNMT3A, TET2, and ASXL1. Clinical evidence suggests that CHIP is highly prevalent and associated with poor prognosis in solid-tumor patients. However, whether blood cells with CHIP mutations play a causal role in promoting the development of solid tumors remained unclear. Using conditional knock-in mice that express CHIP-associated mutant Asxl1 (Asxl1-MT), we showed that expression of Asxl1-MT in T cells, but not in myeloid cells, promoted solid-tumor progression in syngeneic transplantation models. We also demonstrated that Asxl1-MT-expressing blood cells accelerated the development of spontaneous mammary tumors induced by MMTV-PyMT. Intratumor analysis of the mammary tumors revealed the reduced T-cell infiltration at tumor sites and programmed death receptor-1 (PD-1) upregulation in CD8+ T cells in MMTV-PyMT/Asxl1-MT mice. In addition, we found that Asxl1-MT induced T-cell dysregulation, including aberrant intrathymic T-cell development, decreased CD4/CD8 ratio, and naïve-memory imbalance in peripheral T cells. These results indicate that Asxl1-MT perturbs T-cell development and function, which contributes to creating a protumor microenvironment for solid tumors. Thus, our findings raise the possibility that ASXL1-mutated blood cells exacerbate solid-tumor progression in ASXL1-CHIP carriers.

Keywords: ASXL1; CHIP; T cell; mouse solid-tumor models; tumor immunity.


Figures

FIGURE 1
FIGURE 1
Increased growth of multiple solid tumors in Lck‐Cre; Asxl1‐MTfl/fl mice. A, Schematic diagram of the syngeneic mouse models. Cre(−) and Cre(+) indicate Cre(−/−) and Cre(+/−), respectively. B, The growth curves of tumor volumes (mm3) and endpoint weights (g) of B16F10 [Vav‐Cre(−): n = 33, Vav‐Cre(+): n = 26], LLC [Vav‐Cre(−): n = 12, Vav‐Cre(+): n = 12), and MC38 [Vav‐Cre(−): n = 12, Vav‐Cre(+): n = 10] in control and Vav‐Cre; Asxl1‐MTfl/fl mice. C, The growth curves of tumor volumes and endpoint weights of B16F10 [LysM‐Cre(−): n = 10, LysM‐Cre(+): n = 6], LLC [LysM‐Cre(−): n = 16, LysM‐Cre(+): n = 8], and MC38 [LysM‐Cre(−): n = 7, LysM‐Cre(+): n = 11) in control and LysM‐Cre‐Asxl1‐MTfl/fl mice. D, The growth curves of tumor volumes and endpoint weights of B16F10 [Lck‐Cre(−): n = 5, Lck‐Cre(+): n = 8], LLC (Lck‐Cre(−): n = 7, Lck‐Cre(+): n = 6), and MC38 (Lck‐Cre(−): n = 22, Lck‐Cre(+): n = 8) in control and Lck‐Cre; Asxl1‐MTfl/fl mice. All data are shown as mean ± SEM. Multiple unpaired t test with Welch correction was used for the tumor volumes. Unpaired t test was used for the comparison of the endpoint weights. Two or three independent experiments using littermate mice were performed in a blind manner
FIGURE 2
FIGURE 2
Development of spontaneous mammary tumors was promoted in Vav‐Cre; Asxl1‐MTfl/fl mice. A, Schematic diagram of the spontaneous mammary tumor model. B, Tumor‐free survival curves of MMTV‐PyMT‐Asxl1‐MTfl/fl (n = 6) and Vav‐Cre; MMTV‐PyMT‐Asxl1‐MTfl/fl (n = 6) mice. Log‐rank (Mantel‐Cox) test was used for comparison. C, Representative pictures of the mammary glands. Left: Vav‐Cre; Asxl1‐MTfl/fl mice. Middle: MMTV‐PyMT‐Asxl1‐MTfl/fl mice. Right: Vav‐Cre; MMTV‐PyMT‐Asxl1‐MTfl/fl mice. Yellow arrows indicate mammary glands, and the tumors were circled with yellow dotted lines. D, Left: total tumor/tissue weights of all mammary glands per mouse (MMTV‐PyMT‐Asxl1‐MTfl/fl: n = 16, Vav‐Cre; MMTV‐PyMT‐Asxl1‐MTfl/fl: n = 10). Right: numbers of tumors per mouse (MMTV‐PyMT‐Asxl1‐MTfl/fl: n = 16, Vav‐Cre; MMTV‐PyMT‐Asxl1‐MTfl/fl: n = 8). E, Representative pictures of H&E staining of the mammary glands in Vav‐Cre; Asxl1‐MTfl/fl (left), MMTV‐PyMT‐Asxl1‐MTfl/fl (middle), and Vav‐Cre; MMTV‐PyMT‐Asxl1‐MTfl/fl (right) mice at day 148. The scale bar is 200 μm F, Complete blood count (CBC) of peripheral blood collected from the mice at their endpoint (MMTV‐PyMT‐Asxl1‐MTfl/fl: n = 13, Vav‐Cre; MMTV‐PyMT‐Asxl1‐MTfl/fl: n = 8). Hgb, hemoglobin; PLT, platelet; RBC, red blood cells; WBC, white blood cells.. Data are shown as mean ± SEM. Mann Whitney t test was used for the comparison. G, Schematic diagram of the syngeneic mouse models (left). Mice were sacrificed at day 24. The growth curves of tumor volumes (mm3) of Py8119 [Vav‐Cre(−): n = 9, Vav‐Cre(+): n = 10] in control and Vav‐Cre; Asxl1‐MTfl/fl mice (Right). Data are shown as mean ± SEM. Multiple unpaired t test with Welch correction was used for the tumor volumes
FIGURE 3
FIGURE 3
Intratumor analysis in the MMTV‐PyMT mice. A, Schematic diagram of intratumor analysis using flow cytometry. B, The gating strategy of intratumor T cells. Mammary tumors were collected from the MMTV‐PyMT‐Asxl1‐MTfl/fl [Vav‐Cre(−)] mice and Vav‐Cre; MMTV‐PyMT‐Asxl1‐MTfl/fl [Vav‐Cre(+)] mice. C–E, Total cell numbers per gram of tumors (C); the frequency of infiltrated CD45+ cells (D); and numbers of tumor‐infiltrated CD3+, CD4+, and CD8+ T cells per gram of tumors (E). F, Representative FACS plots of PD‐1+ in tumor‐infiltrated CD8+ T cells. G, Numbers of PD1+ cells in tumor‐infiltrated CD8+ T cells per gram of tumors (left) and the median fluorescence intensity (right) are shown. Data are shown as mean ± SEM. Unpaired t test was used for the comparison
FIGURE 4
FIGURE 4
Asxl1‐MT perturbs T‐cell development in the thymus. A, B, Log2 expression of murine Asxl1 in normal hematopoietic cells, thymocytes, and splenocytes (A) and that of ASXL1 in human normal hematopoietic cells (B). Data were exported from the bloodspot website (https://servers.binf.ku.dk/bloodspot/). C–G, Total numbers of thymocytes (C); numbers of CD4CD8 double‐negative (DN) cells (D); numbers of CD4CD8CD44+CD25 DN1 cells and LineageCD4CD8CD44+ ckit+ CD25 ETP cells (E); numbers of CD4CD8CD44+CD25+ DN2, CD4CD8CD44CD25+ DN3, and CD4CD8CD44CD25 DN4 cells (F); and numbers of CD4+CD8+ DP, CD4+CD8 SP, and CD4CD8+ SP cells (G) in thymus of Asxl1‐MTfl/fl [Vav‐Cre(−)] and Vav‐Cre; Asxl1‐MTfl/fl [Vav‐Cre(+)] mice are shown. Data are shown as mean ± SEM. Unpaired t test was used for the comparison
FIGURE 5
FIGURE 5
Asxl1‐MT perturbs peripheral T‐cell development and naïve T‐cell maintenance. A, Complete blood count of white blood cells (WBC) in peripheral blood collected from Asxl1‐MTfl/fl [Vav‐Cre(−)] and Vav‐Cre; Asxl1‐MTfl/fl [Vav‐Cre(+)] mice. B, Cell counts of CD3+, CD4+, and CD8+ T cells and CD4/CD8 ratio in peripheral blood. C, Cells counts of the whole splenocytes and CD4+ and CD8+ T cells in spleen. D, Cell counts of naïve (CD62L+ CD44), effector (CD62LCD44+), and memory (CD62L+CD44+) fractions in CD4+ and CD8+ T cells in spleen. Representative FACS plots (left) and their quantification (right) are shown. Data are shown as mean ± SEM. Unpaired t test was used for the comparison. E, The scheme of the effect of Asxl1‐MT in thymic and peripheral T‐cell development
FIGURE 6
FIGURE 6
Mutant ASXL1 induces inflammation and mitochondrial dysregulation in T cells. A, B, Hierarchical clustering of the RNA‐Seq data of CD4+ (A) and CD8+(B) T cells. Top 200 most viable genes and comparison of control [Vav‐Cre(−)] and Vav‐Cre; Asxl1‐MTfl/fl [Vav‐Cre(+)] mice are shown (n = 3 per group). C, D, Gene set enrichment analysis (GSEA) for upregulated genes in CD4+ (C) and CD8+ T (D) cells using the MSigDB. The x‐axis shows the p‐value (−log10). E, Mitochondrial membrane potential in CD4+ and CD8+ T cells of Asxl1‐MTfl/fl [Vav‐Cre(−)] (n = 2) and Vav‐Cre; Asxl1‐MTfl/fl [Vav‐Cre(+)] (n = 3). Representative histograms (left panel) and median fluorescence intensities (right panel) are shown. F, Intracellular reactive oxygen species (ROS) levels in CD4+ and CD8+ T cells of Asxl1‐MTfl/fl [Vav‐Cre(−)] (n = 4) and Vav‐Cre; Asxl1‐MTfl/fl [Vav‐Cre(+)] (n = 6) mice. Representative histograms (left panel) and median fluorescence intensities (right panel) are shown. Data are shown as mean ± SEM. Unpaired t test was used for the comparison

Similar articles

Cited by

References

    1. Genovese G, Kähler AK, Handsaker RE, et al. Clonal hematopoiesis and blood‐cancer risk inferred from blood DNA sequence. N Engl J Med. 2014;371(26):2477‐2487. doi:10.1056/NEJMoa1409405 - DOI - PMC - PubMed
    1. Xie M, Lu C, Wang J, et al. Age‐related mutations associated with clonal hematopoietic expansion and malignancies. Nat Med. 2014;20(12):1472‐1478. doi:10.1038/nm.3733 - DOI - PMC - PubMed
    1. Kaner J, Desai P, Mencia‐Trinchant N, Guzman ML, Roboz GJ, Hassane DC. Clonal hematopoiesis and premalignant diseases. Cold Spring Harb Perspect Med. 2020;10(4):a035675. doi:10.1101/cshperspect.a035675 - DOI - PMC - PubMed
    1. Asada S, Kitamura T. Clonal hematopoiesis and associated diseases: a review of recent findings. Cancer Sci. 2021;112(10):3962‐3971. doi:10.1111/cas.15094 - DOI - PMC - PubMed
    1. Veiga CB, Lawrence EM, Murphy AJ, Herold MJ, Dragoljevic D. Myelodysplasia syndrome, clonal hematopoiesis and cardiovascular disease. Cancers. 2021;13(8):1968. doi:10.3390/cancers13081968 - DOI - PMC - PubMed